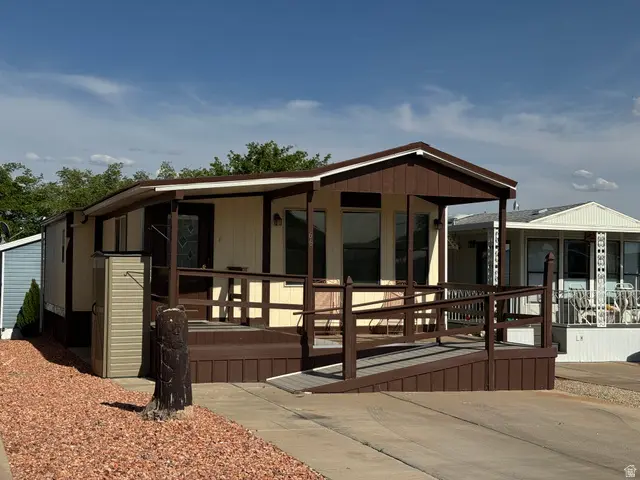
1150 W Red Pkwy #66 · Washington, UT
Flood risk 1/10 · Minimal
- FEMA flood zone
- X (unshaded)
- Chance of flooding over 30 yrs
- 0.0%
- Est. flood insurance / yr
- $507 – $1,088
Fire risk 7/10 · Major
- Est. fire insurance / yr
- $453 – $841
Heat risk 6/10 · Moderate
- Hot days now (above 104°F)
- 5 days/yr
- Hot days in 30 yrs
- 14 days/yr
Wind risk 1/10 · Minimal
- Chance of severe wind over 30 yrs
- —
Air-quality risk 2/10 · Minimal
- Unhealthy air days now
- 0 days/yr
- Unhealthy air days in 30 yrs
- 1 days/yr
Risk factors via First Street. Map © Google.
Why this score? — see what drove the B- grade
The composite is a weighted blend of 9 inputs, each scored 0–100. Each bar is that input's sub-score; the figure is the points it added to the 100-point composite (weight × sub-score).
- Cash flow +30.0/30.0
- 1% rule +10.0/10.0
- DSCR +10.0/10.0
- ARV discount +7.5/15.0
- Livability +3.8/5.0
- Schools +3.7/10.0
- Rent growth +2.5/5.0
- Condition / age +2.5/5.0
- Appreciation +0.0/10.0
$105,000
🖨 Deal sheet 📄 Offer letter ✓ Due diligence
Listing remarks MLS
Whether you are looking for a seasonal getaway or a permanent home in the red rocks, this property offers an unbeatable price point in a convenient location. Enjoy a 55+ community with low-maintenance living while being surrounded by the stunning vistas that Southern Utah is known for.
Key facts
- Stunning vistas
- Convenient location
- 2,178 sq ft lot
Tags
Property features AI
Finance
- HOA & community: Homeowners association with monthly fee; Monthly association fee of $139; Community features: clubhouse, fitness center, pool, spa/hot tub; Senior community (CANYON BREEZE RV RESORT)
Exterior
- Parking: 2 open/uncovered parking spaces
- Utilities: Electricity connected; Sewer connected; Water (culinary) connected
- Home design: Mobile home; Single-family use; Ramp for accessibility; PUD zoning
- Construction: Clapboard/Masonite exterior; Metal roof; Built/standing condition
- Exterior features: Awning(s); Covered deck; Curb and gutter; Paved road; Flat terrain
Interior
- Kitchen: Microwave; Refrigerator; Range/Oven (free-standing)
- Bedrooms: 3 rooms total (includes bedrooms and living areas)
- Flooring: Carpet
- Bathrooms: 1 full bathroom; 1 partial/half bathroom
- Heating & cooling: Electric heating; Central air; Heat pump
- Interior features: Disposal; Free-standing range/oven; Blinds; Storage shed(s)
- Laundry & utility: Washer; Dryer
Neighborhood map
What this means for you Summary
Snapshot
- This is a 2-bed/2.0-bath manufactured listed at $105k.
Deal economics
- At list price, monthly cash flow is $510 ($6k/yr) — positive.
- The deal already cash-flows at list — no discount required.
- Meets the 1% rule at list price ($2k rent vs $105k).
- Recommended offer: $102k (3.0% below list) — sets the bar for market timing.
Location & tenants
- Location reads 75/100 on livability (#59 in UT, #3,809 nationally) — a middle-class / working-renter tenant base. Strengths: commute A+, employment A+, housing A+; Watch: cost of living D, amenities F, health & safety F.
- Washington District (urban): math 42% / reading 45% proficiency, ranked #37 of 80 in UT (top 46%) — families likely to look elsewhere, expect single-tenant / working-renter base with shorter leases.
- Zoned schools: Sandstone School (math 21% / reading 28%, grade F, #474 of 585 statewide, top 83%, 506 students, 60% FRL); Pine View High (math 29% / reading 48%, grade F, #74 of 171 statewide, top 43%, 1,143 students, 33% FRL).
- Zoned-school proficiency averages 32% at this address vs 44% district-wide (-12 pts) — the specific schools serving this property underperform the Washington District average; the district grade overstates school quality for this exact location.
- Market conditions: Rents soft (-0.1%/yr); 1024 active listings in the ZIP; 1 comparable units currently listed for rent nearby; solid renter incomes; 3,140 units permitted in Washington County in 2024 (650 in 5+ unit buildings).
Forward outlook
- Local home prices are declining (-3.0%/yr); year-one equity from $726 of loan paydown is wiped out by about $3k of value loss. Plan a longer hold.
- Washington County population projected at +44% by 2050 — long-run rental-demand tailwind backs the buy-and-hold thesis.
- At projected returns (-3.0% appreciation + 0.0% rent growth), your $29k cash investment doubles in ~8 years — after that, you're playing with house money.
Negotiation context
- It's been on market 54 days — a 3% lower offer ($102k) is reasonable based on typical stale-listing flexibility.
- 7 sale attempts since 20y ago; this cycle's ask has dropped $15k (12%) from the opening price — seller is motivated, your offer sets the floor, not the list.
Risks & watch-outs
- Climate carrying-cost: major wildfire risk; extreme-heat days projected 5→14/yr by 2055 (HVAC capex compounding) — expect insurance premiums to compound above CPI over the hold.
Questions for the listing agent
- It's been on market 54 days. Have you received any prior offers? Is the seller open to a 3% concession, seller financing, or rate buy-down credit?
- What does the HOA fee cover, when was the last increase, and are there any pending special assessments or reserve-fund shortfalls?
- Is there a deadline driving the sale (1031 exchange, divorce, estate, relocation)? That informs how much negotiation room exists.
- What's the average days-on-market for RENTAL listings here right now (not sales)? A rising rental-DOM trend means longer vacancies and softer asking-rent achievability than the comps imply.
- What's the recent tenant-quality profile in this submarket — average credit score on applications, eviction rate, late-payment / NSF rate, and stable-employment percentage? A property-management company in the area should have these aggregated.
- How much new for-sale + rental construction is in the pipeline within 1–3 miles? Heavy new supply typically softens prices + rents 12–24 months out; constrained supply supports both.
Investment metrics
- 1% rule
- 1.55% ✓
- Cap rate
- 12.12%
- Cash-on-cash
- 20.80%
- DSCR
- 1.93
- GRM
- 5.4
CMA / ARV
No comps found within radius.
Projected returns pro-forma
-3.0% appreciation · 0.0% rent growth · sell at horizon
- IRR
- 9.6%
- Equity multiple
- 1.36×
- Total profit
- $10,718
- Equity at exit
- $15,656
- IRR
- 16.0%
- Equity multiple
- 2.12×
- Total profit
- $32,887
- Equity at exit
- $9,078
Cash invested: $29,400 (down + closing). Projections, not guarantees.
Landlord ↔ Tenant lean methodology
- Overall (STATE)
- 86 Strongly Landlord-Friendly
- State Utah
- 86 Strongly Landlord-Friendly · R+15
- County
- — inherits STATE
- City
- — inherits STATE
ZIP-level market 84780
- Rents YoY
- -0.1%
- Active inventory
- 1024
- Price-to-rent
- 5.4×
Monthly cashflow live
- Estimated rent
- $1,631 medium interval (Pro) →
- Mortgage (P&I)
- −$551
- Tax from tax record
- −$45 /mo · $542/yr
- Insurance
- −$44
- HOA
- −$139
- Vacancy / Maint / Mgmt
- −$342
- Net cashflow
- $510
Break-even live
UW: 25.0% down · 7.5% · 30yr · 1.5% tax · 5.0% vac · 8.0% maint · 8.0% mgmt
Financing live
Cash to close
- Down payment
- $26,250
- Closing costs
- $3,150
- Reserves months
- —
- Total cash needed
- —
Loan-product check · same deal, 3 products live
Conventional
25% down · 7.5% · 30yr
- Down + closing
- —
- Monthly P&I
- —
- Monthly cashflow
- —
- DSCR
- —
- Eligible?
- —
Personal DTI + credit; lowest rate.
DSCR
20% down · 8.5% · 30yr
- Down + closing
- —
- Monthly P&I
- —
- Monthly cashflow
- —
- DSCR
- —
- Eligible?
- —
No personal income docs; deal must DSCR.
Hard money
10% down · 12.0% · 12mo
- Down + closing
- —
- Monthly P&I
- —
- Monthly cashflow
- —
- DSCR
- —
- Eligible?
- —
Short-term bridge; refi at stabilization.
Rent comps 1 comps
| Address | Beds | Baths | Sqft | Rent | $/sqft | DOM | Units | Dist |
|---|---|---|---|---|---|---|---|---|
| 115 N 500 W Washington, UT | 1.0–3.0 | 1.0–2.0 | 912 | $1,810 | $1.98 | 21d | 1 | 0.57mi |
HOA detail
- Monthly dues
- $139 · $1,668/yr
Listing history 50 events
-
2026-06-19days on market $105,000 Active 54 DOM
-
2026-06-18days on market $105,000 Active 53 DOM
-
2026-06-17days on market $105,000 Active 52 DOM
-
2026-06-16days on market $105,000 Active 51 DOM
-
2026-06-15days on market $105,000 Active 50 DOM
-
2026-06-14days on market $105,000 Active 48 DOM
-
2026-06-13days on market $105,000 Active 47 DOM
-
2026-06-10days on market $105,000 Active 45 DOM
-
2026-06-09days on market $105,000 Active 44 DOM
-
2026-06-08days on market $105,000 Active 43 DOM
-
2026-06-07days on market $105,000 Active 42 DOM
-
2026-06-05days on market $105,000 Active 39 DOM
-
2026-06-02days on market $105,000 Active 37 DOM
-
2026-06-01days on market $105,000 Active 36 DOM
-
2026-05-31days on market $105,000 Active 35 DOM
-
2026-05-30days on market $105,000 Active 34 DOM
-
2026-05-08price $105,000
Show marketing remark (286 chars)
Whether you are looking for a seasonal getaway or a permanent home in the red rocks, this property offers an unbeatable price point in a convenient location. Enjoy a 55+ community with low-maintenance living while being surrounded by the stunning vistas that Southern Utah is known for.
-
2026-05-08price $105,000 286-char remark
Show marketing remark (286 chars)
Whether you are looking for a seasonal getaway or a permanent home in the red rocks, this property offers an unbeatable price point in a convenient location. Enjoy a 55+ community with low-maintenance living while being surrounded by the stunning vistas that Southern Utah is known for.
-
2026-04-30status Active
Show marketing remark (286 chars)
Whether you are looking for a seasonal getaway or a permanent home in the red rocks, this property offers an unbeatable price point in a convenient location. Enjoy a 55+ community with low-maintenance living while being surrounded by the stunning vistas that Southern Utah is known for.
-
2026-04-30status Active 286-char remark
Show marketing remark (286 chars)
Whether you are looking for a seasonal getaway or a permanent home in the red rocks, this property offers an unbeatable price point in a convenient location. Enjoy a 55+ community with low-maintenance living while being surrounded by the stunning vistas that Southern Utah is known for.
-
2026-04-24status Under Contract
Show marketing remark (286 chars)
Whether you are looking for a seasonal getaway or a permanent home in the red rocks, this property offers an unbeatable price point in a convenient location. Enjoy a 55+ community with low-maintenance living while being surrounded by the stunning vistas that Southern Utah is known for.
-
2026-04-24status Pending 286-char remark
Show marketing remark (286 chars)
Whether you are looking for a seasonal getaway or a permanent home in the red rocks, this property offers an unbeatable price point in a convenient location. Enjoy a 55+ community with low-maintenance living while being surrounded by the stunning vistas that Southern Utah is known for.
-
2026-04-20$120,000 Active
Show marketing remark (286 chars)
Whether you are looking for a seasonal getaway or a permanent home in the red rocks, this property offers an unbeatable price point in a convenient location. Enjoy a 55+ community with low-maintenance living while being surrounded by the stunning vistas that Southern Utah is known for.
-
2026-04-20$120,000 Active 286-char remark
Show marketing remark (286 chars)
Whether you are looking for a seasonal getaway or a permanent home in the red rocks, this property offers an unbeatable price point in a convenient location. Enjoy a 55+ community with low-maintenance living while being surrounded by the stunning vistas that Southern Utah is known for.
-
2026-03-17historical
-
2025-11-11price $130,000
-
2025-11-11price $130,000
-
2025-11-11price $130,000
-
2025-10-20price $137,500
-
2025-10-20price $137,500
-
2025-10-20price $137,500
-
2025-08-06price $141,900
-
2025-08-06price $141,900
-
2025-08-06price $141,900
-
2025-06-19price $146,500
-
2025-06-19price $146,500
-
2025-06-19price $146,500
-
2025-03-14price $147,500
-
2025-03-14price $147,500
-
2025-03-14price $147,500
-
2025-02-27price $154,500
-
2025-02-27price $154,500
-
2025-02-27price $154,500
-
2025-01-07$156,900 Active
-
2025-01-07$156,900 Active
-
2007-05-17soldstatus
-
2007-02-26historical
-
2006-12-19$85,900
-
2005-09-06soldstatus
-
2005-09-06soldstatus
ⓘ Source: listings_history table (triggers on properties + properties_extension) + one-shot
backfill from property_details.listing_events for pre-trigger history.
Tax reassessment forecast UT · Resets to sale price
- Current annual tax
- $542 · $45/mo
- Projected year-2 tax
- $693 · $58/mo
- Expected delta
- +$151/yr (+$13/mo · 27.8%)
ⓘ Screening estimate from a state-policy table — verify with the county assessor before closing.
Climate risk First Street
- Flood 1/10 Low FEMA zone X (unshaded) · 0% chance over 30 yrs
- Wildfire 7/10 Severe
- Heat 6/10 Major 5 d/yr ≥104°F today · 14 d/yr by 30 yrs out
- Wind 1/10 Low
- Air quality 2/10 Low 0 unhealthy d/yr today · 1 by 30 yrs out
Nearby sold comps map
Loading sold comps map…
Walkable amenities ~0.75 mi
Loading nearby amenities…
Taxation est. · year 1
- Rental income
- $19,566
- − Mortgage interest
- −$5,882
- − Property taxes
- −$542
- − Insurance
- −$525
- − Repairs & maintenance
- −$1,565
- − Management
- −$1,565
- − HOA
- −$1,668
- − Depreciation
- −$3,055
- Taxable income
- $4,764
- Est. tax owed @ 24.0%
- −$1,143
- After-tax cash flow
- $4,971/yr
For passive investors: Depreciation is non-cash, so a rental often shows a tax loss while cash-flowing — sheltering income. Rental losses are passive: they offset passive income freely, and up to $25,000/yr can offset ordinary (W-2) income if you actively participate and your MAGI is under $100k (phasing out to $0 by $150k); unused losses carry forward. On sale, claimed depreciation is recaptured at up to 25%, and gains may owe capital-gains tax (a 1031 exchange can defer both). Figures are a year-1 estimate at your 24.0% rate — not tax advice; consult a CPA.
Schools (NCES district)
- District
- Washington District
- NCES district ID
- 4901140
- Math proficiency
- 42% ▼ -3.00%
- Reading proficiency
- 45% ▼ -3.00%
- Median HH income
- $50,861
- Composite
- 37.47/100
- National rank
- #4408
- State rank
- #37 of 80 in UT
Livability — Washington
- Score
- 75/100
- State rank
- #59
- US rank
- #3809
Category grades
Schools grade is shown separately in the Schools card above.
Census & demographics
- Census place
- Washington, UT
- County
- Washington County · 179,216 people
- City population
- 32,366
- Metro
- St. George, UT
- Population (ZIP)
- 32,366
- Household income
- $91,963
- Rent vs Own
- Severe rent burden
- 1036.0
Population outlook (Washington County) Hauer SSP2
- Today (2025)
- 193,324 people
- By 2030
- 211,699 · +9.5%
- By 2040
- 246,449 · +27.5%
- By 2050
- 278,447 · +44.0%
- By 2075
- 342,734 · +77.3%
- By 2100
- 382,815 · +98.0%
Race, ethnicity, and origin ACS 2023
- Neighborhood character
- Predominantly White (77%)
- Race & ethnicity
- White 77% Hispanic / Latino 17% Two or more races 9%
- Hispanic origin (detail)
- Mexican 11% Puerto Rican 1%
- Common ancestry
- Italian 6% Slovak 5% Lithuanian 3%
- Foreign-born
- 5% · Canada, Jamaica, China
- Languages at home
- 89% English-only · Spanish 8% Chinese 1% German/W. Germanic 1%
Political lean MEDSL · Washington
- 2024 margin
- Solid R (+52.3) · D 23.0% · R 75.2% · Other 1.8%
- 2008→2024 swing
- +1.2pp toward D · 2008: -53.5pp · 2024: -52.3pp
- All cycles
- 2024: R+52.3 2020: R+51.7 2016: R+52.1 2012: R+67.0 2008: R+53.5
Not yet ingested
- Civics
- —
Market trends
- HPI YoY
- ▼ -144.73%
- Current HPI
- 248.9421
- Rent YoY
- ▼ -0.06%
- Metro
- St. George, UT
- State GDP YoY
- ▲ 3.54%
- F500 in state
- 2
Industry mix (Fortune 500 HQ in UT)
| Industry | F500 HQs | Revenue |
|---|---|---|
| Financial Services | 1 | $3B |
|
||
Price history
+22.2% since first listed38 events — show timeline
- 2026-05-08 Price Changed $105,000 WFRMLS
- 2026-05-08 Price Changed $105,000 WCBOR
- 2026-04-30 Relisted — WFRMLS
- 2026-04-30 Relisted — WCBOR
- 2026-04-24 Pending — WFRMLS
- 2026-04-24 Pending — WCBOR
- 2026-04-20 Listed $120,000 WFRMLS
- 2026-04-20 Listed $120,000 WCBOR
- 2026-03-17 Listing Removed — WFRMLS
- 2025-11-11 Price Changed $130,000 WCBOR
- 2025-11-11 Price Changed $130,000 ICBORMLS
- 2025-11-11 Price Changed $130,000 WFRMLS
- 2025-10-20 Price Changed $137,500 ICBORMLS
- 2025-10-20 Price Changed $137,500 WCBOR
- 2025-10-20 Price Changed $137,500 WFRMLS
- 2025-08-06 Price Changed $141,900 WCBOR
- 2025-08-06 Price Changed $141,900 ICBORMLS
- 2025-08-06 Price Changed $141,900 WFRMLS
- 2025-06-19 Price Changed $146,500 WCBOR
- 2025-06-19 Price Changed $146,500 ICBORMLS
- 2025-06-19 Price Changed $146,500 WFRMLS
- 2025-03-14 Price Changed $147,500 WFRMLS
- 2025-03-14 Price Changed $147,500 WCBOR
- 2025-03-14 Price Changed $147,500 ICBORMLS
- 2025-02-27 Price Changed $154,500 WCBOR
- 2025-02-27 Price Changed $154,500 ICBORMLS
- 2025-02-27 Price Changed $154,500 WFRMLS
- 2025-01-07 Listed $156,900 ICBORMLS
- 2025-01-07 Listed $156,900 WFRMLS
- 2007-05-17 Sold (Public Records) — Public Records
- 2007-02-26 Listing Removed — WFRMLS
- 2006-12-19 Listed $85,900 WFRMLS
- 2005-09-06 Sold (Public Records) — Public Records
- 2005-09-06 Sold (Public Records) — Public Records
- 2005-09-06 Sold (Public Records) — Public Records
- 2005-04-08 Sold (Public Records) — Public Records
- 2004-12-22 Sold (Public Records) — Public Records
- 2004-12-17 Sold (Public Records) — Public Records
Property tax history
+8.0%/yrLatest (2025): $542 · +49.8% YoY. Source: county tax records.
Cash-flow waterfall
monthlySold comps — $/sqft
last 12 mo · ≤1 miLoading sold comps…