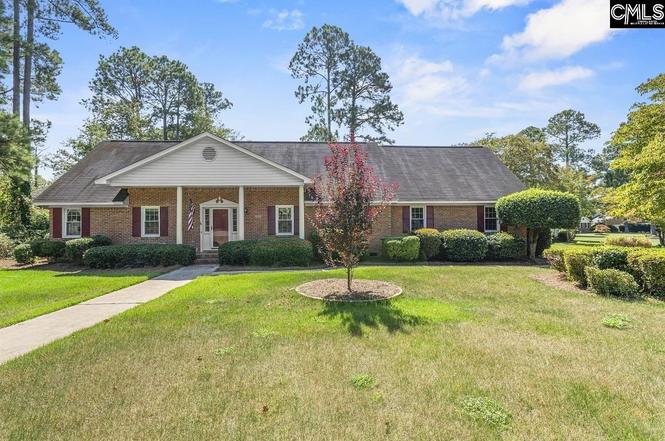
816 Kinlock Ct · Dentsville, SC
Flood risk 1/10 · Minimal
- FEMA flood zone
- X
- Chance of flooding over 30 yrs
- 0.0%
- Est. flood insurance / yr
- $435 – $905
Fire risk 2/10 · Minimal
- Est. fire insurance / yr
- $783 – $1,453
Heat risk 6/10 · Moderate
- Hot days now (above threshold)
- 7 days/yr
- Hot days in 30 yrs
- 15 days/yr
Wind risk No data
- Chance of severe wind over 30 yrs
- —
Air-quality risk No data
- Unhealthy air days now
- —
- Unhealthy air days in 30 yrs
- —
Risk factors via First Street. Map © Google.
Why this score? — see what drove the D grade
The composite is a weighted blend of 9 inputs, each scored 0–100. Each bar is that input's sub-score; the figure is the points it added to the 100-point composite (weight × sub-score).
- Cash flow +15.1/30.0
- ARV discount +7.5/15.0
- DSCR +4.6/10.0
- Schools +3.6/10.0
- Livability +3.6/5.0
- 1% rule +3.1/10.0
- Rent growth +2.6/5.0
- Condition / age +2.5/5.0
- Appreciation +0.0/10.0
$350,000
🖨 Deal sheet (PDF) 📄 Offer letter ✓ Due diligence
Listing remarks
Bring all offers. Golden opportunity to negotiate on a lovely home in the prestigious Spring Valley gated community close to Interstates I-20, I-77 . This 4-Bd, 3-Ba brick home offers the perfect mix of character and comfort. Built in 1974 with enduring quality, the home features: hardwood floors on the first level and carpeted floors upstairs. Fireplace in great room, bonus room over garage - ideal for a 5th bedroom, office or playroom, fenced backyard with a charming gazebo w/ power. Disclaimer: CMLS has not reviewed and therefore, does not endorse vendors who may appear in listings. Disclaimer: CMLS has not reviewed and, therefore, does not endorse vendors who may appear in listings.
Key facts
- Charming gazebo
- Carpeted floors
- Bonus room
Tags
Property features AI
Finance
- Other: Private-maintenance paved road
- HOA & community: Property is part of an association
Exterior
- Parking: Total of 6 parking spaces; Attached side-entry 2-car garage at main level; Enclosed garage (listed among other rooms)
- Utilities: Public water; Public sewer
- Home design: Two-story home
- Construction: Brick exterior above foundation; Crawlspace foundation
- Exterior features: Sprinkler system; Covered front porch; Uncovered back porch; Chain-link fencing at rear only
Interior
- Kitchen: Eat-in kitchen; Pantry; Granite countertops with granite backsplash; Painted cabinets; Stove exhaust vented to exterior; Dishwasher
- Bedrooms: Master bedroom with built-ins and private bath (second level); Additional bedrooms on second level; One bedroom on main level
- Flooring: Hardwood floors in formal living, dining, and great room; Carpet in master bedroom
- Bathrooms: Three full bathrooms total; One full main-level bath; Two additional full baths
- Heating & cooling: Central heating; Central cooling
- Interior features: Hardwood floors in formal living and dining rooms; Molding in formal living and dining rooms; Bookshelves in great room; Fireplace in great room; French doors in great room; Ceiling fans in great room, kitchen, and master bedroom; One fireplace
- Laundry & utility: Main-level laundry in a heated utility room
Neighborhood map
What this means for you Summary
Snapshot
- This is a 4-bed/3.0-bath single-family listed at $350k.
Deal economics
- At list price, monthly cash flow is $114 ($1k/yr) — positive.
- The deal already cash-flows at list — no discount required.
- To meet the 1% rule (rent ≥ 1% of price), the offer needs to be $285k (18.6% below list).
- Recommended offer: $285k (18.6% below list) — sets the bar for 1% rule.
Location & tenants
- Location reads 71/100 on livability (#50 in SC) — a middle-class / working-renter tenant base. Strengths: cost of living A+, health & safety A+, housing A; Watch: amenities D+, crime F, commute F.
- Richland 02 (suburban): math 35% / reading 47% proficiency, ranked #29 of 80 in SC (top 36%) — families likely to look elsewhere, expect single-tenant / working-renter base with shorter leases.
- Zoned schools: L. B. Nelson Elementary (math 39% / reading 43%, grade F, #276 of 597 statewide, top 48%, 567 students, 76% FRL); Spring Valley High (math 53% / reading 92%, grade B+, #46 of 196 statewide, top 24%, 2,187 students, 49% FRL) — zoned schools average 62% FRL vs 38% district-wide (24 pts higher); higher-poverty schools than district average — tighter screening recommended.
- Zoned-school proficiency averages 57% at this address vs 41% district-wide (+16 pts) — the actual schools serving this property are materially stronger than the Richland 02 average implies; a family-tenant draw the district grade alone would hide.
- Market conditions: Rents flat; 341 active listings in the ZIP; 3 comparable units currently listed for rent nearby; rentals leasing fast (median 5d on market — plan ~1-2 weeks tenant-placement turnaround); 3,472 units permitted in Richland County in 2024 (1,096 in 5+ unit buildings).
- At $2,850/mo this rent would consume 55% of the median local household income ($62k/yr) (locally 2857% of renters already pay >50% of income on rent) — very limited rent-growth headroom before tenants either downsize or default.
Forward outlook
- Local home prices are declining (-3.0%/yr); year-one equity from $2k of loan paydown is wiped out by about $10k of value loss. Plan a longer hold.
- Richland County population projected at +30% by 2050 — long-run rental-demand tailwind backs the buy-and-hold thesis.
Negotiation context
- It's been on market 265 days — a 12% lower offer ($308k) is reasonable based on typical stale-listing flexibility.
- Current owner paid $200k; list at $350k implies a 75% gain — meaningful room to come down on a strong offer.
Risks & watch-outs
- Climate carrying-cost: extreme-heat days projected 7→15/yr by 2055 (HVAC capex compounding) — expect insurance premiums to compound above CPI over the hold.
Questions for the listing agent
- It's been on market 265 days. Have you received any prior offers? Is the seller open to a 19% concession, seller financing, or rate buy-down credit?
- Built in 1974 — when were the roof, HVAC, electrical panel, plumbing, and water heater last replaced?
- What does the HOA fee cover, when was the last increase, and are there any pending special assessments or reserve-fund shortfalls?
- Why hasn't it sold? Are there any deal-killer items the seller is aware of (foundation, flood, title, zoning, code violations)?
- Is there a deadline driving the sale (1031 exchange, divorce, estate, relocation)? That informs how much negotiation room exists.
- Schools are D-rated, which usually means shorter tenancies and higher turnover. Who's the typical renter profile here, and what's been the actual vacancy rate?
- Crime grade is F in this area — have there been break-ins, vandalism, or insurance claims at this property in the last 3 years? What carrier currently insures it and at what premium?
- The area grade is low — what's the realistic commute time and amenity access for the typical tenant pool here? Any planned neighborhood developments (good or bad) we should know about?
- What's the average days-on-market for RENTAL listings here right now (not sales)? A rising rental-DOM trend means longer vacancies and softer asking-rent achievability than the comps imply.
- What's the recent tenant-quality profile in this submarket — average credit score on applications, eviction rate, late-payment / NSF rate, and stable-employment percentage? A property-management company in the area should have these aggregated.
- How much new for-sale + rental construction is in the pipeline within 1–3 miles? Heavy new supply typically softens prices + rents 12–24 months out; constrained supply supports both.
Investment metrics
- 1% rule
- 0.81% ✗
- Cap rate
- 6.68%
- Cash-on-cash
- 1.40%
- DSCR
- 1.06
- GRM
- 10.2
CMA / ARV
No comps found within radius.
Projected returns pro-forma
-3.0% appreciation · 0.21% rent growth · sell at horizon
- IRR
- -16.9%
- Equity multiple
- 0.41×
- Total profit
- $-57,370
- Equity at exit
- $52,186
- IRR
- -14.3%
- Equity multiple
- 0.27×
- Total profit
- $-71,340
- Equity at exit
- $30,262
Cash invested: $98,000 (down + closing). Projections, not guarantees.
Landlord ↔ Tenant lean methodology
- Overall (STATE)
- 90 Strongly Landlord-Friendly
- State South Carolina
- 90 Strongly Landlord-Friendly · R+6
- County
- — inherits STATE
- City
- — inherits STATE
ZIP-level market 29223
- Rents YoY
- 0.2%
- Active inventory
- 341
- Price-to-rent
- 10.2×
Monthly cashflow live
- Estimated rent
- $2,850 medium interval (Pro) →
- Mortgage (P&I)
- −$1,835
- Tax from tax record
- −$60 /mo · $719/yr
- Insurance
- −$146
- HOA
- −$96
- Vacancy / Maint / Mgmt
- −$598
- Net cashflow
- $114
Break-even live
Sensitivity live
| Price | -10% $312 | -5% $213 | +0% $114 | +5% $-385 | +10% $-506 |
|---|---|---|---|---|---|
| Rent | -10% $-111 | -5% $1 | +0% $114 | +5% $227 | +10% $339 |
| Rate | -1.0pp $290 | -0.5pp $203 | base $114 | +0.5pp $23 | +1.0pp $-69 |
UW: 25.0% down · 7.5% · 30yr · 1.5% tax · 5.0% vac · 8.0% maint · 8.0% mgmt
Financing live
Cash to close
- Down payment
- $87,500
- Closing costs
- $10,500
- Reserves months
- —
- Total cash needed
- —
Loan-product check · same deal, 3 products live
Conventional
25% down · 7.5% · 30yr
- Down + closing
- —
- Monthly P&I
- —
- Monthly cashflow
- —
- DSCR
- —
- Eligible?
- —
Personal DTI + credit; lowest rate.
DSCR
20% down · 8.5% · 30yr
- Down + closing
- —
- Monthly P&I
- —
- Monthly cashflow
- —
- DSCR
- —
- Eligible?
- —
No personal income docs; deal must DSCR.
Hard money
10% down · 12.0% · 12mo
- Down + closing
- —
- Monthly P&I
- —
- Monthly cashflow
- —
- DSCR
- —
- Eligible?
- —
Short-term bridge; refi at stabilization.
Rent comps 3 comps
| Address | Beds | Baths | Sqft | Rent | $/sqft | DOM | Units | Dist |
|---|---|---|---|---|---|---|---|---|
| 123 Valley Springs Rd Columbia, SC | 4.0 | 3.0 | 2765 | $2,900 | $1.05 | 13d | 1 | 0.40mi |
| 525 Meadowbrook Dr Columbia, SC | 4.0 | 3.0 | 2958 | $3,095 | $1.05 | 5d | 1 | 1.05mi |
| 405 Park Lake Cir Columbia, SC | 4.0 | 3.5 | 4450 | $4,000 | $0.90 | 4d | 1 | 1.11mi |
HOA detail
- Monthly dues
- $96 · $1,152/yr
- Likely covers
- security
Listing history 23 events
-
2026-06-22days on market $350,000 Active 265 DOM
-
2026-06-18days on market $350,000 Active 262 DOM
-
2026-06-17days on market $350,000 Active 261 DOM
-
2026-06-16days on market $350,000 Active 260 DOM
-
2026-06-15days on market $350,000 Active 259 DOM
-
2026-06-14days on market $350,000 Active 257 DOM
-
2026-06-13days on market $350,000 Active 256 DOM
-
2026-06-10days on market $350,000 Active 254 DOM
-
2026-06-09days on market $350,000 Active 253 DOM
-
2026-06-08days on market $350,000 Active 252 DOM
-
2026-06-07days on market $350,000 Active 251 DOM
-
2026-06-05days on market $350,000 Active 248 DOM
-
2026-06-03days on market $350,000 Active 247 DOM
-
2026-06-03days on market $350,000 Active 246 DOM
-
2026-06-01days on market $350,000 Active 245 DOM
-
2026-05-31days on market $350,000 Active 244 DOM
-
2026-05-22price $350,000
-
2026-05-08price $380,000
-
2025-12-12price $395,000
-
2025-09-25$409,900 Active
-
2013-02-06soldstatus $200,000
-
1986-09-01soldstatus $138,000
-
1981-11-01soldstatus $123,500
ⓘ Source: listings_history table (triggers on properties + properties_extension) + one-shot
backfill from property_details.listing_events for pre-trigger history.
Tax reassessment forecast SC · Resets to sale price
- Current annual tax
- $719 · $60/mo
- Projected year-2 tax
- $1,995 · $166/mo
- Expected delta
- +$1,276/yr (+$106/mo · 177.5%)
ⓘ Screening estimate from a state-policy table — verify with the county assessor before closing.
Climate risk First Street
- Flood 1/10 Low FEMA zone X · 0% chance over 30 yrs
- Wildfire 2/10 Low
- Heat 6/10 Major
Nearby sold comps map
Loading sold comps map…
Walkable amenities ~0.75 mi
Loading nearby amenities…
Taxation est. · year 1
- Rental income
- $34,195
- − Mortgage interest
- −$19,605
- − Property taxes
- −$719
- − Insurance
- −$1,750
- − Repairs & maintenance
- −$2,736
- − Management
- −$2,736
- − HOA
- −$1,152
- − Depreciation
- −$10,182
- Taxable loss
- −$4,685
- Est. tax savings @ 24.0%
- +$1,124
- After-tax cash flow
- $2,492/yr
For passive investors: Depreciation is non-cash, so a rental often shows a tax loss while cash-flowing — sheltering income. Rental losses are passive: they offset passive income freely, and up to $25,000/yr can offset ordinary (W-2) income if you actively participate and your MAGI is under $100k (phasing out to $0 by $150k); unused losses carry forward. On sale, claimed depreciation is recaptured at up to 25%, and gains may owe capital-gains tax (a 1031 exchange can defer both). Figures are a year-1 estimate at your 24.0% rate — not tax advice; consult a CPA.
Schools (NCES district)
- District
- Richland 02
- NCES district ID
- 4503390
- Math proficiency
- 35% ▼ -15.00%
- Reading proficiency
- 47% ▼ -5.00%
- Median HH income
- $59,684
- Composite
- 36.2/100
- National rank
- #4730
- State rank
- #29 of 80 in SC
Livability — Dentsville
- Score
- 71/100
- State rank
- #50
- US rank
- #6940
Category grades
Schools grade is shown separately in the Schools card above.
Census & demographics
- County
- Richland County · 389,530 people
- City population
- 52,835
- Metro
- Columbia, SC
- Population (ZIP)
- 53,074
- Household income
- $62,408
- Rent vs Own
- Severe rent burden
- 2857.0
Population outlook (Richland County) Hauer SSP2
- Today (2025)
- 459,667 people
- By 2030
- 487,524 · +6.1%
- By 2040
- 542,035 · +17.9%
- By 2050
- 595,371 · +29.5%
- By 2075
- 732,998 · +59.5%
- By 2100
- 820,415 · +78.5%
Race, ethnicity, and origin ACS 2023
- Neighborhood character
- Diverse neighborhood (Simpson 0.60)
- Race & ethnicity
- Black 57% White 23% Hispanic / Latino 11% Two or more races 6% Asian 4%
- Hispanic origin (detail)
- Mexican 5% Puerto Rican 2%
- Common ancestry
- Slovak 1% Serbian 1% Italian 1%
- Foreign-born
- 10% · Canada, South Korea
- Languages at home
- 86% English-only · Spanish 8% Other Indo-European 2% Korean 1%
Political lean MEDSL · Richland
- 2024 margin
- Solid D (+34.6) · D 66.4% · R 31.8% · Other 1.8%
- 2008→2024 swing
- +5.7pp toward D · 2008: 28.9pp · 2024: 34.6pp
- All cycles
- 2024: D+34.6 2020: D+38.3 2016: D+32.9 2012: D+33.3 2008: D+28.9
Not yet ingested
- Civics
- —
Market trends
- HPI YoY
- ▼ -135.96%
- Current HPI
- 195.3158
- Rent YoY
- ▲ 0.21%
- Metro
- Columbia, SC
- State GDP YoY
- ▲ 4.51%
- F500 in state
- 2
Industry mix (Fortune 500 HQ in SC)
| Industry | F500 HQs | Revenue |
|---|---|---|
| Packaging | 1 | $7B |
|
||
Price history
+183.4% since first listed7 events — show timeline
- 2026-05-22 Price Changed $350,000 Consolidated MLS
- 2026-05-08 Price Changed $380,000 Consolidated MLS
- 2025-12-12 Price Changed $395,000 Consolidated MLS
- 2025-09-25 Listed $409,900 Consolidated MLS
- 2013-02-06 Sold (Public Records) $200,000 Public Records
- 1986-09-01 Sold (Public Records) $138,000 Public Records
- 1981-11-01 Sold (Public Records) $123,500 Public Records
Property tax history
-9.3%/yrLatest (2025): $719 · +3.6% YoY. Source: county tax records.
Cash-flow waterfall
monthlySold comps — $/sqft
last 12 mo · ≤1 miLoading sold comps…