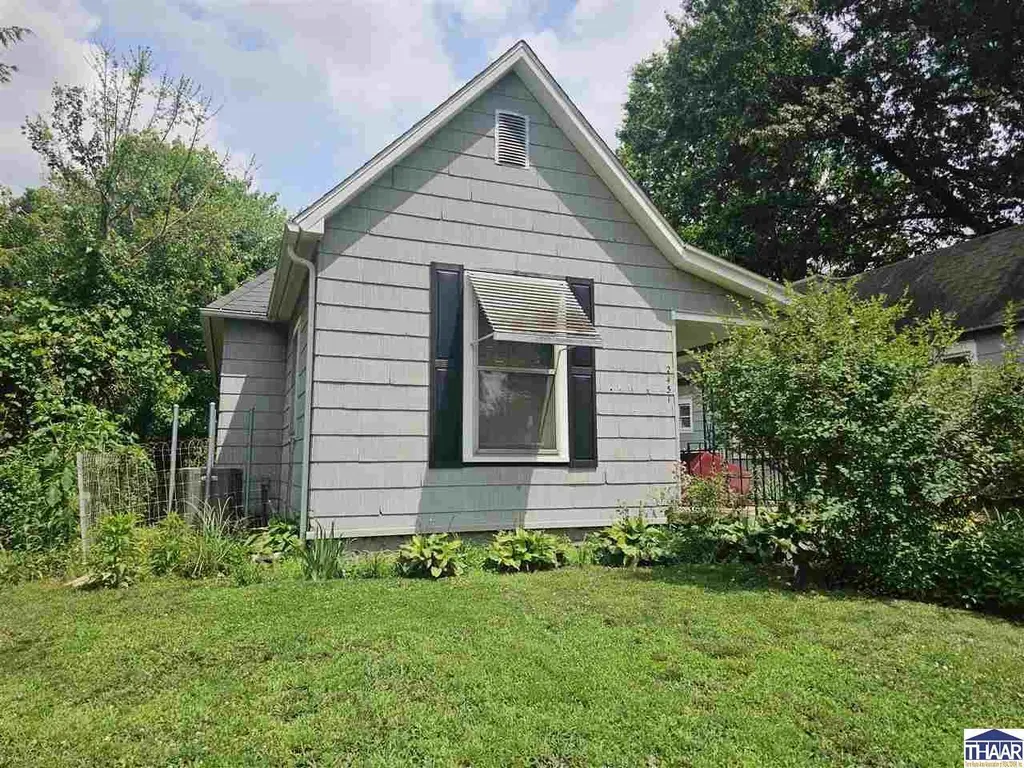
2431 N 15th St · Terre Haute, IN
Flood risk 1/10 · Minimal
- FEMA flood zone
- X (unshaded)
- Chance of flooding over 30 yrs
- 0.0%
- Est. flood insurance / yr
- $473 – $860
Fire risk 1/10 · Minimal
- Est. fire insurance / yr
- $717 – $1,331
Heat risk 4/10 · Minor
- Hot days now (above 105°F)
- 7 days/yr
- Hot days in 30 yrs
- 19 days/yr
Wind risk 2/10 · Minimal
- Chance of severe wind over 30 yrs
- 1.0%
Air-quality risk 3/10 · Minor
- Unhealthy air days now
- 3 days/yr
- Unhealthy air days in 30 yrs
- 4 days/yr
Risk factors via First Street. Map © Google.
Why this score? — see what drove the C- grade
The composite is a weighted blend of 9 inputs, each scored 0–100. Each bar is that input's sub-score; the figure is the points it added to the 100-point composite (weight × sub-score).
- Cash flow +17.0/30.0
- ARV discount +15.0/15.0
- DSCR +5.3/10.0
- 1% rule +4.6/10.0
- Livability +3.8/5.0
- Schools +2.9/10.0
- Rent growth +2.5/5.0
- Condition / age +2.5/5.0
- Appreciation +0.0/10.0
$109,900
🖨 Deal sheet (PDF) 📄 Offer letter ✓ Due diligence
Listing remarks
Public Open House Saturday, June 13 from Noon to 2pm. Don't miss your chance to tour this charming 3-bedroom, 1-bath home! Features include fresh paint, new carpet in the living room and hallway, a full basement with plenty of storage, and an oversized detached 1-car garage. Whether you're a first-time buyer or looking to downsize, this home offers comfort, space, and value. Come see all it has to offer and imagine making it your own! Let's connect to schedule an in-person tour or stop by the Open House!
Key facts
- 5,227 sq ft lot
- Garage
- Built 1900
Property features AI
Exterior
- Parking: Detached 1-car garage
- Security: Smoke detector(s)
- Utilities: Public sewer
- Home design: Single family residence; Single-story; Residential property
- Construction: Shingle roof
- Exterior features: Covered patio/porch; 40 x 130 lot (0.12 acres); Zoned R
Interior
- Kitchen: Electric range; Electric oven; Refrigerator; Dishwasher not listed
- Bedrooms: 1-story home layout
- Flooring: Carpet
- Bathrooms: 1 full bathroom
- Heating & cooling: Natural gas heating; Central air; Wall/window unit(s)
- Interior features: Insulated windows; Full unfinished basement; Smoke detector(s)
- Laundry & utility: Washer; Dryer
Neighborhood map
What this means for you Summary
Snapshot
- This is a 2-bed/1.0-bath single-family listed at $110k.
Deal economics
- At list price, monthly cash flow is $75 ($895/yr) — positive.
- The deal already cash-flows at list — no discount required.
- To meet the 1% rule (rent ≥ 1% of price), the offer needs to be $106k (3.9% below list).
- Recommended offer: $106k (3.9% below list) — sets the bar for 1% rule.
- Cap rate 7.1% vs local median 4.7% in Terre Haute — top-decile yield for the area; either an underpriced asset or a hidden risk that comps aren't pricing in. Stress-test before assuming the spread holds.
Location & tenants
- Location reads 75/100 on livability (#63 in IN, #4,186 nationally) — a middle-class / working-renter tenant base. Strengths: cost of living A+, housing A+, health & safety A+; Watch: crime F, employment F.
- Vigo County School Corporation (urban): math 32% / reading 37% proficiency, ranked #202 of 301 in IN (top 67%) — families likely to look elsewhere, expect single-tenant / working-renter base with shorter leases.
- Zoned schools: Terre Town Elementary School (math 43% / reading 35%, grade F, #530 of 994 statewide, top 54%, 556 students, 82% FRL); Otter Creek Middle School (math 13% / reading 25%, grade F, #274 of 330 statewide, top 83%, 787 students, 65% FRL); Terre Haute North Vigo High School (math 25% / reading 62%, grade F, #191 of 369 statewide, top 52%, 1,507 students, 51% FRL) — zoned schools average 66% FRL vs 47% district-wide (19 pts higher); higher-poverty schools than district average — tighter screening recommended.
- Market conditions: 66 active listings in the ZIP; 10 comparable units currently listed for rent nearby; rentals lingering (median 45d on market — plan ~5-8 weeks vacancy on turnover, expect pricing pressure); 100% of comp listings sitting > 30 days — soft ceiling on asking rent; lower-income renter base — watch delinquency; 60 units permitted in Vigo County in 2024 (0 in 5+ unit buildings).
- This rent runs 31% of the median local income ($41k/yr) — at the standard rent-burdened threshold; future hikes will face affordability resistance.
Forward outlook
- Local home prices are declining (-3.0%/yr); year-one equity from $760 of loan paydown is wiped out by about $3k of value loss. Plan a longer hold.
- Vigo County population projected to shrink 5% by 2050 — rents likely to lag national; underwrite the cash flow, not the appreciation.
Negotiation context
- Only 9 days on market — expect competitive offers; lowballing is unlikely to land.
Risks & watch-outs
- Watch-outs: built in 1900 — expect roof / HVAC / electrical / plumbing capex.
Questions for the listing agent
- Built in 1900 — when were the roof, HVAC, electrical panel, plumbing, and water heater last replaced?
- Is there a deadline driving the sale (1031 exchange, divorce, estate, relocation)? That informs how much negotiation room exists.
- Schools are D-rated, which usually means shorter tenancies and higher turnover. Who's the typical renter profile here, and what's been the actual vacancy rate?
- Crime grade is F in this area — have there been break-ins, vandalism, or insurance claims at this property in the last 3 years? What carrier currently insures it and at what premium?
- What's the average days-on-market for RENTAL listings here right now (not sales)? A rising rental-DOM trend means longer vacancies and softer asking-rent achievability than the comps imply.
- What's the recent tenant-quality profile in this submarket — average credit score on applications, eviction rate, late-payment / NSF rate, and stable-employment percentage? A property-management company in the area should have these aggregated.
- How much new for-sale + rental construction is in the pipeline within 1–3 miles? Heavy new supply typically softens prices + rents 12–24 months out; constrained supply supports both.
Investment metrics
- 1% rule
- 0.96% ✗
- Cap rate
- 7.11%
- Cash-on-cash
- 2.91%
- DSCR
- 1.13
- GRM
- 8.7
CMA / ARV
- ARV (on-the-fly)
- $133,399
- Comps found
- 12
Show comp detail 12 sales within ~0.75 mi
| Address | Dist | Beds/Ba | Sqft | Sold | Price | $/sf | Match |
|---|---|---|---|---|---|---|---|
| 1535 Barbour Ave | 0.15mi | 2/1.0 | 1,070 (-4%) | 0mo | $122,000 | $114 | 86 |
| 2516 N 14th St | 0.17mi | 2/1.0 | 1,006 (-10%) | 3mo | $122,500 | $122 | 72 |
| 1433 Grand Ave | 0.28mi | 3/2.0 (+1) | 1,152 (+3%) | 5mo | $125,000 | $109 | 69 |
| 3112 N 11th St | 0.70mi | 2/1.0 | 1,120 (-0%) | 4mo | $160,000 | $143 | 64 |
| 1817 Garfield Ave | 0.66mi | 2/1.5 | 1,141 (+2%) | 1mo | $129,900 | $114 | 63 |
| 2014 Buckeye St | 0.63mi | 2/2.0 | 1,106 (-1%) | 2mo | $124,500 | $113 | 63 |
| 2138 N 22nd St | 0.54mi | 2/1.0 | 1,197 (+7%) | 4mo | $75,000 | $63 | 60 |
| 1818 Garfield Ave | 0.67mi | 3/1.0 (+1) | 1,148 (+2%) | 1mo | $97,500 | $85 | 59 |
| 2435 N 14 St | 0.13mi | 3/2.0 (+1) | 960 (-14%) | 3mo | $114,500 | $119 | 59 |
| 2033 N 20th St | 0.57mi | 3/2.0 (+1) | 1,152 (+3%) | 2mo | $149,900 | $130 | 58 |
| 3099 N 15th St | 0.51mi | 3/1.0 (+1) | 1,025 (-9%) | 5mo | $130,000 | $127 | 53 |
| 2127 N 24th St | 0.73mi | 3/2.0 (+1) | 1,224 (+9%) | 3mo | $159,000 | $130 | 39 |
Match score weights: distance 35% · size 25% · config 20% · recency 20%. Top-matched comps best support the ARV.
Projected returns pro-forma
-3.0% appreciation · 3.0% rent growth · sell at horizon
- IRR
- -11.7%
- Equity multiple
- 0.58×
- Total profit
- $-13,041
- Equity at exit
- $16,386
- IRR
- -2.5%
- Equity multiple
- 0.83×
- Total profit
- $-5,172
- Equity at exit
- $9,502
Cash invested: $30,772 (down + closing). Projections, not guarantees.
Landlord ↔ Tenant lean methodology
- Overall (STATE)
- 90 Strongly Landlord-Friendly
- State Indiana
- 90 Strongly Landlord-Friendly · R+11
- County
- — inherits STATE
- City
- — inherits STATE
ZIP-level market 47804
- Home prices YoY
- -24.2%
- Active inventory
- 66
- Price-to-rent
- 8.7×
Monthly cashflow live
- Estimated rent
- $1,056 high interval (Pro) →
- Mortgage (P&I)
- −$576
- Tax est. 1.5%
- −$137 /mo · $1,648/yr
- Insurance
- −$46
- HOA
- −$0
- Vacancy / Maint / Mgmt
- −$222
- Net cashflow
- $75
Break-even live
Sensitivity live
| Price | -10% $151 | -5% $113 | +0% $75 | +5% $37 | +10% $-1 |
|---|---|---|---|---|---|
| Rent | -10% $-9 | -5% $33 | +0% $75 | +5% $116 | +10% $158 |
| Rate | -1.0pp $130 | -0.5pp $103 | base $75 | +0.5pp $46 | +1.0pp $17 |
UW: 25.0% down · 7.5% · 30yr · 1.5% tax · 5.0% vac · 8.0% maint · 8.0% mgmt
Financing live
Cash to close
- Down payment
- $27,475
- Closing costs
- $3,297
- Reserves months
- —
- Total cash needed
- —
Loan-product check · same deal, 3 products live
Conventional
25% down · 7.5% · 30yr
- Down + closing
- —
- Monthly P&I
- —
- Monthly cashflow
- —
- DSCR
- —
- Eligible?
- —
Personal DTI + credit; lowest rate.
DSCR
20% down · 8.5% · 30yr
- Down + closing
- —
- Monthly P&I
- —
- Monthly cashflow
- —
- DSCR
- —
- Eligible?
- —
No personal income docs; deal must DSCR.
Hard money
10% down · 12.0% · 12mo
- Down + closing
- —
- Monthly P&I
- —
- Monthly cashflow
- —
- DSCR
- —
- Eligible?
- —
Short-term bridge; refi at stabilization.
Rent comps 10 comps
| Address | Beds | Baths | Sqft | Rent | $/sqft | DOM | Units | Dist |
|---|---|---|---|---|---|---|---|---|
| 2250 Garfield Ave Terre Haute, IN | 3.0 | 1.0 | 1500 | $1,375 | $0.92 | 45d | 1 | 0.39mi |
| 3100 N 14th St Terre Haute, IN | 3.0 | 1.5 | 990 | $1,450 | $1.46 | 45d | 1 | 0.53mi |
| 2003 N 22nd St Terre Haute, IN | 1.0 | 1.0 | 846 | $650 | $0.77 | 45d | 1 | 0.70mi |
| 1723 N 11th St Unit 3 Terre Haute, IN | 2.0 | 1.0 | 800 | $800 | $1.00 | 45d | 1 | 0.82mi |
| 1723 N 11th St Unit 2 Terre Haute, IN | 1.0 | 1.0 | 700 | $800 | $1.14 | 45d | 1 | 0.82mi |
| 2702 N 6 1/2 St Terre Haute, IN | 2.0 | 1.0 | 775 | $1,500 | $1.94 | 45d | 1 | 1.06mi |
| 1432 4th Ave Terre Haute, IN | 3.0 | 1.0 | 1144 | $1,000 | $0.87 | 45d | 1 | 1.08mi |
| 3850 N 25th St Terre Haute, IN | 2.0 | 1.0 | 900 | $1,000 | $1.11 | 45d | 1 | 1.31mi |
| 2124 1st Ave Terre Haute, IN | 2.0 | 1.0 | 1208 | $899 | $0.74 | 45d | 1 | 1.32mi |
| 1028 N 9th St Terre Haute, IN | 2.0 | 1.0 | 960 | $1,200 | $1.25 | 45d | 1 | 1.34mi |
Listing history 8 events
-
2026-06-21days on market $109,900 Active 9 DOM
-
2026-06-19days on market $109,900 Active 7 DOM
-
2026-06-18days on market $109,900 Active 6 DOM
-
2026-06-17days on market $109,900 Active 5 DOM
-
2026-06-16days on market $109,900 Active 4 DOM
-
2026-06-15days on market $109,900 Active 3 DOM
-
2026-06-13remarks 509-char remark
-
2026-06-13$109,900 Active 1 DOM
ⓘ Source: listings_history table (triggers on properties + properties_extension) + one-shot
backfill from property_details.listing_events for pre-trigger history.
Climate risk First Street
- Flood 1/10 Low FEMA zone X (unshaded) · 0% chance over 30 yrs
- Wildfire 1/10 Low
- Heat 4/10 Moderate 7 d/yr ≥105°F today · 19 d/yr by 30 yrs out
- Wind 2/10 Low 100% chance of damaging wind over 30 yrs
- Air quality 3/10 Moderate 3 unhealthy d/yr today · 4 by 30 yrs out
Nearby sold comps map
Loading sold comps map…
Walkable amenities ~0.75 mi
Loading nearby amenities…
Taxation est. · year 1
- Rental income
- $12,670
- − Mortgage interest
- −$6,156
- − Property taxes
- −$1,648
- − Insurance
- −$550
- − Repairs & maintenance
- −$1,014
- − Management
- −$1,014
- − Depreciation
- −$3,197
- Taxable loss
- −$908
- Est. tax savings @ 24.0%
- +$218
- After-tax cash flow
- $1,113/yr
For passive investors: Depreciation is non-cash, so a rental often shows a tax loss while cash-flowing — sheltering income. Rental losses are passive: they offset passive income freely, and up to $25,000/yr can offset ordinary (W-2) income if you actively participate and your MAGI is under $100k (phasing out to $0 by $150k); unused losses carry forward. On sale, claimed depreciation is recaptured at up to 25%, and gains may owe capital-gains tax (a 1031 exchange can defer both). Figures are a year-1 estimate at your 24.0% rate — not tax advice; consult a CPA.
Schools (NCES district)
- District
- Vigo County School Corporation
- NCES district ID
- 1812090
- Math proficiency
- 32% ▼ -10.00%
- Reading proficiency
- 37% ▼ -8.00%
- Median HH income
- $40,100
- Composite
- 28.97/100
- National rank
- #6625
- State rank
- #202 of 301 in IN
Livability — Terre Haute
- Score
- 75/100
- State rank
- #63
- US rank
- #4186
Category grades
Schools grade is shown separately in the Schools card above.
Census & demographics
- Census place
- Terre Haute, IN
- County
- Vigo County · 91,193 people
- City population
- 91,193
- Metro
- Terre Haute, IN
- Population (ZIP)
- 10,553
- Household income
- $40,674
- Rent vs Own
- Severe rent burden
- 414.0
Population outlook (Vigo County) Hauer SSP2
- Today (2025)
- 106,366 people
- By 2030
- 105,674 · -0.7%
- By 2040
- 103,731 · -2.5%
- By 2050
- 101,200 · -4.9%
- By 2075
- 95,674 · -10.1%
- By 2100
- 85,910 · -19.2%
Race, ethnicity, and origin ACS 2023
- Neighborhood character
- Predominantly White (81%)
- Race & ethnicity
- White 81% Hispanic / Latino 7% Black 6% Two or more races 5%
- Hispanic origin (detail)
- Mexican 5% Puerto Rican 1%
- Common ancestry
- Slovak 4% Lithuanian 3% Romanian 2%
- Foreign-born
- 4% · Canada, China
- Languages at home
- 92% English-only · Spanish 7% Chinese 1%
Political lean MEDSL · Vigo
- 2024 margin
- R (+18.1) · D 40.0% · R 58.1% · Other 2.0%
- 2008→2024 swing
- -33.9pp toward R · 2008: 15.8pp · 2024: -18.1pp
- All cycles
- 2024: R+18.1 2020: R+14.7 2016: R+15.2 2012: D+0.8 2008: D+15.8
Not yet ingested
- Civics
- —
Market trends
- HPI YoY
- ▼ -52.33%
- Current HPI
- 164.2961
- Rent YoY
- —
- Metro
- Terre Haute, IN
- State GDP YoY
- ▲ 2.90%
- F500 in state
- 18
Industry mix (Fortune 500 HQ in IN)
| Industry | F500 HQs | Revenue |
|---|---|---|
| Industrial Machinery | 2 | $37B |
|
||
| Healthcare | 1 | $177B |
|
||
| Pharmaceuticals | 1 | $45B |
|
||
| Metals / Steel | 1 | $18B |
|
||
| Agriculture | 1 | $17B |
|
||
| Packaging | 1 | $12B |
|
||
Price history
1 event — show timeline
- 2026-06-12 Listed $109,900 THAAR
Property tax history
-23.9%/yrLatest (2024): $84 · +2.0% YoY. Source: county tax records.
Cash-flow waterfall
monthlySold comps — $/sqft
last 12 mo · ≤1 miLoading sold comps…