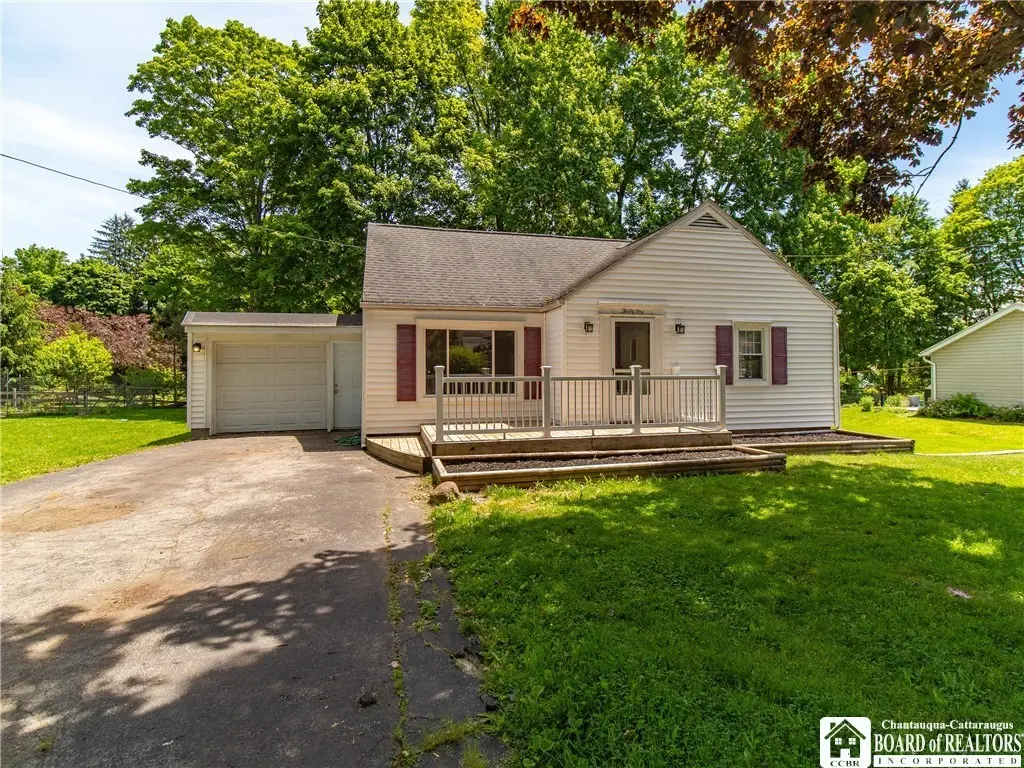
31 Marvin Ave · Lakewood, NY
Flood risk 1/10 · Minimal
- FEMA flood zone
- X
- Chance of flooding over 30 yrs
- 0.0%
- Est. flood insurance / yr
- $473 – $860
Fire risk 1/10 · Minimal
- Est. fire insurance / yr
- $691 – $1,283
Heat risk 2/10 · Minimal
- Hot days now (above 90°F)
- 7 days/yr
- Hot days in 30 yrs
- 17 days/yr
Wind risk 1/10 · Minimal
- Chance of severe wind over 30 yrs
- —
Air-quality risk 2/10 · Minimal
- Unhealthy air days now
- 0 days/yr
- Unhealthy air days in 30 yrs
- 1 days/yr
Risk factors via First Street. Map © Google.
Why this score? — see what drove the B- grade
The composite is a weighted blend of 9 inputs, each scored 0–100. Each bar is that input's sub-score; the figure is the points it added to the 100-point composite (weight × sub-score).
- Cash flow +26.0/30.0
- ARV discount +10.7/15.0
- DSCR +8.7/10.0
- 1% rule +7.2/10.0
- Schools +4.3/10.0
- Livability +3.6/5.0
- Rent growth +2.5/5.0
- Condition / age +2.5/5.0
- Appreciation +0.0/10.0
$180,000
🖨 Deal sheet (PDF) 📄 Offer letter ✓ Due diligence
Listing remarks MLS
Neat Village of Lakewood Cape that is perfect for the first time home buyer or someone looking to downsize. Lake access from the end of Pine St. makes this home affordable to someone from out of town who is looking for a weekend retreat. This home has many vinyl replacement windows, vinyl siding, roof replaced in 1994, furnace and hot water tank replaced 3 or 4 years ago
Key facts
- Deeded lake rights
- Private backyard
- Dedicated dog bath
Tags
Property features AI
Exterior
- Parking: Attached garage (1 car)
- Utilities: Electricity connected; Public water connected; Sewer connected
- Home design: Single-story home; Vinyl siding; Entry level: main level; Asphalt roof; Existing construction
- Construction: Block foundation; Built (existing year)
- Exterior features: Blacktop driveway; Deck; Deeded lake access to Chautauqua Lake; Rectangular residential lot; City street frontage
Interior
- Kitchen: Gas oven; Gas range; Dishwasher; Refrigerator
- Bedrooms: Two main-level bedrooms
- Flooring: Hardwood; Varies
- Bathrooms: One full bathroom (main level)
- Heating & cooling: Gas forced-air heating
- Interior features: Entrance foyer; Separate/formal living room; Solid surface counters; Programmable thermostat; Full basement
- Laundry & utility: Laundry in basement; Electric water heater
Neighborhood map
What this means for you Summary
Snapshot
- This is a 3-bed/1.0-bath single-family listed at $180k.
Deal economics
- At list price, monthly cash flow is $445 ($5k/yr) — positive.
- The deal already cash-flows at list — no discount required.
- Meets the 1% rule at list price ($2k rent vs $180k).
- Cap rate 9.3% vs local median 3.0% in Lakewood — top-decile yield for the area; either an underpriced asset or a hidden risk that comps aren't pricing in. Stress-test before assuming the spread holds.
Location & tenants
- Location reads 71/100 on livability (#398 in NY) — a middle-class / working-renter tenant base. Strengths: cost of living A+, housing A+, health & safety A+; Watch: employment D+, amenities F, commute F.
- Southwestern Central School District At Jamestown (town): math 45% / reading 56% proficiency, ranked #373 of 590 in NY (top 63%) — acceptable for families but not a draw, mixed tenant base, ~2y average lease.
- Zoned schools: Southwestern Elementary School (math 46% / reading 53%, grade D, #1,085 of 2,108 statewide, top 56%, 583 students, 36% FRL); Southwestern Middle School (math 26% / reading 55%, grade F, #409 of 729 statewide, top 56%, 307 students, 39% FRL); Southwestern Senior High School (math 98% / reading 95%, grade A+, #59 of 1,100 statewide, top 6%, 429 students, 40% FRL).
- Market conditions: 39 active listings in the ZIP; 1 comparable units currently listed for rent nearby; 127 units permitted in Chautauqua County in 2024 (0 in 5+ unit buildings).
Forward outlook
- Local home prices are declining (-3.0%/yr); year-one equity from $1k of loan paydown is wiped out by about $5k of value loss. Plan a longer hold.
- Chautauqua County population projected at -22% by 2050 — secular population decline; favor cash flow + early exit over multi-decade hold.
Negotiation context
- Only 7 days on market — expect competitive offers; lowballing is unlikely to land.
- 2 sale attempts since 19y ago with the ask held roughly flat each time — persistent listings suggest the price (not the market) is what's stuck; bring a comps-based counter.
- Current owner paid $64k; list at $180k implies a 179% gain — meaningful room to come down on a strong offer.
Risks & watch-outs
- Watch-outs: built in 1949 — expect roof / HVAC / electrical / plumbing capex.
Questions for the listing agent
- Built in 1949 — when were the roof, HVAC, electrical panel, plumbing, and water heater last replaced?
- Is there a deadline driving the sale (1031 exchange, divorce, estate, relocation)? That informs how much negotiation room exists.
- Schools are D-rated, which usually means shorter tenancies and higher turnover. Who's the typical renter profile here, and what's been the actual vacancy rate?
- What's the average days-on-market for RENTAL listings here right now (not sales)? A rising rental-DOM trend means longer vacancies and softer asking-rent achievability than the comps imply.
- What's the recent tenant-quality profile in this submarket — average credit score on applications, eviction rate, late-payment / NSF rate, and stable-employment percentage? A property-management company in the area should have these aggregated.
- How much new for-sale + rental construction is in the pipeline within 1–3 miles? Heavy new supply typically softens prices + rents 12–24 months out; constrained supply supports both.
Investment metrics
- 1% rule
- 1.22% ✓
- Cap rate
- 9.26%
- Cash-on-cash
- 10.60%
- DSCR
- 1.47
- GRM
- 6.8
CMA / ARV
- ARV (on-the-fly)
- $193,648
- Comps found
- 5
Show comp detail 5 sales within ~0.75 mi
| Address | Dist | Beds/Ba | Sqft | Sold | Price | $/sf | Match |
|---|---|---|---|---|---|---|---|
| 8 Case Ave | 0.10mi | 3/1.0 | 1,125 (+6%) | 10mo | $240,000 | $213 | 78 |
| 145 E Terrace Ave | 0.25mi | 2/1.0 (-1) | 1,076 (+1%) | 11mo | $185,000 | $172 | 72 |
| 24 East Second St | 0.26mi | 3/1.0 | 1,163 (+9%) | 19mo | $95,000 | $82 | 56 |
| 19 Southland Ave | 0.20mi | 2/1.0 (-1) | 908 (-15%) | 21mo | $175,000 | $193 | 44 |
| 180 E Terrace Ave | 0.42mi | 2/1.5 (-1) | 1,216 (+14%) | 9mo | $221,000 | $182 | 42 |
Match score weights: distance 35% · size 25% · config 20% · recency 20%. Top-matched comps best support the ARV.
Projected returns pro-forma
-3.0% appreciation · 3.0% rent growth · sell at horizon
- IRR
- -0.4%
- Equity multiple
- 0.99×
- Total profit
- $-737
- Equity at exit
- $26,839
- IRR
- 9.3%
- Equity multiple
- 1.72×
- Total profit
- $36,142
- Equity at exit
- $15,563
Cash invested: $50,400 (down + closing). Projections, not guarantees.
Landlord ↔ Tenant lean methodology
- Overall (STATE)
- 15 Strongly Tenant-Friendly
- State New York
- 15 Strongly Tenant-Friendly · D+10
- County
- — inherits STATE
- City
- — inherits STATE
ZIP-level market 14750
- Home prices YoY
- -7.7%
- Active inventory
- 39
- Price-to-rent
- 6.8×
Monthly cashflow live
- Estimated rent
- $2,200 medium interval (Pro) →
- Mortgage (P&I)
- −$944
- Tax from tax record
- −$274 /mo · $3,284/yr
- Insurance
- −$75
- HOA
- −$0
- Vacancy / Maint / Mgmt
- −$462
- Net cashflow
- $445
Break-even live
Sensitivity live
| Price | -10% $547 | -5% $496 | +0% $445 | +5% $394 | +10% $343 |
|---|---|---|---|---|---|
| Rent | -10% $272 | -5% $358 | +0% $445 | +5% $532 | +10% $619 |
| Rate | -1.0pp $536 | -0.5pp $491 | base $445 | +0.5pp $399 | +1.0pp $351 |
UW: 25.0% down · 7.5% · 30yr · 1.5% tax · 5.0% vac · 8.0% maint · 8.0% mgmt
Financing live
Cash to close
- Down payment
- $45,000
- Closing costs
- $5,400
- Reserves months
- —
- Total cash needed
- —
Loan-product check · same deal, 3 products live
Conventional
25% down · 7.5% · 30yr
- Down + closing
- —
- Monthly P&I
- —
- Monthly cashflow
- —
- DSCR
- —
- Eligible?
- —
Personal DTI + credit; lowest rate.
DSCR
20% down · 8.5% · 30yr
- Down + closing
- —
- Monthly P&I
- —
- Monthly cashflow
- —
- DSCR
- —
- Eligible?
- —
No personal income docs; deal must DSCR.
Hard money
10% down · 12.0% · 12mo
- Down + closing
- —
- Monthly P&I
- —
- Monthly cashflow
- —
- DSCR
- —
- Eligible?
- —
Short-term bridge; refi at stabilization.
Rent comps 1 comps
| Address | Beds | Baths | Sqft | Rent | $/sqft | DOM | Units | Dist |
|---|---|---|---|---|---|---|---|---|
| 3779 Heineman Rd Bemus Point, NY | 2.0 | 2.0 | 1100 | $2,200 | $2.00 | 45d | 1 | 1.16mi |
Listing history 6 events
-
2026-06-16status $180,000 Pending 7 DOM
-
2026-06-15days on market $180,000 Active 7 DOM
-
2026-06-14days on market $180,000 Active 5 DOM
-
2026-06-12days on market $180,000 Active 4 DOM
-
2026-06-09remarks 699-char remark
-
2026-06-09$180,000 Active 1 DOM
ⓘ Source: listings_history table (triggers on properties + properties_extension) + one-shot
backfill from property_details.listing_events for pre-trigger history.
Tax reassessment forecast NY · Partial reset (capped growth)
- Current annual tax
- $3,284 · $274/mo
- Projected year-2 tax
- $3,284 · $274/mo
- Expected delta
- $0/yr ($0/mo · 0.0%)
ⓘ Screening estimate from a state-policy table — verify with the county assessor before closing.
Climate risk First Street
- Flood 1/10 Low FEMA zone X · 0% chance over 30 yrs
- Wildfire 1/10 Low
- Heat 2/10 Low 7 d/yr ≥90°F today · 17 d/yr by 30 yrs out
- Wind 1/10 Low
- Air quality 2/10 Low 0 unhealthy d/yr today · 1 by 30 yrs out
Nearby sold comps map
Loading sold comps map…
Walkable amenities ~0.75 mi
Loading nearby amenities…
Taxation est. · year 1
- Rental income
- $26,400
- − Mortgage interest
- −$10,083
- − Property taxes
- −$3,284
- − Insurance
- −$900
- − Repairs & maintenance
- −$2,112
- − Management
- −$2,112
- − Depreciation
- −$5,236
- Taxable income
- $2,673
- Est. tax owed @ 24.0%
- −$641
- After-tax cash flow
- $4,703/yr
For passive investors: Depreciation is non-cash, so a rental often shows a tax loss while cash-flowing — sheltering income. Rental losses are passive: they offset passive income freely, and up to $25,000/yr can offset ordinary (W-2) income if you actively participate and your MAGI is under $100k (phasing out to $0 by $150k); unused losses carry forward. On sale, claimed depreciation is recaptured at up to 25%, and gains may owe capital-gains tax (a 1031 exchange can defer both). Figures are a year-1 estimate at your 24.0% rate — not tax advice; consult a CPA.
Schools (NCES district)
- District
- Southwestern Central School District At Jamestown
- NCES district ID
- 3627660
- Math proficiency
- 45% ▼ -11.00%
- Reading proficiency
- 56% ▲ 3.00%
- Median HH income
- $50,567
- Composite
- 43.21/100
- National rank
- #3062
- State rank
- #373 of 590 in NY
Livability — Lakewood
- Score
- 71/100
- State rank
- #398
- US rank
- #6904
Category grades
Schools grade is shown separately in the Schools card above.
Census & demographics
- Census place
- Lakewood, NY
- Population (ZIP)
- 4,411
Population outlook (Chautauqua County) Hauer SSP2
- Today (2025)
- 123,454 people
- By 2030
- 118,509 · -4.0%
- By 2040
- 107,311 · -13.1%
- By 2050
- 96,703 · -21.7%
- By 2075
- 76,757 · -37.8%
- By 2100
- 60,984 · -50.6%
Race, ethnicity, and origin ACS 2023
- Neighborhood character
- Predominantly White (89%)
- Race & ethnicity
- White 89% Hispanic / Latino 6% Two or more races 5%
- Hispanic origin (detail)
- Mexican 5%
- Common ancestry
- Romanian 4% Slovak 2% Lithuanian 1%
- Foreign-born
- 2% · Canada
- Languages at home
- 97% English-only · Spanish 1% German/W. Germanic 1%
Political lean MEDSL · Chautauqua
- 2024 margin
- Strong R (+22.0) · D 39.0% · R 61.0%
- 2008→2024 swing
- -22.9pp toward R · 2008: 0.9pp · 2024: -22.0pp
- All cycles
- 2024: R+22.0 2020: R+19.8 2016: R+24.6 2012: R+8.2 2008: D+0.9
Not yet ingested
- Civics
- —
Market trends
- HPI YoY
- ▼ -26.43%
- Current HPI
- 318.8566
- Rent YoY
- —
- Metro
- —
- State GDP YoY
- ▲ 2.60%
- F500 in state
- 92
Industry mix (Fortune 500 HQ in NY)
| Industry | F500 HQs | Revenue |
|---|---|---|
| Financial Services | 10 | $950B |
|
||
| Consumer Goods | 9 | $162B |
|
||
| Insurance | 4 | $225B |
|
||
| Telecommunications | 2 | $144B |
|
||
| Pharmaceuticals | 2 | $112B |
|
||
| Media / Entertainment | 2 | $69B |
|
||
Price history
+157.5% since first listed3 events — show timeline
- 2026-06-08 Listed $180,000 UNYREIS
- 2007-08-02 Sold (MLS) $64,500 UNYREIS
- 2007-05-15 Listed $69,900 UNYREIS
Property tax history
+5.2%/yrLatest (2025): $3,284 · +11.0% YoY. Source: county tax records.
Cash-flow waterfall
monthlySold comps — $/sqft
last 12 mo · ≤1 miLoading sold comps…