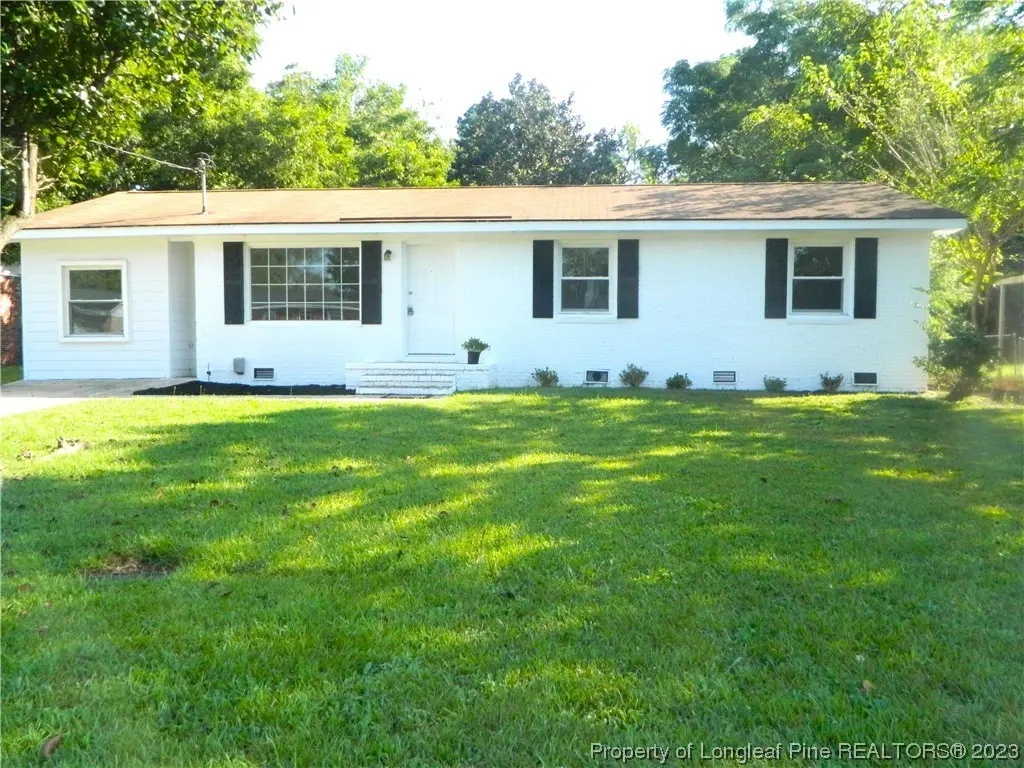
413 Atwell Dr · Fayetteville, NC
Flood risk 1/10 · Minimal
- FEMA flood zone
- X (unshaded)
- Chance of flooding over 30 yrs
- 0.0%
- Est. flood insurance / yr
- $507 – $1,088
Fire risk 2/10 · Minimal
- Est. fire insurance / yr
- $906 – $1,684
Heat risk 7/10 · Major
- Hot days now (above 106°F)
- 7 days/yr
- Hot days in 30 yrs
- 16 days/yr
Wind risk 7/10 · Major
- Chance of severe wind over 30 yrs
- 78.0%
Air-quality risk 2/10 · Minimal
- Unhealthy air days now
- 0 days/yr
- Unhealthy air days in 30 yrs
- 1 days/yr
Risk factors via First Street. Map © Google.
Why this score? — see what drove the D- grade
The composite is a weighted blend of 9 inputs, each scored 0–100. Each bar is that input's sub-score; the figure is the points it added to the 100-point composite (weight × sub-score).
- Cash flow +9.9/30.0
- ARV discount +8.3/15.0
- Livability +3.8/5.0
- Rent growth +3.3/5.0
- Schools +3.1/10.0
- DSCR +2.8/10.0
- 1% rule +2.7/10.0
- Condition / age +2.5/5.0
- Appreciation +0.0/10.0
$184,900
🖨 Deal sheet (PDF) 📄 Offer letter ✓ Due diligence
Listing remarks MLS
-3 Bedroom, 1 Bath Ranch Style home. PRICED MORE THAN $61,400 BELOW TAX VALUE!!! Due to the condition, the property may have health/safety risk(s). Prior to entry / access all parties must sign a Hold Harmless Agreement and the property may only be shown by appointment. Property was built prior to 1978 and lead based paint potentially exists.
Key facts
- 0.25 acre lot
- Built 1972
- Listed 16 days
Neighborhood map
What this means for you Summary
Snapshot
- This is a 3-bed/2.0-bath single-family listed at $185k.
Deal economics
- At list price, monthly cash flow is $-116 ($-1k/yr) — negative.
- To cash-flow at today's rent, offer at most $164k (11.0% below list).
- To meet the 1% rule (rent ≥ 1% of price), the offer needs to be $142k (23.1% below list).
- Recommended offer: $142k (23.1% below list) — sets the bar for 1% rule.
Location & tenants
- Location reads 75/100 on livability (#45 in NC, #4,031 nationally) — a middle-class / working-renter tenant base. Strengths: commute A+, cost of living A+, housing A+; Watch: crime F, employment D-.
- Cumberland County Schools (urban): math 32% / reading 41% proficiency, ranked #126 of 178 in NC (top 71%) — families likely to look elsewhere, expect single-tenant / working-renter base with shorter leases.
- Zoned schools: Cliffdale Elementary (math 19% / reading 27%, grade F, #1,168 of 1,410 statewide, top 83%, 658 students, 100% FRL); Westover Middle (math 20% / reading 30%, grade F, #396 of 475 statewide, top 84%, 784 students, 100% FRL); Westover High (math 42% / reading 39%, grade F, #387 of 535 statewide, top 73%, 1,202 students, 100% FRL) — zoned schools average 100% FRL vs 55% district-wide (45 pts higher); higher-poverty schools than district average — tighter screening recommended.
- Market conditions: Rents rising (+3.1%/yr); 435 active listings in the ZIP; 40 comparable units currently listed for rent nearby; rentals at typical pace (median 25d on market — plan ~3-4 weeks tenant-placement turnaround); 1,125 units permitted in Cumberland County in 2024 (104 in 5+ unit buildings).
Forward outlook
- Local home prices are declining (-3.0%/yr); year-one equity from $1k of loan paydown is wiped out by about $6k of value loss. Plan a longer hold.
Negotiation context
- It's been on market 16 days — a 2% lower offer ($182k) is reasonable based on typical stale-listing flexibility.
- 2 sale attempts since 8y ago with the ask held roughly flat each time — persistent listings suggest the price (not the market) is what's stuck; bring a comps-based counter.
Risks & watch-outs
- Climate carrying-cost: major wind risk, 78% chance of damaging wind over 30y; extreme-heat days projected 7→16/yr by 2055 (HVAC capex compounding) — expect insurance premiums to compound above CPI over the hold.
Questions for the listing agent
- What do current leases actually rent for vs. the listed asking? Can we see a recent rent roll and the last 12 months of T-12 income?
- Built in 1972 — when were the roof, HVAC, electrical panel, plumbing, and water heater last replaced?
- Is there a deadline driving the sale (1031 exchange, divorce, estate, relocation)? That informs how much negotiation room exists.
- Crime grade is F in this area — have there been break-ins, vandalism, or insurance claims at this property in the last 3 years? What carrier currently insures it and at what premium?
- The area grade is low — what's the realistic commute time and amenity access for the typical tenant pool here? Any planned neighborhood developments (good or bad) we should know about?
- What's the average days-on-market for RENTAL listings here right now (not sales)? A rising rental-DOM trend means longer vacancies and softer asking-rent achievability than the comps imply.
- What's the recent tenant-quality profile in this submarket — average credit score on applications, eviction rate, late-payment / NSF rate, and stable-employment percentage? A property-management company in the area should have these aggregated.
- How much new for-sale + rental construction is in the pipeline within 1–3 miles? Heavy new supply typically softens prices + rents 12–24 months out; constrained supply supports both.
Investment metrics
- 1% rule
- 0.77% ✗
- Cap rate
- 5.54%
- Cash-on-cash
- -2.68%
- DSCR
- 0.88
- GRM
- 10.8
CMA / ARV
- ARV (on-the-fly)
- $188,125
- Comps found
- 12
Show comp detail 12 sales within ~0.75 mi
| Address | Dist | Beds/Ba | Sqft | Sold | Price | $/sf | Match |
|---|---|---|---|---|---|---|---|
| 921 Glen Reilly Dr | 0.44mi | 3/2.0 | 1,095 (+2%) | 2mo | $115,000 | $105 | 75 |
| 6785 Winchester St | 0.46mi | 3/2.0 | 1,087 (+1%) | 3mo | $182,000 | $167 | 74 |
| 937 Glen Reilly Dr | 0.41mi | 3/2.0 | 1,100 (+2%) | 4mo | $210,000 | $191 | 74 |
| 7264 Ainsley St | 0.38mi | 3/2.0 | 1,056 (-2%) | 8mo | $168,000 | $159 | 73 |
| 306 Desmond Dr | 0.18mi | 3/1.0 | 1,008 (-6%) | 5mo | $136,000 | $135 | 73 |
| 7425 Ryan St | 0.17mi | 3/2.0 | 943 (-12%) | 1mo | $170,000 | $180 | 71 |
| 7206 Shelby Cir | 0.30mi | 3/2.0 | 980 (-9%) | 5mo | $190,000 | $194 | 67 |
| 6766 Winchester St | 0.46mi | 3/2.0 | 1,135 (+6%) | 4mo | $199,999 | $176 | 66 |
| 6710 Winchester St | 0.60mi | 3/2.0 | 1,078 (+0%) | 8mo | $170,000 | $158 | 64 |
| 1001 Glen Reilly Dr | 0.40mi | 3/2.0 | 1,173 (+9%) | 8mo | $145,000 | $124 | 60 |
| 6859 Winchester St | 0.56mi | 3/2.0 | 1,130 (+5%) | 8mo | $198,000 | $175 | 59 |
| 6502 Somerset Ct | 0.64mi | 3/2.0 | 1,148 (+7%) | 8mo | $205,000 | $179 | 52 |
Match score weights: distance 35% · size 25% · config 20% · recency 20%. Top-matched comps best support the ARV.
Projected returns pro-forma
-3.0% appreciation · 3.11% rent growth · sell at horizon
- IRR
- -20.6%
- Equity multiple
- 0.28×
- Total profit
- $-37,169
- Equity at exit
- $27,569
- IRR
- -13.7%
- Equity multiple
- 0.20×
- Total profit
- $-41,210
- Equity at exit
- $15,987
Cash invested: $51,772 (down + closing). Projections, not guarantees.
Landlord ↔ Tenant lean methodology
- Overall (STATE)
- 85 Strongly Landlord-Friendly
- State North Carolina
- 85 Strongly Landlord-Friendly · R+3
- County
- — inherits STATE
- City
- — inherits STATE
ZIP-level market 28314
- Home prices YoY
- -15.7%
- Rents YoY
- 3.1%
- Active inventory
- 435
- Price-to-rent
- 10.8×
Monthly cashflow live
- Estimated rent
- $1,421 high interval (Pro) →
- Mortgage (P&I)
- −$970
- Tax from tax record
- −$192 /mo · $2,300/yr
- Insurance
- −$77
- HOA
- −$0
- Vacancy / Maint / Mgmt
- −$298
- Net cashflow
- $-116
Break-even live
Sensitivity live
| Price | -10% $-11 | -5% $-63 | +0% $-116 | +5% $-168 | +10% $-220 |
|---|---|---|---|---|---|
| Rent | -10% $-228 | -5% $-172 | +0% $-116 | +5% $-59 | +10% $-3 |
| Rate | -1.0pp $-22 | -0.5pp $-69 | base $-116 | +0.5pp $-164 | +1.0pp $-212 |
UW: 25.0% down · 7.5% · 30yr · 1.5% tax · 5.0% vac · 8.0% maint · 8.0% mgmt
Financing live
Cash to close
- Down payment
- $46,225
- Closing costs
- $5,547
- Reserves months
- —
- Total cash needed
- —
Loan-product check · same deal, 3 products live
Conventional
25% down · 7.5% · 30yr
- Down + closing
- —
- Monthly P&I
- —
- Monthly cashflow
- —
- DSCR
- —
- Eligible?
- —
Personal DTI + credit; lowest rate.
DSCR
20% down · 8.5% · 30yr
- Down + closing
- —
- Monthly P&I
- —
- Monthly cashflow
- —
- DSCR
- —
- Eligible?
- —
No personal income docs; deal must DSCR.
Hard money
10% down · 12.0% · 12mo
- Down + closing
- —
- Monthly P&I
- —
- Monthly cashflow
- —
- DSCR
- —
- Eligible?
- —
Short-term bridge; refi at stabilization.
Rent comps 40 comps
| Address | Beds | Baths | Sqft | Rent | $/sqft | DOM | Units | Dist |
|---|---|---|---|---|---|---|---|---|
| 6407 Wallaby Ct Fayetteville, NC | 2.0 | 1.5 | 1100 | $1,200 | $1.09 | 15d | 1 | 0.19mi |
| 338 Milburn Dr Fayetteville, NC | 3.0 | 1.5 | 1128 | $1,550 | $1.37 | 25d | 1 | 0.19mi |
| 6793 Candlewood Dr Fayetteville, NC | 3.0 | 2.0 | 1240 | $1,475 | $1.19 | 15d | 1 | 0.25mi |
| 540 Auburndale Ln Fayetteville, NC | 3.0 | 2.0 | 1100 | $1,600 | $1.45 | 15d | 1 | 0.27mi |
| 605 S Reilly Rd Fayetteville, NC | 1.0–3.0 | 1.0–2.0 | 992 | $1,349 | $1.36 | 15d | 1 | 0.28mi |
| 916 Glen Reilly Dr Fayetteville, NC | 3.0 | 2.0 | 1071 | $1,400 | $1.31 | 25d | 1 | 0.43mi |
| 567 Cutchen Ln Fayetteville, NC | 1.0–3.0 | 1.0–2.0 | 975 | $1,425 | $1.46 | 15d | 61 | 0.44mi |
| 7252 Ainsley St Fayetteville, NC | 3.0 | 1.0 | 1265 | $1,299 | $1.03 | 25d | 1 | 0.44mi |
| 7298 Ryan St Fayetteville, NC | 4.0 | 1.5 | 1315 | $1,400 | $1.06 | 25d | 1 | 0.46mi |
| 202 Bertram Pl Fayetteville, NC | 3.0 | 2.0 | 1175 | $1,300 | $1.11 | 15d | 1 | 0.49mi |
| 495 Stiles Pl Fayetteville, NC | 3.0 | 2.0 | 1300 | $1,250 | $0.96 | 15d | 1 | 0.49mi |
| 244 Wickford Ct Unit 6 Fayetteville, NC | 2.0 | 1.5 | 1141 | $995 | $0.87 | 25d | 1 | 0.51mi |
| 1001 Brookhollow Dr #4 Fayetteville, NC | 3.0 | 2.0 | 1311 | $1,550 | $1.18 | 25d | 1 | 0.52mi |
| 6734 Winchester St Fayetteville, NC | 3.0 | 2.0 | 1068 | $3,195 | $2.99 | 15d | 1 | 0.53mi |
| 621 Marshtree Ln #305 Fayetteville, NC | 2.0 | 2.0 | 1140 | $1,500 | $1.32 | 25d | 1 | 0.55mi |
| 1002 Brookhollow Dr #5 Fayetteville, NC | 3.0 | 2.0 | 1311 | $1,290 | $0.98 | 23d | 1 | 0.55mi |
| 679 Bartons Landing Pl Fayetteville, NC | 2.0 | 2.0 | 1145 | $1,150 | $1.00 | 25d | 1 | 0.56mi |
| 679 Bartons Landing Pl Unit 6 Fayetteville, NC | 2.0 | 2.0 | 1145 | $1,200 | $1.05 | 25d | 1 | 0.56mi |
| 672 Bartons Landing Pl Fayetteville, NC | 2.0 | 2.0 | 1145 | $1,100 | $0.96 | 15d | 1 | 0.57mi |
| 6720 Willowbrook Dr #5 Fayetteville, NC | 2.0 | 2.0 | 1200 | $1,150 | $0.96 | 15d | 1 | 0.57mi |
| 625 Marshtree Ln Fayetteville, NC | 2.0–3.0 | 2.0 | 1170 | $1,275 | $1.09 | 15d | 2 | 0.57mi |
| 6848 Torrance Ln Fayetteville, NC | 3.0 | 2.5 | 1290 | $3,295 | $2.55 | 15d | 1 | 0.57mi |
| 6855 Shawcross Ln Fayetteville, NC | 3.0 | 2.0 | 1100 | $1,495 | $1.36 | 25d | 1 | 0.58mi |
| 1014 Brookhollow Dr Fayetteville, NC | 2.0 | 2.0 | 1050 | $1,000 | $0.95 | 15d | 1 | 0.63mi |
| 663 Bartons Landing Pl Unit 2 Fayetteville, NC | 2.0 | 2.0 | 1150 | $1,200 | $1.04 | 15d | 1 | 0.66mi |
| 6748 Willowbrook Dr #9 Fayetteville, NC | 2.0 | 2.0 | 1157 | $1,100 | $0.95 | 25d | 1 | 0.67mi |
| 1022 Brookhollow Dr #5 Fayetteville, NC | 2.0 | 2.0 | 1086 | $1,050 | $0.97 | 25d | 1 | 0.68mi |
| 698 Bartons Landing Pl #5 Fayetteville, NC | 2.0 | 2.0 | 1136 | $1,100 | $0.97 | 25d | 1 | 0.71mi |
| 1000 Wood Creek Dr #9 Fayetteville, NC | 2.0 | 2.0 | 1100 | $1,175 | $1.07 | 25d | 1 | 0.72mi |
| 1018 Wood Creek Dr #9 Fayetteville, NC | 3.0 | 2.0 | 1101 | $1,195 | $1.09 | 25d | 1 | 0.75mi |
| 205 Brookford Ct Fayetteville, NC | 3.0 | 2.0 | 1196 | $1,640 | $1.37 | 25d | 1 | 0.76mi |
| 6809 Willowbrook Dr Fayetteville, NC | 2.0 | 2.0 | 1050 | $990 | $0.94 | 25d | 1 | 0.83mi |
| 942 Stewarts Creek Dr #8 Fayetteville, NC | 2.0 | 2.0 | 1020 | $1,055 | $1.03 | 25d | 1 | 0.89mi |
| 942 Stewarts Creek Dr #9 Fayetteville, NC | 3.0 | 2.0 | 1250 | $1,250 | $1.00 | 25d | 1 | 0.89mi |
| 3500 Carlson Bay Ct Fayetteville, NC | 1.0–3.0 | 1.0–2.0 | 850 | $1,350 | $1.59 | 15d | 4 | 0.95mi |
| 5831 Waters Edge Dr Fayetteville, NC | 3.0 | 2.0 | 1344 | $1,545 | $1.15 | 25d | 1 | 0.98mi |
| 111 Grande Oaks Dr Fayetteville, NC | 1.0–3.0 | 1.0–2.0 | 1205 | $1,645 | $1.37 | 15d | 46 | 1.01mi |
| 420 Mangum Ct Fayetteville, NC | 3.0 | 2.0 | 1127 | $1,550 | $1.38 | 25d | 1 | 1.05mi |
| 1131 Capeharbor Ct Fayetteville, NC | 2.0 | 2.0 | 1100 | $1,345 | $1.22 | 15d | 14 | 1.07mi |
| 3374 Starboard Way Fayetteville, NC | 3.0 | 2.5 | 1481 | $2,150 | $1.45 | 15d | 1 | 1.17mi |
Listing history 8 events
-
2023-10-20soldstatus $180,000
-
2023-09-28status Pending
-
2023-09-20price $184,900
-
2023-09-12$189,900 Active
-
2018-08-27soldstatus $22,000 344-char remark
Show marketing remark (344 chars)
-3 Bedroom, 1 Bath Ranch Style home. PRICED MORE THAN $61,400 BELOW TAX VALUE!!! Due to the condition, the property may have health/safety risk(s). Prior to entry / access all parties must sign a Hold Harmless Agreement and the property may only be shown by appointment. Property was built prior to 1978 and lead based paint potentially exists.
-
2018-07-14$17,500 344-char remark
Show marketing remark (344 chars)
-3 Bedroom, 1 Bath Ranch Style home. PRICED MORE THAN $61,400 BELOW TAX VALUE!!! Due to the condition, the property may have health/safety risk(s). Prior to entry / access all parties must sign a Hold Harmless Agreement and the property may only be shown by appointment. Property was built prior to 1978 and lead based paint potentially exists.
-
1992-11-30soldstatus $52,500
-
1991-10-03soldstatus $52,000
ⓘ Source: listings_history table (triggers on properties + properties_extension) + one-shot
backfill from property_details.listing_events for pre-trigger history.
Tax reassessment forecast NC · Resets to sale price
- Current annual tax
- $2,300 · $192/mo
- Projected year-2 tax
- $2,300 · $192/mo
- Expected delta
- $0/yr ($0/mo · 0.0%)
ⓘ Screening estimate from a state-policy table — verify with the county assessor before closing.
Climate risk First Street
- Flood 1/10 Low FEMA zone X (unshaded) · 0% chance over 30 yrs
- Wildfire 2/10 Low
- Heat 7/10 Severe 7 d/yr ≥106°F today · 16 d/yr by 30 yrs out
- Wind 7/10 Severe 78% chance of damaging wind over 30 yrs
- Air quality 2/10 Low 0 unhealthy d/yr today · 1 by 30 yrs out
Nearby sold comps map
Loading sold comps map…
Walkable amenities ~0.75 mi
Loading nearby amenities…
Taxation est. · year 1
- Rental income
- $17,054
- − Mortgage interest
- −$10,357
- − Property taxes
- −$2,300
- − Insurance
- −$924
- − Repairs & maintenance
- −$1,364
- − Management
- −$1,364
- − Depreciation
- −$5,379
- Taxable loss
- −$4,635
- Est. tax savings @ 24.0%
- +$1,112
- After-tax cash flow
- $-275/yr
For passive investors: Depreciation is non-cash, so a rental often shows a tax loss while cash-flowing — sheltering income. Rental losses are passive: they offset passive income freely, and up to $25,000/yr can offset ordinary (W-2) income if you actively participate and your MAGI is under $100k (phasing out to $0 by $150k); unused losses carry forward. On sale, claimed depreciation is recaptured at up to 25%, and gains may owe capital-gains tax (a 1031 exchange can defer both). Figures are a year-1 estimate at your 24.0% rate — not tax advice; consult a CPA.
Schools (NCES district)
- District
- Cumberland County Schools
- NCES district ID
- 3700011
- Math proficiency
- 32% ▼ -2.00%
- Reading proficiency
- 41% ▼ -1.00%
- Median HH income
- $44,168
- Composite
- 31.0/100
- National rank
- #6096
- State rank
- #126 of 178 in NC
Livability — Fayetteville
- Score
- 75/100
- State rank
- #45
- US rank
- #4031
Category grades
Schools grade is shown separately in the Schools card above.
Census & demographics
- Census place
- Fayetteville, NC
- County
- Cumberland County · 265,314 people
- City population
- 226,118
- Metro
- Fayetteville, NC
- Population (ZIP)
- 55,834
- Household income
- $62,249
- Rent vs Own
- Severe rent burden
- 2511.0
Population outlook (Cumberland County) Hauer SSP2
- Today (2025)
- 330,855 people
- By 2030
- 333,523 · +0.8%
- By 2040
- 335,583 · +1.4%
- By 2050
- 335,325 · +1.4%
- By 2075
- 342,853 · +3.6%
- By 2100
- 340,698 · +3.0%
Race, ethnicity, and origin ACS 2023
- Neighborhood character
- Diverse neighborhood (Simpson 0.67)
- Race & ethnicity
- Black 49% White 25% Hispanic / Latino 16% Two or more races 11% Asian 3%
- Hispanic origin (detail)
- Mexican 5% Puerto Rican 6% Dominican 1%
- Common ancestry
- Slovak 1% Romanian 1% Lithuanian 1%
- Foreign-born
- 9% · Canada, South Korea
- Languages at home
- 84% English-only · Spanish 10% Korean 1% Other Asian/Pacific 1%
Political lean MEDSL · Cumberland
- 2024 margin
- D (+13.4) · D 56.1% · R 42.7% · Other 1.2%
- 2008→2024 swing
- -4.3pp toward R · 2008: 17.7pp · 2024: 13.4pp
- All cycles
- 2024: D+13.4 2020: D+16.6 2016: D+16.0 2012: D+19.7 2008: D+17.7
Not yet ingested
- Civics
- —
Market trends
- HPI YoY
- ▼ -43.20%
- Current HPI
- 231.873
- Rent YoY
- ▲ 3.11%
- Metro
- Fayetteville, NC
- State GDP YoY
- ▲ 3.28%
- F500 in state
- 26
Industry mix (Fortune 500 HQ in NC)
| Industry | F500 HQs | Revenue |
|---|---|---|
| Financial Services | 2 | $213B |
|
||
| Retail | 2 | $95B |
|
||
| Industrial Conglomerate | 1 | $38B |
|
||
| Metals / Steel | 1 | $35B |
|
||
| Utilities | 1 | $30B |
|
||
| Industrial Machinery | 1 | $19B |
|
||
Price history
+246.2% since first listed8 events — show timeline
- 2023-10-20 Sold (Public Records) $180,000 Public Records
- 2023-09-28 Pending — LPRMLS
- 2023-09-20 Price Changed $184,900 LPRMLS
- 2023-09-12 Listed $189,900 LPRMLS
- 2018-08-27 Sold (MLS) $22,000 LPRMLS
- 2018-07-14 Listed $17,500 LPRMLS
- 1992-11-30 Sold (Public Records) $52,500 Public Records
- 1991-10-03 Sold (Public Records) $52,000 Public Records
Property tax history
+6.5%/yrLatest (2025): $2,300 · +34.5% YoY. Source: county tax records.
Cash-flow waterfall
monthlySold comps — $/sqft
last 12 mo · ≤1 miLoading sold comps…