5909 Annex Ct · Normandy, MO
Flood risk 1/10 · Minimal
- FEMA flood zone
- X (unshaded)
- Chance of flooding over 30 yrs
- 0.0%
- Est. flood insurance / yr
- $473 – $860
Fire risk 1/10 · Minimal
- Est. fire insurance / yr
- $1,054 – $1,958
Heat risk 4/10 · Minor
- Hot days now (above 107°F)
- 7 days/yr
- Hot days in 30 yrs
- 19 days/yr
Wind risk 2/10 · Minimal
- Chance of severe wind over 30 yrs
- 1.0%
Air-quality risk 4/10 · Minor
- Unhealthy air days now
- 4 days/yr
- Unhealthy air days in 30 yrs
- 5 days/yr
Risk factors via First Street. Map © Google.
Why this score? — see what drove the D grade
The composite is a weighted blend of 9 inputs, each scored 0–100. Each bar is that input's sub-score; the figure is the points it added to the 100-point composite (weight × sub-score).
- Cash flow +18.7/30.0
- DSCR +5.9/10.0
- Rent growth +4.8/5.0
- 1% rule +4.4/10.0
- Livability +3.2/5.0
- Condition / age +2.5/5.0
- Schools +1.2/10.0
- ARV discount +0.0/15.0
- Appreciation +0.0/10.0
$169,900
🖨 Deal sheet 📄 Offer letter ✓ Due diligence
Listing remarks MLS
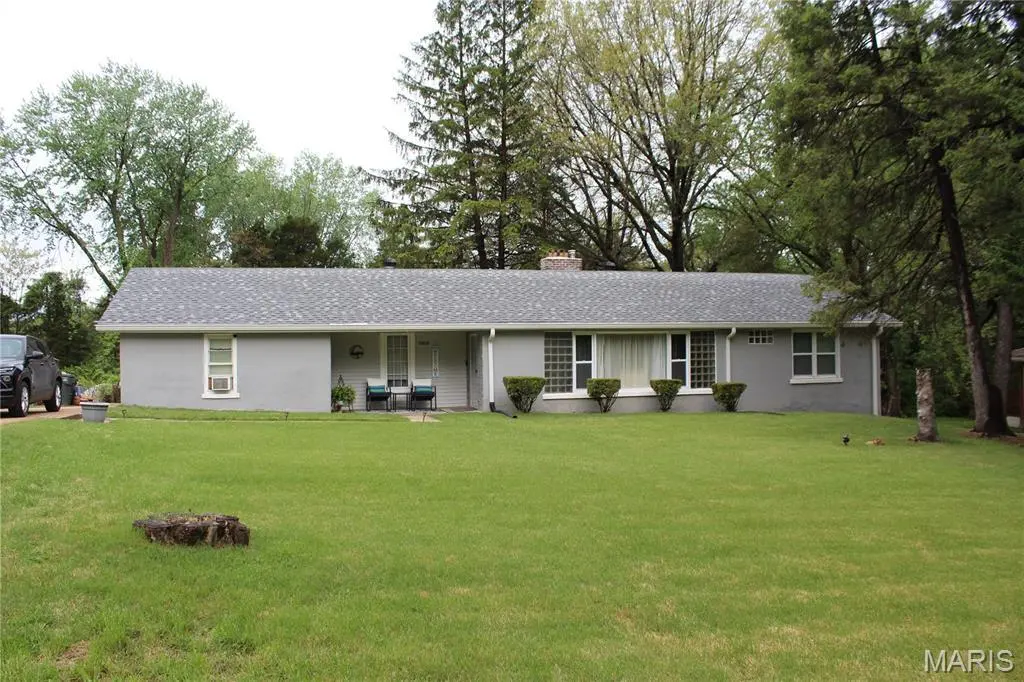
Expansive ranch home with 1785 sq ft, beautifully renovated with 4 bedrooms, luxury vinyl plank floors throughout & split floor plan. 2nd bedroom is currently being used as dressing room for primary bedroom. Kitchen is light, modern and functional with lots of storage. Refrigerator stays (AS IS). Spacious living area includes formal living room with wood burning fireplace and family room with exterior access leading to large level backyard. Nestled on a half acre lot creates the perfect space for entertaining. Lots of natural light spills through the large windows throughout the home (3+ years old). Washer and dryer stay (AS IS). Architectural roof is approximately 3 yrs old. Elementary school is one block from house.
Key facts
- Exterior access
- Lots of storage
- Split floor plan
Tags
Neighborhood map
What this means for you Summary
Snapshot
- This is a 4-bed/1.5-bath single-family listed at $170k.
Deal economics
- At list price, monthly cash flow is $167 ($2k/yr) — positive.
- The deal already cash-flows at list — no discount required.
- To meet the 1% rule (rent ≥ 1% of price), the offer needs to be $159k (6.4% below list).
- Recommended offer: $159k (6.4% below list) — sets the bar for 1% rule.
Location & tenants
- Location reads 65/100 on livability (#290 in MO) — a middle-class / working-renter tenant base. Strengths: commute A+, cost of living A+, housing A+; Watch: employment C-, schools F, crime F.
- Ferguson-Florissant R-II (suburban): math 7% / reading 20% proficiency, ranked #311 of 324 in MO (top 96%) — low school quality limits family demand, transient renter base, plan for 1-2y turnover; 70% free/reduced lunch — lower-income household profile, screen leases tightly.
- Market conditions: Rents rising fast (+9.0%/yr); 162 active listings in the ZIP; 11 comparable units currently listed for rent nearby; rentals at typical pace (median 24d on market — plan ~3-4 weeks tenant-placement turnaround); 920 units permitted in St. Louis County in 2024 (250 in 5+ unit buildings).
- This rent runs 36% of the median local income ($52k/yr) — at the standard rent-burdened threshold; future hikes will face affordability resistance.
Forward outlook
- Local home prices are declining (-3.0%/yr); year-one equity from $1k of loan paydown is wiped out by about $5k of value loss. Plan a longer hold.
- At projected returns (-3.0% appreciation + 8.0% rent growth), your $48k cash investment doubles in ~10 years — after that, you're playing with house money.
Negotiation context
- It's been on market 19 days — a 2% lower offer ($167k) is reasonable based on typical stale-listing flexibility.
- 3 sale attempts since 10y ago with the ask held roughly flat each time — persistent listings suggest the price (not the market) is what's stuck; bring a comps-based counter.
- Current owner paid $20k; list at $170k implies a 750% gain — meaningful room to come down on a strong offer.
Risks & watch-outs
- Watch-outs: built in 1950 — expect roof / HVAC / electrical / plumbing capex.
Questions for the listing agent
- Built in 1950 — when were the roof, HVAC, electrical panel, plumbing, and water heater last replaced?
- Is there a deadline driving the sale (1031 exchange, divorce, estate, relocation)? That informs how much negotiation room exists.
- Schools are F-rated, which usually means shorter tenancies and higher turnover. Who's the typical renter profile here, and what's been the actual vacancy rate?
- Crime grade is F in this area — have there been break-ins, vandalism, or insurance claims at this property in the last 3 years? What carrier currently insures it and at what premium?
- The area grade is low — what's the realistic commute time and amenity access for the typical tenant pool here? Any planned neighborhood developments (good or bad) we should know about?
- What's the average days-on-market for RENTAL listings here right now (not sales)? A rising rental-DOM trend means longer vacancies and softer asking-rent achievability than the comps imply.
- What's the recent tenant-quality profile in this submarket — average credit score on applications, eviction rate, late-payment / NSF rate, and stable-employment percentage? A property-management company in the area should have these aggregated.
- How much new for-sale + rental construction is in the pipeline within 1–3 miles? Heavy new supply typically softens prices + rents 12–24 months out; constrained supply supports both.
Investment metrics
- 1% rule
- 0.94% ✗
- Cap rate
- 7.47%
- Cash-on-cash
- 4.21%
- DSCR
- 1.19
- GRM
- 8.9
CMA / ARV
- ARV (median comp)
- $120,021
- List price
- $169,900
- Delta
- 41.56%
- Verdict
- OVERPRICED
- Comps
- 20 within 1.0 mi
Show comp detail 8 sales within ~0.75 mi
| Address | Dist | Beds/Ba | Sqft | Sold | Price | $/sf | Match |
|---|---|---|---|---|---|---|---|
| 5909 Annex Ct | 0.00mi | 4/1.0 | 1,785 (0%) | 0mo | $169,900 | $95 | 98 |
| 6009 Bermuda Dr | 0.15mi | 4/2.0 | 1,575 (-12%) | 1mo | $110,000 | $70 | 71 |
| 112 Woodstock Rd | 0.26mi | 3/1.0 (-1) | 1,813 (+2%) | 19mo | $60,000 | $33 | 63 |
| 18 Mintert Manor Dr | 0.48mi | 4/3.0 | 1,941 (+9%) | 6mo | $189,900 | $98 | 52 |
| 7549 Norwalk Ln | 0.62mi | 3/2.0 (-1) | 1,745 (-2%) | 20mo | $149,900 | $86 | 44 |
| 6202 Dupree Ave | 0.50mi | 3/2.0 (-1) | 1,568 (-12%) | 15mo | $115,000 | $73 | 37 |
| 7752 Wooddale Ln | 0.40mi | 4/2.5 | 2,035 (+14%) | 22mo | $179,000 | $88 | 36 |
| 5563 Norway Dr | 0.65mi | 3/1.5 (-1) | 1,583 (-11%) | 14mo | $104,900 | $66 | 34 |
Match score weights: distance 35% · size 25% · config 20% · recency 20%. Top-matched comps best support the ARV.
Projected returns pro-forma
-3.0% appreciation · 8.0% rent growth · sell at horizon
- IRR
- -4.6%
- Equity multiple
- 0.82×
- Total profit
- $-8,536
- Equity at exit
- $25,333
- IRR
- 9.9%
- Equity multiple
- 1.93×
- Total profit
- $44,364
- Equity at exit
- $14,690
Cash invested: $47,572 (down + closing). Projections, not guarantees.
Landlord ↔ Tenant lean methodology
- Overall (STATE)
- 81 Strongly Landlord-Friendly
- State Missouri
- 81 Strongly Landlord-Friendly · R+10
- County
- — inherits STATE
- City
- — inherits STATE
ZIP-level market 63135
- Rents YoY
- 9.0%
- Active inventory
- 162
- Price-to-rent
- 8.9×
Monthly cashflow live
- Estimated rent
- $1,590 high interval (Pro) →
- Mortgage (P&I)
- −$891
- Tax from tax record
- −$127 /mo · $1,526/yr
- Insurance
- −$71
- HOA
- −$0
- Vacancy / Maint / Mgmt
- −$334
- Net cashflow
- $167
Break-even live
UW: 25.0% down · 7.5% · 30yr · 1.5% tax · 5.0% vac · 8.0% maint · 8.0% mgmt
Financing live
Cash to close
- Down payment
- $42,475
- Closing costs
- $5,097
- Reserves months
- —
- Total cash needed
- —
Loan-product check · same deal, 3 products live
Conventional
25% down · 7.5% · 30yr
- Down + closing
- —
- Monthly P&I
- —
- Monthly cashflow
- —
- DSCR
- —
- Eligible?
- —
Personal DTI + credit; lowest rate.
DSCR
20% down · 8.5% · 30yr
- Down + closing
- —
- Monthly P&I
- —
- Monthly cashflow
- —
- DSCR
- —
- Eligible?
- —
No personal income docs; deal must DSCR.
Hard money
10% down · 12.0% · 12mo
- Down + closing
- —
- Monthly P&I
- —
- Monthly cashflow
- —
- DSCR
- —
- Eligible?
- —
Short-term bridge; refi at stabilization.
Rent comps 11 comps
| Address | Beds | Baths | Sqft | Rent | $/sqft | DOM | Units | Dist |
|---|---|---|---|---|---|---|---|---|
| 6170 Emerald Ave Saint Louis, MO | 3.0 | 1.0 | 1286 | $1,500 | $1.17 | 14d | 1 | 0.42mi |
| 6170 Emerald Ave Saint Louis, MO | 3.0 | 1.0 | 1286 | $1,425 | $1.11 | 2d | 1 | 0.42mi |
| 846 Elsworth Pl Saint Louis, MO | 4.0 | 1.0 | 1352 | $1,600 | $1.18 | 4d | 1 | 0.50mi |
| 7808 Winward Dr Saint Louis, MO | 3.0 | 1.0 | 1434 | $1,425 | $0.99 | 21d | 1 | 0.51mi |
| 299 Dashwood Dr Saint Louis, MO | 3.0 | 2.0 | 1920 | $1,575 | $0.82 | 23d | 1 | 0.90mi |
| 1006 Highmont Dr Saint Louis, MO | 3.0 | 1.0 | 1920 | $1,550 | $0.81 | 43d | 1 | 1.11mi |
| 265 S Harvey Ave Saint Louis, MO | 3.0 | 1.5 | 1240 | $1,350 | $1.09 | 43d | 1 | 1.18mi |
| 406 Tiffin Ave Ferguson, MO | 4.0 | 1.0 | 1888 | $1,525 | $0.81 | 43d | 1 | 1.22mi |
| 324 Emmett Ave Saint Louis, MO | 3.0 | 2.0 | 1357 | $1,650 | $1.22 | 23d | 1 | 1.39mi |
| 2646 Terrace Ln Saint Louis, MO | 3.0 | 2.0 | 1565 | $1,275 | $0.81 | 23d | 1 | 1.41mi |
| 8824 Huiskamp Ave Saint Louis, MO | 4.0 | 1.0 | 1548 | $1,200 | $0.78 | 23d | 1 | 1.43mi |
Listing history 21 events
-
2026-05-07status Pending 733-char remark
Show marketing remark (733 chars)
Expansive ranch home with 1785 sq ft, beautifully renovated with 4 bedrooms, luxury vinyl plank floors throughout & split floor plan. 2nd bedroom is currently being used as dressing room for primary bedroom. Kitchen is light, modern and functional with lots of storage. Refrigerator stays (AS IS). Spacious living area includes formal living room with wood burning fireplace and family room with exterior access leading to large level backyard. Nestled on a half acre lot creates the perfect space for entertaining. Lots of natural light spills through the large windows throughout the home (3+ years old). Washer and dryer stay (AS IS). Architectural roof is approximately 3 yrs old. Elementary school is one block from house.
-
2026-04-18$169,900 Active 733-char remark
Show marketing remark (733 chars)
Expansive ranch home with 1785 sq ft, beautifully renovated with 4 bedrooms, luxury vinyl plank floors throughout & split floor plan. 2nd bedroom is currently being used as dressing room for primary bedroom. Kitchen is light, modern and functional with lots of storage. Refrigerator stays (AS IS). Spacious living area includes formal living room with wood burning fireplace and family room with exterior access leading to large level backyard. Nestled on a half acre lot creates the perfect space for entertaining. Lots of natural light spills through the large windows throughout the home (3+ years old). Washer and dryer stay (AS IS). Architectural roof is approximately 3 yrs old. Elementary school is one block from house.
-
2022-07-14soldstatus
-
2017-06-08soldstatus $20,000
-
2017-06-05soldstatus Closed 325-char remark
Show marketing remark (325 chars)
Spacious ranch style home located in Normandy that sits on a half acre! This home includes four bedrooms, one and a half bathrooms, a stone fireplace in the living room, full unfinished basement that is walk-out, and a one car carport. The home is tucked away in a private area on a nice cul de sac! Schedule a showing today!
-
2017-04-22status Pending 325-char remark
Show marketing remark (325 chars)
Spacious ranch style home located in Normandy that sits on a half acre! This home includes four bedrooms, one and a half bathrooms, a stone fireplace in the living room, full unfinished basement that is walk-out, and a one car carport. The home is tucked away in a private area on a nice cul de sac! Schedule a showing today!
-
2017-02-08$27,000 Active 325-char remark
Show marketing remark (325 chars)
Spacious ranch style home located in Normandy that sits on a half acre! This home includes four bedrooms, one and a half bathrooms, a stone fireplace in the living room, full unfinished basement that is walk-out, and a one car carport. The home is tucked away in a private area on a nice cul de sac! Schedule a showing today!
-
2016-12-19soldstatus Closed
-
2016-11-10status Pending
-
2016-10-27price $16,900
-
2016-10-05price $19,750
-
2016-09-06$22,500 Active
-
2008-01-04soldstatus
-
2006-02-15soldstatus
-
2005-09-14soldstatus $120,000
-
2004-11-02soldstatus $45,000
-
1998-09-14soldstatus $35,000
-
1994-06-15soldstatus
-
1994-06-15soldstatus
-
1992-08-04soldstatus
-
1992-08-04soldstatus
ⓘ Source: listings_history table (triggers on properties + properties_extension) + one-shot
backfill from property_details.listing_events for pre-trigger history.
Tax reassessment forecast MO · Resets to sale price
- Current annual tax
- $1,526 · $127/mo
- Projected year-2 tax
- $1,648 · $137/mo
- Expected delta
- +$122/yr (+$10/mo · 8.0%)
ⓘ Screening estimate from a state-policy table — verify with the county assessor before closing.
Climate risk First Street
- Flood 1/10 Low FEMA zone X (unshaded) · 0% chance over 30 yrs
- Wildfire 1/10 Low
- Heat 4/10 Moderate 7 d/yr ≥107°F today · 19 d/yr by 30 yrs out
- Wind 2/10 Low 100% chance of damaging wind over 30 yrs
- Air quality 4/10 Moderate 4 unhealthy d/yr today · 5 by 30 yrs out
Nearby sold comps map
Loading sold comps map…
Walkable amenities ~0.75 mi
Loading nearby amenities…
Taxation est. · year 1
- Rental income
- $19,075
- − Mortgage interest
- −$9,517
- − Property taxes
- −$1,526
- − Insurance
- −$850
- − Repairs & maintenance
- −$1,526
- − Management
- −$1,526
- − Depreciation
- −$4,943
- Taxable loss
- −$813
- Est. tax savings @ 24.0%
- +$195
- After-tax cash flow
- $2,196/yr
For passive investors: Depreciation is non-cash, so a rental often shows a tax loss while cash-flowing — sheltering income. Rental losses are passive: they offset passive income freely, and up to $25,000/yr can offset ordinary (W-2) income if you actively participate and your MAGI is under $100k (phasing out to $0 by $150k); unused losses carry forward. On sale, claimed depreciation is recaptured at up to 25%, and gains may owe capital-gains tax (a 1031 exchange can defer both). Figures are a year-1 estimate at your 24.0% rate — not tax advice; consult a CPA.
Schools (NCES district)
- District
- Ferguson-Florissant R-II
- NCES district ID
- 2912010
- Math proficiency
- 7% ▼ -9.00%
- Reading proficiency
- 20% ▼ -6.00%
- Median HH income
- $44,610
- Composite
- 11.96/100
- National rank
- #9666
- State rank
- #311 of 324 in MO
Livability — Normandy
- Score
- 65/100
- State rank
- #290
- US rank
- #13498
Category grades
Schools grade is shown separately in the Schools card above.
Census & demographics
- Census place
- Normandy, MO
- County
- Saint Louis County · 888,823 people
- City population
- 25,008
- Metro
- St. Louis, MO-IL
- Population (ZIP)
- 18,381
- Household income
- $52,328
- Rent vs Own
- Severe rent burden
- 957.0
Population outlook (St. Louis County) Hauer SSP2
- Today (2025)
- 1,025,227 people
- By 2030
- 1,028,023 · +0.3%
- By 2040
- 1,020,940 · -0.4%
- By 2050
- 1,007,280 · -1.8%
- By 2075
- 987,277 · -3.7%
- By 2100
- 921,984 · -10.1%
Race, ethnicity, and origin ACS 2023
- Neighborhood character
- Predominantly Black (66%)
- Race & ethnicity
- Black 66% White 28% Two or more races 3% Hispanic / Latino 2%
- Common ancestry
- Lithuanian 1% Iranian 1% Romanian 1%
- Foreign-born
- 1% · Canada
- Languages at home
- 95% English-only · Spanish 4%
Political lean MEDSL · St. Louis
- 2024 margin
- Strong D (+23.4) · D 60.8% · R 37.4% · Other 1.7%
- 2008→2024 swing
- +3.5pp toward D · 2008: 19.9pp · 2024: 23.4pp
- All cycles
- 2024: D+23.4 2020: D+24.0 2016: D+16.2 2012: D+13.7 2008: D+19.9
Not yet ingested
- Civics
- —
Market trends
- HPI YoY
- ▼ -152.56%
- Current HPI
- 138.6781
- Rent YoY
- ▲ 9.03%
- Metro
- St. Louis, MO-IL
- State GDP YoY
- ▲ 1.84%
- F500 in state
- 20
Industry mix (Fortune 500 HQ in MO)
| Industry | F500 HQs | Revenue |
|---|---|---|
| Healthcare | 1 | $163B |
|
||
| Insurance | 1 | $21B |
|
||
| Industrial Technology | 1 | $17B |
|
||
| Retail | 1 | $16B |
|
||
| Industrial Distribution | 1 | $10B |
|
||
| Utilities | 1 | $9B |
|
||
Price history
+385.4% since first listed21 events — show timeline
- 2026-05-07 Pending — MARIS as Distributed by MLS Grid
- 2026-04-18 Listed $169,900 MARIS as Distributed by MLS Grid
- 2022-07-14 Sold (Public Records) — Public Records
- 2017-06-08 Sold (Public Records) $20,000 Public Records
- 2017-06-05 Sold (MLS) — MARIS as Distributed by MLS Grid
- 2017-04-22 Pending — MARIS as Distributed by MLS Grid
- 2017-02-08 Listed $27,000 MARIS as Distributed by MLS Grid
- 2016-12-19 Sold (MLS) — MARIS as Distributed by MLS Grid
- 2016-11-10 Pending — MARIS as Distributed by MLS Grid
- 2016-10-27 Price Changed $16,900 MARIS as Distributed by MLS Grid
- 2016-10-05 Price Changed $19,750 MARIS as Distributed by MLS Grid
- 2016-09-06 Listed $22,500 MARIS as Distributed by MLS Grid
- 2008-01-04 Sold (Public Records) — Public Records
- 2006-02-15 Sold (Public Records) — Public Records
- 2005-09-14 Sold (Public Records) $120,000 Public Records
- 2004-11-02 Sold (Public Records) $45,000 Public Records
- 1998-09-14 Sold (Public Records) $35,000 Public Records
- 1994-06-15 Sold (Public Records) — Public Records
- 1994-06-15 Sold (Public Records) — Public Records
- 1992-08-04 Sold (Public Records) — Public Records
- 1992-08-04 Sold (Public Records) — Public Records
Property tax history
-2.3%/yrLatest (2022): $1,526 · +0.3% YoY. Source: county tax records.
Cash-flow waterfall
monthlySold comps — $/sqft
last 12 mo · ≤1 miLoading sold comps…