 Duplex
11 White St · New York, NY
Flood risk 7/10 · Major
- FEMA flood zone
- X (unshaded)
- Chance of flooding over 30 yrs
- 0.77%
- Est. flood insurance / yr
- $507 – $1,088
Fire risk 1/10 · Minimal
- Est. fire insurance / yr
- $691 – $1,283
Heat risk 7/10 · Major
- Hot days now (above 98°F)
- 7 days/yr
- Hot days in 30 yrs
- 16 days/yr
Wind risk 6/10 · Moderate
- Chance of severe wind over 30 yrs
- 64.0%
Air-quality risk 4/10 · Minor
- Unhealthy air days now
- 5 days/yr
- Unhealthy air days in 30 yrs
- 7 days/yr
Risk factors via First Street. Map © Google.
Why this score? — see what drove the D+ grade
The composite is a weighted blend of 9 inputs, each scored 0–100. Each bar is that input's sub-score; the figure is the points it added to the 100-point composite (weight × sub-score).
- Cash flow +13.3/30.0
- ARV discount +9.2/15.0
- Schools +5.0/10.0
- Rent growth +4.4/5.0
- DSCR +4.0/10.0
- Livability +3.8/5.0
- 1% rule +3.0/10.0
- Condition / age +2.5/5.0
- Appreciation +0.0/10.0
$798,888
🖨 Deal sheet (PDF) 📄 Offer letter ✓ Due diligence
Multi-family units
County records classify this as Multi-Family (2-4 Unit). Listing-text estimate: 2 units. confirmed
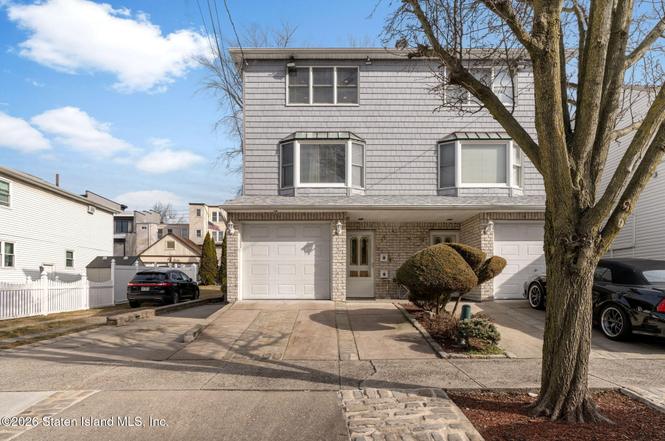
Listing remarks
Semi-attached two-family home located in Rosebank offering nice curb appeal with new roof and new siding. The property features a functional multi-level layout with separate living spaces, making it ideal for an end-user seeking rental income or an investor looking for value-add potential. The main unit includes a garage and storage on the first level with interior access. The second level offers a kitchen, combined living and dining area, half bath, and sliding glass doors leading to a rear deck. The third floor features two generously sized bedrooms and a full bathroom. The second unit is a one-bedroom, one-bath apartment with a separate side entrance. Conveniently located near transporta
Key facts
- New siding
- Sliding glass doors
- Multi-level layout
Tags
Neighborhood map
What this means for you Summary
Snapshot
- This is a 2 × 2-bed/5.0-bath units multifamily listed at $799k.
Deal economics
- At list price, monthly cash flow is $-60 ($-718/yr) — negative. Per door: $-30/mo.
- To cash-flow at today's rent, offer at most $788k (1.3% below list).
- To meet the 1% rule (rent ≥ 1% of price), the offer needs to be $637k (20.3% below list).
- Recommended offer: $637k (20.3% below list) — sets the bar for 1% rule.
- Cap rate 6.3% vs local median 2.6% in New York — top-decile yield for the area; either an underpriced asset or a hidden risk that comps aren't pricing in. Stress-test before assuming the spread holds.
Location & tenants
- Location reads 75/100 on livability (#268 in NY, #4,188 nationally) — a middle-class / working-renter tenant base. Strengths: amenities A+, commute A+, health & safety A; Watch: crime F, cost of living F.
- Zoned schools: Elm Tree Elementary School (math 27% / reading 52%, grade F, #1,444 of 2,108 statewide, top 71%, 806 students, 94% FRL); Jhs 383 Philippa Schuyler (math 32% / reading 67%, grade C, #280 of 729 statewide, top 40%, 822 students, 85% FRL); Midwood High School (math 94% / reading 96%, grade A+, #83 of 1,100 statewide, top 8%, 4,062 students, 73% FRL).
- Market conditions: Rents rising fast (+7.5%/yr); 257 active listings in the ZIP; 2 comparable units currently listed for rent nearby; solid renter incomes; 480 units permitted in Richmond County in 2024 (22 in 5+ unit buildings).
- At $6,366/mo this rent would consume 92% of the median local household income ($83k/yr) (locally 1647% of renters already pay >50% of income on rent) — very limited rent-growth headroom before tenants either downsize or default.
Forward outlook
- Local home prices are declining (-3.0%/yr); year-one equity from $6k of loan paydown is wiped out by about $24k of value loss. Plan a longer hold.
- Richmond County population projected to shrink 5% by 2050 — rents likely to lag national; underwrite the cash flow, not the appreciation.
Negotiation context
- It's been on market 98 days — a 9% lower offer ($727k) is reasonable based on typical stale-listing flexibility.
Risks & watch-outs
- Watch-outs: flood insurance adds $66/mo.
- Climate carrying-cost: major flood risk; major wind risk, 64% chance of damaging wind over 30y; extreme-heat days projected 7→16/yr by 2055 (HVAC capex compounding) — expect insurance premiums to compound above CPI over the hold.
Questions for the listing agent
- What do current leases actually rent for vs. the listed asking? Can we see a recent rent roll and the last 12 months of T-12 income?
- It's been on market 98 days. Have you received any prior offers? Is the seller open to a 20% concession, seller financing, or rate buy-down credit?
- Can we see the unit-by-unit rent roll, current vacancy, and any below-market leases? What's the average tenancy length?
- What capital expenditures (roof, boiler, parking lot, exteriors) have been made in the last 5 years, and what's planned in the next 2?
- What's the actual annual flood-insurance premium (NFIP or private), and is the property in a SFHA with mandatory coverage?
- Why hasn't it sold? Are there any deal-killer items the seller is aware of (foundation, flood, title, zoning, code violations)?
- Is there a deadline driving the sale (1031 exchange, divorce, estate, relocation)? That informs how much negotiation room exists.
- Schools are B-rated — typically a magnet for longer-tenancy family renters. What's the average tenant stay here, and is there a school-zone premium baked into asking?
- Crime grade is F in this area — have there been break-ins, vandalism, or insurance claims at this property in the last 3 years? What carrier currently insures it and at what premium?
- The area grade is low — what's the realistic commute time and amenity access for the typical tenant pool here? Any planned neighborhood developments (good or bad) we should know about?
- What's the average days-on-market for RENTAL listings here right now (not sales)? A rising rental-DOM trend means longer vacancies and softer asking-rent achievability than the comps imply.
- What's the recent tenant-quality profile in this submarket — average credit score on applications, eviction rate, late-payment / NSF rate, and stable-employment percentage? A property-management company in the area should have these aggregated.
- How much new apartment / multifamily construction is in the pipeline within 1–3 miles? Heavy new supply (>2% of stock underway) typically softens rents 12–24 months out; light construction supports rent growth.
Investment metrics
- 1% rule
- 0.80% ✗
- Cap rate
- 6.30%
- Cash-on-cash
- 0.04%
- DSCR
- 1.00
- GRM
- 10.5
CMA / ARV
- ARV (on-the-fly)
- $830,070
- Comps found
- 9
Show comp detail 9 sales within ~0.75 mi
| Address | Dist | Beds/Ba | Sqft | Sold | Price | $/sf | Match |
|---|---|---|---|---|---|---|---|
| 11 Lyman Ave | 0.40mi | 5/3.0 (+1) | 2,012 (+0%) | 2mo | $1,090,000 | $542 | 60 |
| 1206 Bay St | 0.07mi | 4/3.0 | 1,773 (-12%) | 4mo | $825,000 | $465 | 54 |
| 301 Maryland Ave | 0.34mi | 3/1.0 (-1) | 1,977 (-1%) | 12mo | $850,000 | $430 | 52 |
| 443 Home Ave | 0.29mi | 5/2.0 (+1) | 1,908 (-5%) | 10mo | $790,000 | $414 | 50 |
| 243 Tompkins Ave | 0.68mi | 3/3.5 (-1) | 2,006 (0%) | 2mo | $660,000 | $329 | 47 |
| 50 Hope Ave | 0.20mi | 5/2.0 (+1) | 2,295 (+14%) | 2mo | $770,000 | $336 | 45 |
| 241 Tompkins Ave | 0.69mi | 4/2.5 | 2,016 (+0%) | 6mo | $700,000 | $347 | 42 |
| 28 White Plains Ave | 0.51mi | 4/2.0 | 1,737 (-13%) | 13mo | $810,000 | $466 | 23 |
| 58 Vanderbilt Ave | 0.74mi | 5/2.5 (+1) | 2,272 (+13%) | 10mo | $780,000 | $343 | 15 |
Match score weights: distance 35% · size 25% · config 20% · recency 20%. Top-matched comps best support the ARV.
Projected returns pro-forma
-3.0% appreciation · 7.5% rent growth · sell at horizon
- IRR
- -12.3%
- Equity multiple
- 0.54×
- Total profit
- $-103,307
- Equity at exit
- $119,117
- IRR
- 2.1%
- Equity multiple
- 1.18×
- Total profit
- $40,138
- Equity at exit
- $69,073
Cash invested: $223,689 (down + closing). Projections, not guarantees.
Landlord ↔ Tenant lean methodology
- Overall (CITY)
- 0 Strongly Tenant-Friendly
- State New York
- 15 Strongly Tenant-Friendly · D+10
- County
- — inherits STATE
- City New York
- 0 Strongly Tenant-Friendly · D+34
ZIP-level market 10305
- Rents YoY
- 7.5%
- Active inventory
- 257
- Price-to-rent
- 20.9×
Monthly cashflow live
- Estimated rent
- $6,366 medium interval (Pro) →
- Mortgage (P&I)
- −$4,189
- Tax from tax record
- −$500 /mo · $6,003/yr
- Insurance
- −$333
- Flood insurance flood zone
- −$66 /mo · $798/yr
- HOA
- −$0
- Lot rent
- −$0
- Vacancy / Maint / Mgmt
- −$1,337
- Net cashflow
- $-60
Break-even live
Sensitivity live
| Price | -10% $392 | -5% $166 | +0% $-60 | +5% $-286 | +10% $-512 |
|---|---|---|---|---|---|
| Rent | -10% $-563 | -5% $-311 | +0% $-60 | +5% $192 | +10% $443 |
| Rate | -1.0pp $342 | -0.5pp $143 | base $-60 | +0.5pp $-267 | +1.0pp $-477 |
2-unit breakdown (identical units grouped — click to expand)
| Units | Beds | Baths | Est. rent |
|---|---|---|---|
| 2× units | 2 | 5 | $6,366 |
| #1 | 2 | 5 | $3,183 |
| #2 | 2 | 5 | $3,183 |
| Total (2 units) | $6,366 | ||
UW: 25.0% down · 7.5% · 30yr · 1.5% tax · 5.0% vac · 8.0% maint · 8.0% mgmt
Financing live
Cash to close
- Down payment
- $199,722
- Closing costs
- $23,967
- Reserves months
- —
- Total cash needed
- —
Loan-product check · same deal, 3 products live
Conventional
25% down · 7.5% · 30yr
- Down + closing
- —
- Monthly P&I
- —
- Monthly cashflow
- —
- DSCR
- —
- Eligible?
- —
Personal DTI + credit; lowest rate.
DSCR
20% down · 8.5% · 30yr
- Down + closing
- —
- Monthly P&I
- —
- Monthly cashflow
- —
- DSCR
- —
- Eligible?
- —
No personal income docs; deal must DSCR.
Hard money
10% down · 12.0% · 12mo
- Down + closing
- —
- Monthly P&I
- —
- Monthly cashflow
- —
- DSCR
- —
- Eligible?
- —
Short-term bridge; refi at stabilization.
Rent comps 2 comps
| Address | Beds | Baths | Sqft | Rent | $/sqft | DOM | Units | Dist |
|---|---|---|---|---|---|---|---|---|
| 64 Claradon Ln Staten Island, NY | 3.0 | 2.5 | 1976 | $3,500 | $1.77 | 10d | 1 | 0.76mi |
| 17 Cunard Ave Staten Island, NY | 3.0 | 2.0 | 1700 | $3,650 | $2.15 | 27d | 1 | 1.15mi |
Listing history 3 events
-
2026-04-28status Pending
-
2026-01-18$798,888 Active
-
2023-01-18price $850,000
ⓘ Source: listings_history table (triggers on properties + properties_extension) + one-shot
backfill from property_details.listing_events for pre-trigger history.
Tax reassessment forecast NY · Partial reset (capped growth)
- Current annual tax
- $6,003 · $500/mo
- Projected year-2 tax
- $9,752 · $813/mo
- Expected delta
- +$3,749/yr (+$312/mo · 62.5%)
ⓘ Screening estimate from a state-policy table — verify with the county assessor before closing.
Climate risk First Street
- Flood 7/10 Severe FEMA zone X (unshaded) · 77% chance over 30 yrs
- Wildfire 1/10 Low
- Heat 7/10 Severe 7 d/yr ≥98°F today · 16 d/yr by 30 yrs out
- Wind 6/10 Major 64% chance of damaging wind over 30 yrs
- Air quality 4/10 Moderate 5 unhealthy d/yr today · 7 by 30 yrs out
Nearby sold comps map
Loading sold comps map…
Walkable amenities ~0.75 mi
Loading nearby amenities…
Taxation est. · year 1
- Rental income
- $76,392
- − Mortgage interest
- −$44,750
- − Property taxes
- −$6,003
- − Insurance
- −$4,792
- − Repairs & maintenance
- −$6,111
- − Management
- −$6,111
- − Depreciation
- −$23,240
- Taxable loss
- −$14,616
- Est. tax savings @ 24.0%
- +$3,508
- After-tax cash flow
- $2,789/yr
For passive investors: Depreciation is non-cash, so a rental often shows a tax loss while cash-flowing — sheltering income. Rental losses are passive: they offset passive income freely, and up to $25,000/yr can offset ordinary (W-2) income if you actively participate and your MAGI is under $100k (phasing out to $0 by $150k); unused losses carry forward. On sale, claimed depreciation is recaptured at up to 25%, and gains may owe capital-gains tax (a 1031 exchange can defer both). Figures are a year-1 estimate at your 24.0% rate — not tax advice; consult a CPA.
Schools (NCES district)
No district data.
Livability — New York
- Score
- 75/100
- State rank
- #268
- US rank
- #4188
Category grades
Schools grade is shown separately in the Schools card above.
Census & demographics
- Census place
- New York, NY
- County
- Richmond County · 404,174 people
- City population
- 7,731,280
- Metro
- New York-Newark-Jersey City, NY-NJ-PA
- Population (ZIP)
- 41,270
- Household income
- $83,413
- Rent vs Own
- Severe rent burden
- 1647.0
Population outlook (Richmond County) Hauer SSP2
- Today (2025)
- 482,784 people
- By 2030
- 481,831 · -0.2%
- By 2040
- 473,159 · -2.0%
- By 2050
- 457,242 · -5.3%
- By 2075
- 408,029 · -15.5%
- By 2100
- 341,459 · -29.3%
Race, ethnicity, and origin ACS 2023
- Neighborhood character
- Diverse neighborhood (Simpson 0.60)
- Race & ethnicity
- White 58% Asian 21% Hispanic / Latino 15% Two or more races 7% Black 3%
- Hispanic origin (detail)
- Mexican 4% Puerto Rican 8%
- Common ancestry
- Scotch-Irish 5% Romanian 4% Subsaharan African 2%
- Foreign-born
- 36% · China, Canada, Jamaica
- Languages at home
- 52% English-only · Chinese 13% Russian/Polish/Slavic 12% Other Indo-European 8%
Political lean MEDSL · Richmond
- 2024 margin
- Strong R (+29.8) · D 35.1% · R 64.9%
- 2008→2024 swing
- -25.7pp toward R · 2008: -4.0pp · 2024: -29.8pp
- All cycles
- 2024: R+29.8 2020: R+14.9 2016: R+16.8 2012: D+0.8 2008: R+4.0
Not yet ingested
- Civics
- —
Market trends
- HPI YoY
- ▼ -487.06%
- Current HPI
- 342.7938
- Rent YoY
- ▲ 7.50%
- Metro
- New York-Newark-Jersey City, NY-NJ-PA
- State GDP YoY
- ▲ 2.60%
- F500 in state
- 92
Industry mix (Fortune 500 HQ in NY)
| Industry | F500 HQs | Revenue |
|---|---|---|
| Financial Services | 10 | $950B |
|
||
| Consumer Goods | 9 | $162B |
|
||
| Insurance | 4 | $225B |
|
||
| Telecommunications | 2 | $144B |
|
||
| Pharmaceuticals | 2 | $112B |
|
||
| Media / Entertainment | 2 | $69B |
|
||
Price history
-6.0% since first listed3 events — show timeline
- 2026-04-28 Pending — SIBORMLS
- 2026-01-18 Listed $798,888 SIBORMLS
- 2023-01-18 Price Changed $850,000 BNYMLS
Property tax history
+4.2%/yrLatest (2025): $6,003 · +6.3% YoY. Source: county tax records.
Cash-flow waterfall
monthlySold comps — $/sqft
last 12 mo · ≤1 miLoading sold comps…