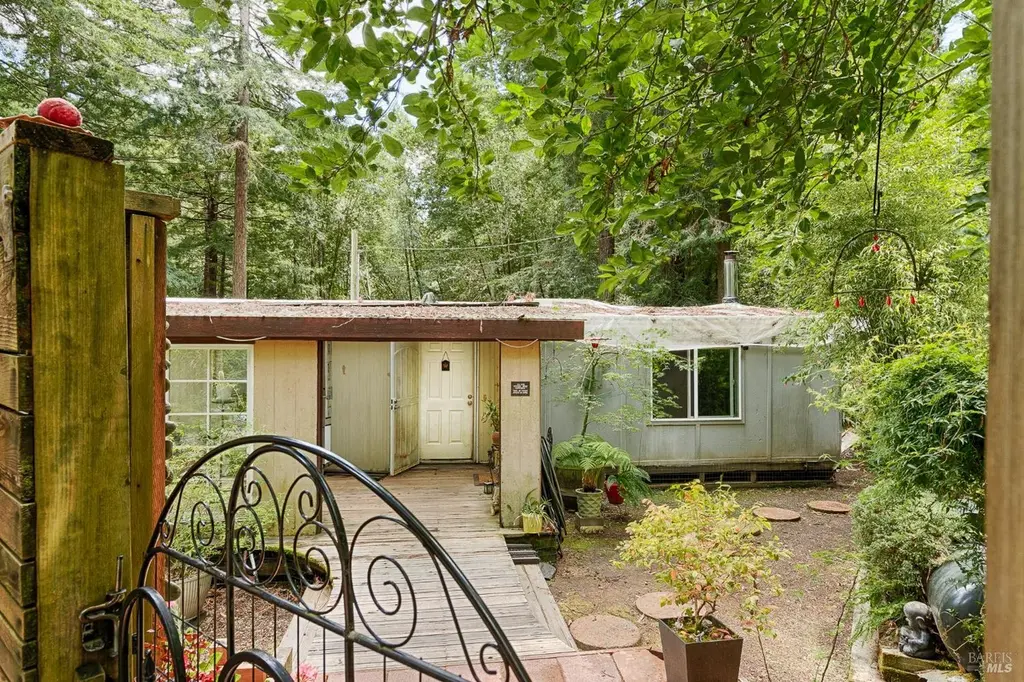
7 Magic Mountain Rd · Cazadero, CA
Flood risk 1/10 · Minimal
- FEMA flood zone
- X (unshaded)
- Chance of flooding over 30 yrs
- 0.0%
- Est. flood insurance / yr
- $507 – $1,088
Fire risk 4/10 · Minor
- Est. fire insurance / yr
- $659 – $1,223
Heat risk 2/10 · Minimal
- Hot days now (above 84°F)
- 8 days/yr
- Hot days in 30 yrs
- 22 days/yr
Wind risk 1/10 · Minimal
- Chance of severe wind over 30 yrs
- —
Air-quality risk 9/10 · Severe
- Unhealthy air days now
- 17 days/yr
- Unhealthy air days in 30 yrs
- 19 days/yr
Risk factors via First Street. Map © Google.
Why this score? — see what drove the B- grade
The composite is a weighted blend of 9 inputs, each scored 0–100. Each bar is that input's sub-score; the figure is the points it added to the 100-point composite (weight × sub-score).
- Cash flow +30.0/30.0
- 1% rule +10.0/10.0
- DSCR +10.0/10.0
- ARV discount +7.5/15.0
- Schools +4.3/10.0
- Livability +2.9/5.0
- Rent growth +2.5/5.0
- Condition / age +2.5/5.0
- Appreciation +0.0/10.0
$179,000
🖨 Deal sheet (PDF) 📄 Offer letter ✓ Due diligence
Listing remarks MLS
This mobile home needs remodeling. Electrical service was upgraded with permits but the interior electrical needs to be completed. This is a fixer.
Key facts
- Space for storage
- Detached studio
- Storage containers
Tags
Property features AI
Finance
- HOA & community: Member of Magic Mountain Property Owners' Association; Association fee $2,300 annually; Association provides other amenities
Exterior
- Parking: 2 parking spaces (unassigned)
- Utilities: Septic system
- Home design: Residential mobile home; Single-story; Main level includes bedrooms, full baths, and kitchen
- Construction: No ADU/second unit
- Exterior features: Lot allows no horses; Lot features: other
Interior
- Kitchen: Main-level kitchen
- Bedrooms: 2 bedrooms (main level)
- Bathrooms: 2 full bathrooms
- Heating & cooling: Other heating; Other cooling
- Interior features: One-story home; Wood-burning fireplace; No basement
- Laundry & utility: Laundry available (other)
Neighborhood map
What this means for you Summary
Snapshot
- This is a 2-bed/2.0-bath manufactured listed at $179k.
Deal economics
- At list price, monthly cash flow is $879 ($11k/yr) — positive.
- The deal already cash-flows at list — no discount required.
- Meets the 1% rule at list price ($3k rent vs $179k).
Location & tenants
- Location reads 58/100 on livability (#722 in CA) — a working-class tenant base; expect higher turnover. Strengths: employment A+, housing A, schools B; Watch: crime C-, health & safety D, amenities F.
- West Sonoma County Union High (suburban): math 43% / reading 56% proficiency, ranked #143 of 517 in CA (top 28%) — families likely to look elsewhere, expect single-tenant / working-renter base with shorter leases.
- Market conditions: 29 active listings in the ZIP; 1,039 units permitted in Sonoma County in 2024 (185 in 5+ unit buildings).
Forward outlook
- Local home prices are declining (-3.0%/yr); year-one equity from $1k of loan paydown is wiped out by about $5k of value loss. Plan a longer hold.
- Sonoma County population projected at +8% by 2050 — modest demand growth; plan on rents tracking national, not racing it.
- At projected returns (-3.0% appreciation + 3.0% rent growth), your $50k cash investment doubles in ~6 years — after that, you're playing with house money.
Negotiation context
- Only 13 days on market — expect competitive offers; lowballing is unlikely to land.
- 3 sale attempts since 14y ago with the ask held roughly flat each time — persistent listings suggest the price (not the market) is what's stuck; bring a comps-based counter.
- Current owner paid $91k; list at $179k implies a 97% gain — meaningful room to come down on a strong offer.
Questions for the listing agent
- Built in 1972 — when were the roof, HVAC, electrical panel, plumbing, and water heater last replaced?
- What does the HOA fee cover, when was the last increase, and are there any pending special assessments or reserve-fund shortfalls?
- Is there a deadline driving the sale (1031 exchange, divorce, estate, relocation)? That informs how much negotiation room exists.
- Schools are B-rated — typically a magnet for longer-tenancy family renters. What's the average tenant stay here, and is there a school-zone premium baked into asking?
- What's the average days-on-market for RENTAL listings here right now (not sales)? A rising rental-DOM trend means longer vacancies and softer asking-rent achievability than the comps imply.
- What's the recent tenant-quality profile in this submarket — average credit score on applications, eviction rate, late-payment / NSF rate, and stable-employment percentage? A property-management company in the area should have these aggregated.
- How much new for-sale + rental construction is in the pipeline within 1–3 miles? Heavy new supply typically softens prices + rents 12–24 months out; constrained supply supports both.
Investment metrics
- 1% rule
- 1.54% ✓
- Cap rate
- 12.19%
- Cash-on-cash
- 21.04%
- DSCR
- 1.94
- GRM
- 5.4
CMA / ARV
No comps found within radius.
Projected returns pro-forma
-3.0% appreciation · 3.0% rent growth · sell at horizon
- IRR
- 13.5%
- Equity multiple
- 1.54×
- Total profit
- $27,057
- Equity at exit
- $26,689
- IRR
- 22.4%
- Equity multiple
- 2.92×
- Total profit
- $95,981
- Equity at exit
- $15,477
Cash invested: $50,120 (down + closing). Projections, not guarantees.
Landlord ↔ Tenant lean methodology
- Overall (STATE)
- 18 Strongly Tenant-Friendly
- State California
- 18 Strongly Tenant-Friendly · D+13
- County
- — inherits STATE
- City
- — inherits STATE
ZIP-level market 95421
- Home prices YoY
- -23.8%
- Active inventory
- 29
- Price-to-rent
- 5.4×
Monthly cashflow live
- Estimated rent
- $2,764 medium interval (Pro) →
- Mortgage (P&I)
- −$939
- Tax from tax record
- −$99 /mo · $1,191/yr
- Insurance
- −$75
- HOA
- −$192
- Vacancy / Maint / Mgmt
- −$580
- Net cashflow
- $879
Break-even live
Sensitivity live
| Price | -10% $980 | -5% $930 | +0% $879 | +5% $828 | +10% $778 |
|---|---|---|---|---|---|
| Rent | -10% $661 | -5% $770 | +0% $879 | +5% $988 | +10% $1,097 |
| Rate | -1.0pp $969 | -0.5pp $924 | base $879 | +0.5pp $833 | +1.0pp $785 |
UW: 25.0% down · 7.5% · 30yr · 1.5% tax · 5.0% vac · 8.0% maint · 8.0% mgmt
Financing live
Cash to close
- Down payment
- $44,750
- Closing costs
- $5,370
- Reserves months
- —
- Total cash needed
- —
Loan-product check · same deal, 3 products live
Conventional
25% down · 7.5% · 30yr
- Down + closing
- —
- Monthly P&I
- —
- Monthly cashflow
- —
- DSCR
- —
- Eligible?
- —
Personal DTI + credit; lowest rate.
DSCR
20% down · 8.5% · 30yr
- Down + closing
- —
- Monthly P&I
- —
- Monthly cashflow
- —
- DSCR
- —
- Eligible?
- —
No personal income docs; deal must DSCR.
Hard money
10% down · 12.0% · 12mo
- Down + closing
- —
- Monthly P&I
- —
- Monthly cashflow
- —
- DSCR
- —
- Eligible?
- —
Short-term bridge; refi at stabilization.
HOA detail
- Monthly dues
- $192 · $2,304/yr
- Likely covers
- electric
Listing history 10 events
-
2026-06-21days on market $179,000 Active 13 DOM
-
2026-06-18days on market $179,000 Active 10 DOM
-
2026-06-17days on market $179,000 Active 9 DOM
-
2026-06-16days on market $179,000 Active 8 DOM
-
2026-06-15days on market $179,000 Active 7 DOM
-
2026-06-14days on market $179,000 Active 5 DOM
-
2026-06-13days on market $179,000 Active 4 DOM
-
2026-06-10days on market $179,000 Active 2 DOM
-
2026-06-08remarks 628-char remark
-
2026-06-08$179,000 Active 1 DOM
ⓘ Source: listings_history table (triggers on properties + properties_extension) + one-shot
backfill from property_details.listing_events for pre-trigger history.
Tax reassessment forecast CA · Resets to sale price
- Current annual tax
- $1,191 · $99/mo
- Projected year-2 tax
- $1,360 · $113/mo
- Expected delta
- +$169/yr (+$14/mo · 14.2%)
ⓘ Screening estimate from a state-policy table — verify with the county assessor before closing.
Climate risk First Street
- Flood 1/10 Low FEMA zone X (unshaded) · 0% chance over 30 yrs
- Wildfire 4/10 Moderate
- Heat 2/10 Low 8 d/yr ≥84°F today · 22 d/yr by 30 yrs out
- Wind 1/10 Low
- Air quality 9/10 Extreme 17 unhealthy d/yr today · 19 by 30 yrs out
Nearby sold comps map
Loading sold comps map…
Walkable amenities ~0.75 mi
Loading nearby amenities…
Taxation est. · year 1
- Rental income
- $33,167
- − Mortgage interest
- −$10,027
- − Property taxes
- −$1,191
- − Insurance
- −$895
- − Repairs & maintenance
- −$2,653
- − Management
- −$2,653
- − HOA
- −$2,304
- − Depreciation
- −$5,207
- Taxable income
- $8,236
- Est. tax owed @ 24.0%
- −$1,977
- After-tax cash flow
- $8,571/yr
For passive investors: Depreciation is non-cash, so a rental often shows a tax loss while cash-flowing — sheltering income. Rental losses are passive: they offset passive income freely, and up to $25,000/yr can offset ordinary (W-2) income if you actively participate and your MAGI is under $100k (phasing out to $0 by $150k); unused losses carry forward. On sale, claimed depreciation is recaptured at up to 25%, and gains may owe capital-gains tax (a 1031 exchange can defer both). Figures are a year-1 estimate at your 24.0% rate — not tax advice; consult a CPA.
Schools (NCES district)
- District
- West Sonoma County Union High
- NCES district ID
- 0602670
- Math proficiency
- 43% ▲ 16.00%
- Reading proficiency
- 56% ▼ -1.00%
- Median HH income
- $61,845
- Composite
- 43.45/100
- National rank
- #3006
- State rank
- #143 of 517 in CA
Livability — Cazadero
- Score
- 58/100
- State rank
- #722
- US rank
- #21405
Category grades
Schools grade is shown separately in the Schools card above.
Census & demographics
- Population (ZIP)
- 1,453
Population outlook (Sonoma County) Hauer SSP2
- Today (2025)
- 539,935 people
- By 2030
- 554,870 · +2.8%
- By 2040
- 573,262 · +6.2%
- By 2050
- 580,715 · +7.6%
- By 2075
- 579,229 · +7.3%
- By 2100
- 547,835 · +1.5%
Race, ethnicity, and origin ACS 2023
- Neighborhood character
- Predominantly White (84%)
- Race & ethnicity
- White 84% Two or more races 9% Hispanic / Latino 8% Asian 4%
- Hispanic origin (detail)
- Mexican 6%
- Common ancestry
- Slovak 7% Scotch-Irish 5% Italian 4%
- Foreign-born
- 14% · Canada, South Korea
- Languages at home
- 82% English-only · Spanish 8% Russian/Polish/Slavic 3% German/W. Germanic 2%
Political lean MEDSL · Sonoma
- 2024 margin
- Solid D (+46.2) · D 71.4% · R 25.2% · Other 3.3%
- 2008→2024 swing
- -3.4pp toward R · 2008: 49.6pp · 2024: 46.2pp
- All cycles
- 2024: D+46.2 2020: D+51.5 2016: D+47.9 2012: D+44.9 2008: D+49.6
Not yet ingested
- Civics
- —
Market trends
- HPI YoY
- ▼ -86.86%
- Current HPI
- 277.5282
- Rent YoY
- —
- Metro
- —
- State GDP YoY
- ▲ 3.21%
- F500 in state
- 116
Industry mix (Fortune 500 HQ in CA)
| Industry | F500 HQs | Revenue |
|---|---|---|
| Technology | 27 | $1,492B |
|
||
| Financial Services | 3 | $174B |
|
||
| Retail | 3 | $44B |
|
||
| Insurance | 3 | $26B |
|
||
| Media / Entertainment | 2 | $115B |
|
||
| Pharmaceuticals / Biotech | 2 | $62B |
|
||
Price history
+404.2% since first listed14 events — show timeline
- 2026-06-08 Listed $179,000 BAREIS
- 2014-11-21 Sold (Public Records) $91,000 Public Records
- 2014-11-21 Sold (MLS) $91,000 BAREIS
- 2014-11-02 Pending — BAREIS
- 2014-10-31 Delisted — BAREIS
- 2014-10-09 Listed $95,000 BAREIS
- 2012-12-31 Sold (Public Records) $139,000 Public Records
- 2012-12-31 Sold (MLS) $139,000 BAREIS
- 2012-12-08 Pending — BAREIS
- 2012-08-13 Price Changed $139,000 BAREIS
- 2012-07-18 Price Changed $145,000 BAREIS
- 2012-06-25 Listed $159,000 BAREIS
- 1995-10-16 Sold (Public Records) $57,500 Public Records
- 1990-11-28 Sold (Public Records) $35,500 Public Records
Property tax history
+2.1%/yrLatest (2025): $1,191 · +1.5% YoY. Source: county tax records.
Cash-flow waterfall
monthlySold comps — $/sqft
last 12 mo · ≤1 miLoading sold comps…