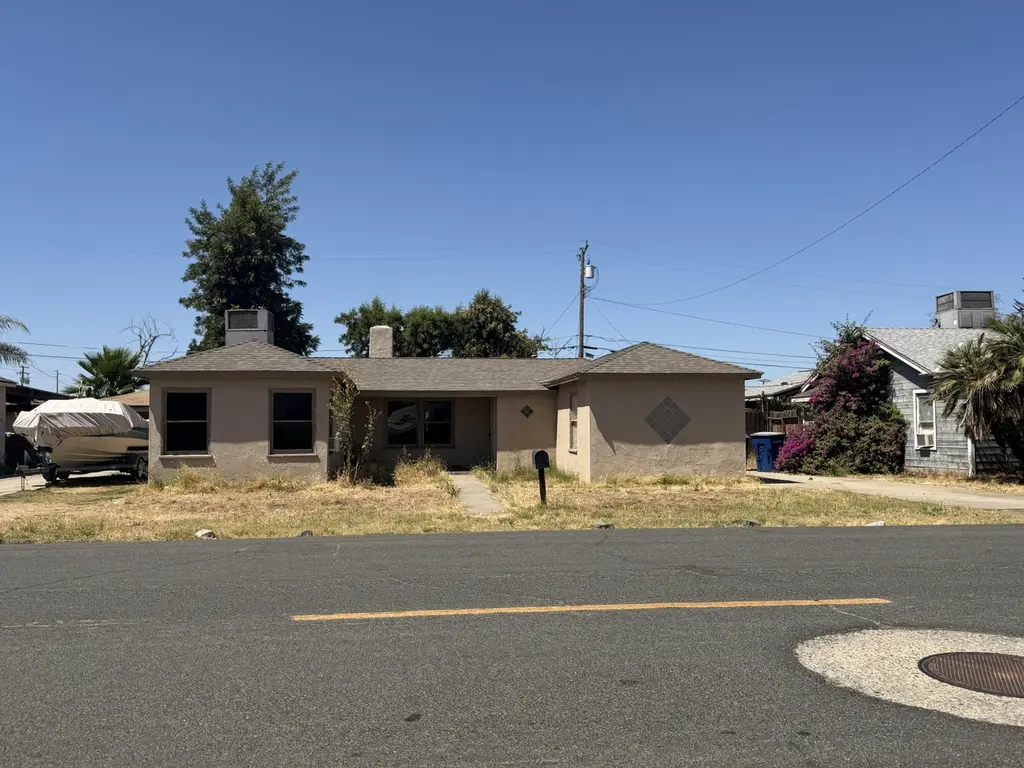
710 E Elm St · Hanford, CA
Flood risk 1/10 · Minimal
- FEMA flood zone
- X (unshaded)
- Chance of flooding over 30 yrs
- 0.0%
- Est. flood insurance / yr
- $507 – $1,088
Fire risk 5/10 · Moderate
- Est. fire insurance / yr
- $659 – $1,223
Heat risk 8/10 · Major
- Hot days now (above 105°F)
- 7 days/yr
- Hot days in 30 yrs
- 17 days/yr
Wind risk 1/10 · Minimal
- Chance of severe wind over 30 yrs
- —
Air-quality risk 10/10 · Severe
- Unhealthy air days now
- 49 days/yr
- Unhealthy air days in 30 yrs
- 50 days/yr
Risk factors via First Street. Map © Google.
Why this score? — see what drove the B- grade
The composite is a weighted blend of 9 inputs, each scored 0–100. Each bar is that input's sub-score; the figure is the points it added to the 100-point composite (weight × sub-score).
- Cash flow +26.4/30.0
- ARV discount +15.0/15.0
- DSCR +9.0/10.0
- 1% rule +6.5/10.0
- Livability +3.8/5.0
- Schools +3.6/10.0
- Rent growth +3.2/5.0
- Condition / age +2.5/5.0
- Appreciation +0.0/10.0
$175,000
🖨 Deal sheet 📄 Offer letter ✓ Due diligence
Listing remarks MLS
Traditional sale! Charming 3 bedroom 1 bath home. Move in READY & nicely updated throughout! Beautiful wood laminate flooring in the living room, kitchen & dining room as well as fresh paint in the entire home. Kitchen has beautiful granite counters & a new cooktop as well as a built in oven & dishwasher. Isolated front bedroom could also work as a home office or additional living space. New carpet in the bedrooms. Bathroom features new plank tile flooring, new tile shower/tub & a new vanity. Indoor laundry & a detached garage with an extra long driveway for extra parking.
Key facts
- Generous lot
- Outdoor space
- Significant grounds
Tags
Property features AI
Finance
- Other: Property listed with Tulare County MLS
Exterior
- Parking: Attached garage with 1 car space
- Utilities: Public water; Public sewer; Natural gas available and connected; Electricity connected
- Home design: Single-family residence; One-story
- Exterior features: Shingle roof; Irregular lot shape
Interior
- Bathrooms: 1 full bathroom
- Interior features: Living room fireplace; Central heating; Central air conditioning
Neighborhood map
What this means for you Summary
Snapshot
- This is a 3-bed/1.0-bath single-family listed at $175k.
Deal economics
- At list price, monthly cash flow is $460 ($6k/yr) — positive.
- The deal already cash-flows at list — no discount required.
- Meets the 1% rule at list price ($2k rent vs $175k).
- Cap rate 9.4% vs local median 3.9% in Hanford — top-decile yield for the area; either an underpriced asset or a hidden risk that comps aren't pricing in. Stress-test before assuming the spread holds.
Location & tenants
- Location reads 75/100 on livability (#121 in CA, #4,255 nationally) — a middle-class / working-renter tenant base. Strengths: commute A+, housing A+, amenities B; Watch: crime D+, health & safety D+, cost of living F.
- Hanford Joint Union High (urban): math 20% / reading 58% proficiency, ranked #765 of 1,400 in CA (top 55%) — families likely to look elsewhere, expect single-tenant / working-renter base with shorter leases.
- Market conditions: Rents rising (+2.9%/yr); 430 active listings in the ZIP; 13 comparable units currently listed for rent nearby; rentals leasing fast (median 14d on market — plan ~1-2 weeks tenant-placement turnaround); solid renter incomes; 741 units permitted in Kings County in 2024 (307 in 5+ unit buildings).
- This rent runs 32% of the median local income ($76k/yr) — at the standard rent-burdened threshold; future hikes will face affordability resistance.
Forward outlook
- Local home prices are declining (-3.0%/yr); year-one equity from $1k of loan paydown is wiped out by about $5k of value loss. Plan a longer hold.
- At projected returns (-3.0% appreciation + 2.9% rent growth), your $49k cash investment doubles in ~10 years — after that, you're playing with house money.
Negotiation context
- Only 1 days on market — expect competitive offers; lowballing is unlikely to land.
- 3 sale attempts since 12y ago with the ask held roughly flat each time — persistent listings suggest the price (not the market) is what's stuck; bring a comps-based counter.
- Current owner paid $124k; 41% above their basis — modest negotiation headroom, anchor on the comps not their cost.
Risks & watch-outs
- Watch-outs: built in 1947 — expect roof / HVAC / electrical / plumbing capex.
- Climate carrying-cost: moderate wildfire risk; extreme-heat days projected 7→17/yr by 2055 (HVAC capex compounding) — expect insurance premiums to compound above CPI over the hold.
Questions for the listing agent
- Built in 1947 — when were the roof, HVAC, electrical panel, plumbing, and water heater last replaced?
- Is there a deadline driving the sale (1031 exchange, divorce, estate, relocation)? That informs how much negotiation room exists.
- Crime grade is D in this area — have there been break-ins, vandalism, or insurance claims at this property in the last 3 years? What carrier currently insures it and at what premium?
- What's the average days-on-market for RENTAL listings here right now (not sales)? A rising rental-DOM trend means longer vacancies and softer asking-rent achievability than the comps imply.
- What's the recent tenant-quality profile in this submarket — average credit score on applications, eviction rate, late-payment / NSF rate, and stable-employment percentage? A property-management company in the area should have these aggregated.
- How much new for-sale + rental construction is in the pipeline within 1–3 miles? Heavy new supply typically softens prices + rents 12–24 months out; constrained supply supports both.
Investment metrics
- 1% rule
- 1.15% ✓
- Cap rate
- 9.45%
- Cash-on-cash
- 11.27%
- DSCR
- 1.50
- GRM
- 7.3
CMA / ARV
- ARV (on-the-fly)
- $311,688
- Comps found
- 12
Show comp detail 12 sales within ~0.75 mi
| Address | Dist | Beds/Ba | Sqft | Sold | Price | $/sf | Match |
|---|---|---|---|---|---|---|---|
| 813 E Florinda St | 0.09mi | 3/2.0 | 1,275 (-4%) | 4mo | $285,000 | $224 | 82 |
| 803 Gladys Way | 0.16mi | 3/2.0 | 1,272 (-4%) | 2mo | $320,000 | $252 | 79 |
| 1313 N East St | 0.41mi | 3/1.0 | 1,260 (-5%) | 8mo | $292,000 | $232 | 65 |
| 1236 N Brown St | 0.52mi | 3/1.0 | 1,366 (+3%) | 8mo | $305,000 | $223 | 65 |
| 1004 E Myrtle St | 0.34mi | 3/2.0 | 1,225 (-8%) | 5mo | $300,000 | $245 | 63 |
| 1175 Levich Cir | 0.71mi | 3/2.0 | 1,318 (-1%) | 0mo | $305,000 | $231 | 61 |
| 1395 N Alta Way | 0.48mi | 3/2.0 | 1,217 (-9%) | 2mo | $231,000 | $190 | 57 |
| 427 E 9th St | 0.43mi | 3/1.0 | 1,197 (-10%) | 8mo | $215,000 | $180 | 56 |
| 1326 Elm Ct | 0.60mi | 3/2.0 | 1,233 (-7%) | 2mo | $360,000 | $292 | 54 |
| 1133 Summer Fld | 0.62mi | 3/2.0 | 1,233 (-7%) | 4mo | $350,000 | $284 | 51 |
| 1326 N Normandie | 0.48mi | 2/1.5 (-1) | 1,220 (-8%) | 6mo | $285,000 | $234 | 51 |
| 1205 Hawthorn St | 0.63mi | 3/2.0 | 1,176 (-12%) | 2mo | $330,000 | $281 | 46 |
Match score weights: distance 35% · size 25% · config 20% · recency 20%. Top-matched comps best support the ARV.
Projected returns pro-forma
-3.0% appreciation · 2.87% rent growth · sell at horizon
- IRR
- 0.4%
- Equity multiple
- 1.01×
- Total profit
- $658
- Equity at exit
- $26,093
- IRR
- 9.9%
- Equity multiple
- 1.76×
- Total profit
- $37,143
- Equity at exit
- $15,131
Cash invested: $49,000 (down + closing). Projections, not guarantees.
Landlord ↔ Tenant lean methodology
- Overall (STATE)
- 18 Strongly Tenant-Friendly
- State California
- 18 Strongly Tenant-Friendly · D+13
- County
- — inherits STATE
- City
- — inherits STATE
ZIP-level market 93230
- Rents YoY
- 2.9%
- Active inventory
- 430
- Price-to-rent
- 7.3×
Monthly cashflow live
- Estimated rent
- $2,009 high interval (Pro) →
- Mortgage (P&I)
- −$918
- Tax from tax record
- −$137 /mo · $1,640/yr
- Insurance
- −$73
- HOA
- −$0
- Vacancy / Maint / Mgmt
- −$422
- Net cashflow
- $460
Break-even live
UW: 25.0% down · 7.5% · 30yr · 1.5% tax · 5.0% vac · 8.0% maint · 8.0% mgmt
Financing live
Cash to close
- Down payment
- $43,750
- Closing costs
- $5,250
- Reserves months
- —
- Total cash needed
- —
Loan-product check · same deal, 3 products live
Conventional
25% down · 7.5% · 30yr
- Down + closing
- —
- Monthly P&I
- —
- Monthly cashflow
- —
- DSCR
- —
- Eligible?
- —
Personal DTI + credit; lowest rate.
DSCR
20% down · 8.5% · 30yr
- Down + closing
- —
- Monthly P&I
- —
- Monthly cashflow
- —
- DSCR
- —
- Eligible?
- —
No personal income docs; deal must DSCR.
Hard money
10% down · 12.0% · 12mo
- Down + closing
- —
- Monthly P&I
- —
- Monthly cashflow
- —
- DSCR
- —
- Eligible?
- —
Short-term bridge; refi at stabilization.
Rent comps 13 comps
| Address | Beds | Baths | Sqft | Rent | $/sqft | DOM | Units | Dist |
|---|---|---|---|---|---|---|---|---|
| 1373 Van Ct Hanford, CA | 3.0 | 2.0 | 1236 | $1,900 | $1.54 | 21d | 1 | 0.69mi |
| 345 Hanford, CA | 3.0 | 2.0 | 1509 | $2,400 | $1.59 | 13d | 1 | 0.70mi |
| SAND CYN Outside Area (Inside Ca), CA | 2.0–3.0 | 2.0 | 949 | $2,809 | $2.96 | 13d | 3 | 0.76mi |
| 1823 N 10th Ave Unit 1819 Hanford, CA | 2.0 | 1.0 | 900 | $1,450 | $1.61 | 13d | 1 | 0.81mi |
| 1819 N 10th Ave Hanford, CA | 2.0 | 1.0 | 900 | $1,450 | $1.61 | 13d | 1 | 0.81mi |
| 10480 9 1/2 Ave Unit B Hanford, CA | 3.0 | 2.0 | 1800 | $1,995 | $1.11 | 21d | 1 | 1.05mi |
| 140 W Terrace Dr Hanford, CA | 2.0 | 2.0 | 1664 | $1,995 | $1.20 | 21d | 1 | 1.09mi |
| 630 Neville St Hanford, CA | 2.0 | 1.0 | 1399 | $1,550 | $1.11 | 21d | 1 | 1.16mi |
| 2144 Beechwood Ct Hanford, CA | 3.0 | 2.0 | 1466 | $1,950 | $1.33 | 13d | 1 | 1.16mi |
| 1920 N 11th Ave Hanford, CA | 3.0 | 2.0 | 1500 | $1,650 | $1.10 | 21d | 1 | 1.39mi |
| 994 S Harris St Hanford, CA | 3.0 | 2.0 | 1278 | $1,650 | $1.29 | 13d | 1 | 1.44mi |
| 2337 N 10th Ave Hanford, CA | 3.0 | 2.0 | 1248 | $1,795 | $1.44 | 13d | 1 | 1.44mi |
| 2403 Cherrywood Ct Hanford, CA | 4.0 | 2.0 | 1311 | $2,450 | $1.87 | 13d | 1 | 1.48mi |
Listing history 2 events
-
2026-06-09remarks 511-char remark
-
2026-06-09$175,000 Pending 1 DOM
ⓘ Source: listings_history table (triggers on properties + properties_extension) + one-shot
backfill from property_details.listing_events for pre-trigger history.
Tax reassessment forecast CA · Resets to sale price
- Current annual tax
- $1,640 · $137/mo
- Projected year-2 tax
- $1,640 · $137/mo
- Expected delta
- $0/yr ($0/mo · 0.0%)
ⓘ Screening estimate from a state-policy table — verify with the county assessor before closing.
Climate risk First Street
- Flood 1/10 Low FEMA zone X (unshaded) · 0% chance over 30 yrs
- Wildfire 5/10 Major
- Heat 8/10 Severe 7 d/yr ≥105°F today · 17 d/yr by 30 yrs out
- Wind 1/10 Low
- Air quality 10/10 Extreme 49 unhealthy d/yr today · 50 by 30 yrs out
Nearby sold comps map
Loading sold comps map…
Walkable amenities ~0.75 mi
Loading nearby amenities…
Taxation est. · year 1
- Rental income
- $24,111
- − Mortgage interest
- −$9,803
- − Property taxes
- −$1,640
- − Insurance
- −$875
- − Repairs & maintenance
- −$1,929
- − Management
- −$1,929
- − Depreciation
- −$5,091
- Taxable income
- $2,845
- Est. tax owed @ 24.0%
- −$683
- After-tax cash flow
- $4,837/yr
For passive investors: Depreciation is non-cash, so a rental often shows a tax loss while cash-flowing — sheltering income. Rental losses are passive: they offset passive income freely, and up to $25,000/yr can offset ordinary (W-2) income if you actively participate and your MAGI is under $100k (phasing out to $0 by $150k); unused losses carry forward. On sale, claimed depreciation is recaptured at up to 25%, and gains may owe capital-gains tax (a 1031 exchange can defer both). Figures are a year-1 estimate at your 24.0% rate — not tax advice; consult a CPA.
Schools (NCES district)
- District
- Hanford Joint Union High
- NCES district ID
- 0616500
- Math proficiency
- 20% ▲ 1.00%
- Reading proficiency
- 58% ▬ 0.00%
- Median HH income
- $47,265
- Composite
- 35.8/100
- National rank
- #9626
- State rank
- #765 of 1400 in CA
Livability — Hanford
- Score
- 75/100
- State rank
- #121
- US rank
- #4255
Category grades
Schools grade is shown separately in the Schools card above.
Census & demographics
- County
- Kings County · 107,655 people
- City population
- 69,684
- Metro
- Hanford-Corcoran, CA
- Population (ZIP)
- 69,684
- Household income
- $76,023
- Rent vs Own
- Severe rent burden
- 2081.0
Population outlook (Kings County) Hauer SSP2
- Today (2025)
- 147,136 people
- By 2030
- 145,623 · -1.0%
- By 2040
- 146,017 · -0.8%
- By 2050
- 145,239 · -1.3%
- By 2075
- 131,479 · -10.6%
- By 2100
- 103,967 · -29.3%
Race, ethnicity, and origin ACS 2023
- Neighborhood character
- Diverse neighborhood (Simpson 0.60)
- Race & ethnicity
- Hispanic / Latino 52% White 35% Two or more races 19% Black 5% Asian 3% Native American 2%
- Hispanic origin (detail)
- Mexican 49%
- Common ancestry
- Russian 6% Italian 2% Lithuanian 1%
- Foreign-born
- 17% · Canada
- Languages at home
- 65% English-only · Spanish 31% Other Indo-European 2% Tagalog/Filipino 2%
Political lean MEDSL · Kings
- 2024 margin
- Strong R (+23.0) · D 37.4% · R 60.4% · Other 2.2%
- 2008→2024 swing
- -8.9pp toward R · 2008: -14.1pp · 2024: -23.0pp
- All cycles
- 2024: R+23.0 2020: R+12.2 2016: R+14.1 2012: R+16.3 2008: R+14.1
Not yet ingested
- Civics
- —
Market trends
- HPI YoY
- ▼ -267.79%
- Current HPI
- 321.3409
- Rent YoY
- ▲ 2.87%
- Metro
- Hanford-Corcoran, CA
- State GDP YoY
- ▲ 3.21%
- F500 in state
- 116
Industry mix (Fortune 500 HQ in CA)
| Industry | F500 HQs | Revenue |
|---|---|---|
| Technology | 27 | $1,492B |
|
||
| Financial Services | 3 | $174B |
|
||
| Retail | 3 | $44B |
|
||
| Insurance | 3 | $26B |
|
||
| Media / Entertainment | 2 | $115B |
|
||
| Pharmaceuticals / Biotech | 2 | $62B |
|
||
Price history
+150.0% since first listed9 events — show timeline
- 2026-06-08 Pending — TCMLS
- 2026-05-23 Listed $175,000 TCMLS
- 2015-02-05 Sold (Public Records) $124,100 Public Records
- 2015-02-05 Sold (MLS) $124,000 KCBOR
- 2015-02-05 Sold (MLS) $124,000 FRESNOMLS
- 2014-10-19 Listed $119,900 KCBOR
- 2014-10-19 Listed $119,900 FRESNOMLS
- 2014-09-05 Sold (Public Records) $55,000 Public Records
- 1992-03-26 Sold (Public Records) $70,000 Public Records
Property tax history
+2.7%/yrLatest (2025): $1,640 · +3.7% YoY. Source: county tax records.
Cash-flow waterfall
monthlySold comps — $/sqft
last 12 mo · ≤1 miLoading sold comps…