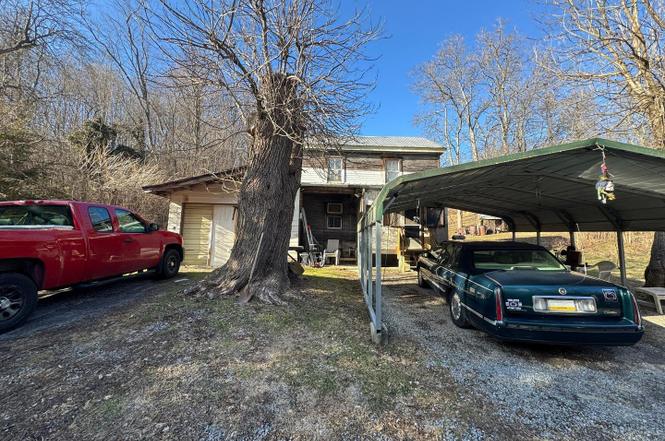
212 Benton Rd · East Freedom, PA
Flood risk 9/10 · Severe
- FEMA flood zone
- X (unshaded)
- Chance of flooding over 30 yrs
- 0.99%
- Est. flood insurance / yr
- $507 – $1,088
Fire risk 4/10 · Minor
- Est. fire insurance / yr
- $511 – $949
Heat risk 3/10 · Minor
- Hot days now (above 95°F)
- 7 days/yr
- Hot days in 30 yrs
- 17 days/yr
Wind risk 2/10 · Minimal
- Chance of severe wind over 30 yrs
- —
Air-quality risk 2/10 · Minimal
- Unhealthy air days now
- 1 days/yr
- Unhealthy air days in 30 yrs
- 3 days/yr
Risk factors via First Street. Map © Google.
Why this score? — see what drove the C grade
The composite is a weighted blend of 9 inputs, each scored 0–100. Each bar is that input's sub-score; the figure is the points it added to the 100-point composite (weight × sub-score).
- Cash flow +25.6/30.0
- DSCR +8.5/10.0
- 1% rule +7.3/10.0
- Appreciation +7.0/10.0
- Schools +3.5/10.0
- Livability +3.2/5.0
- Rent growth +2.5/5.0
- Condition / age +2.5/5.0
- ARV discount +0.0/15.0
$80,000
🖨 Deal sheet (PDF) 📄 Offer letter ✓ Due diligence
Listing remarks
Property located in over 7 acres of land!! Great property with plenty of potential and ready for your personal touch! This home is perfect for those eager to apply some TLC and creative vision to make it truly shine. Ideal for a Family looking to craft their dream space to create many lasting memories! Don’t miss this chance to transform a gem into your masterpiece!
Key facts
- Over 7 acres of land
- 7.33 acre lot
- Garage
Tags
Neighborhood map
What this means for you Summary
Snapshot
- This is a 2-bed/1.0-bath single-family listed at $80k.
Deal economics
- At list price, monthly cash flow is $122 ($1k/yr) — positive.
- The deal already cash-flows at list — no discount required.
- Meets the 1% rule at list price ($980 rent vs $80k).
Location & tenants
- Location reads 63/100 on livability (#1,282 in PA) — a middle-class / working-renter tenant base. Strengths: employment A+, cost of living A+; Watch: amenities F, commute F, health & safety F.
- Spring Cove SD (town): math 31% / reading 51% proficiency, ranked #344 of 539 in PA (top 64%) — families likely to look elsewhere, expect single-tenant / working-renter base with shorter leases.
- Zoned schools: Martinsburg El Sch (math 38% / reading 50%, grade F, #858 of 1,518 statewide, top 57%, 366 students, 51% FRL); Spring Cove Ms (math 17% / reading 52%, grade F, #328 of 512 statewide, top 65%, 376 students, 52% FRL); Central Hs (math 57%, 554 students, 35% FRL).
- Market conditions: 12 active listings in the ZIP; 99 units permitted in Blair County in 2024 (0 in 5+ unit buildings).
Forward outlook
- In year one you build about $4k of equity ($553 loan paydown + $3k appreciation (4.0% local appreciation)).
- Blair County population projected at -18% by 2050 — secular population decline; favor cash flow + early exit over multi-decade hold.
- At projected returns (4.0% appreciation + 3.0% rent growth), your $22k cash investment doubles in ~4 years — after that, you're playing with house money.
- By year 9, paydown + projected appreciation supports a ~$33k cash-out refi (75% LTV) — recoverable capital for the next deal without selling this one.
Negotiation context
- Only 8 days on market — expect competitive offers; lowballing is unlikely to land.
Risks & watch-outs
- Watch-outs: flood insurance adds $66/mo.
- Climate carrying-cost: severe flood risk — expect insurance premiums to compound above CPI over the hold.
Questions for the listing agent
- What's the actual annual flood-insurance premium (NFIP or private), and is the property in a SFHA with mandatory coverage?
- Is there a deadline driving the sale (1031 exchange, divorce, estate, relocation)? That informs how much negotiation room exists.
- Schools are D-rated, which usually means shorter tenancies and higher turnover. Who's the typical renter profile here, and what's been the actual vacancy rate?
- What's the average days-on-market for RENTAL listings here right now (not sales)? A rising rental-DOM trend means longer vacancies and softer asking-rent achievability than the comps imply.
- What's the recent tenant-quality profile in this submarket — average credit score on applications, eviction rate, late-payment / NSF rate, and stable-employment percentage? A property-management company in the area should have these aggregated.
- How much new for-sale + rental construction is in the pipeline within 1–3 miles? Heavy new supply typically softens prices + rents 12–24 months out; constrained supply supports both.
Investment metrics
- 1% rule
- 1.23% ✓
- Cap rate
- 9.12%
- Cash-on-cash
- 10.08%
- DSCR
- 1.45
- GRM
- 6.8
CMA / ARV
- ARV (on-the-fly)
- $60,720
- Comps found
- 1
Show comp detail 1 sale within ~0.75 mi
| Address | Dist | Beds/Ba | Sqft | Sold | Price | $/sf | Match |
|---|---|---|---|---|---|---|---|
| 118 Artist Ln | 0.45mi | 2/1.0 | 793 (-10%) | 12mo | $55,000 | $69 | 52 |
Match score weights: distance 35% · size 25% · config 20% · recency 20%. Top-matched comps best support the ARV.
Projected returns pro-forma
4.04% appreciation · 3.0% rent growth · sell at horizon
- IRR
- 16.2%
- Equity multiple
- 1.98×
- Total profit
- $21,962
- Equity at exit
- $40,753
- IRR
- 17.2%
- Equity multiple
- 3.77×
- Total profit
- $62,122
- Equity at exit
- $66,808
Cash invested: $22,400 (down + closing). Projections, not guarantees.
Landlord ↔ Tenant lean methodology
- Overall (STATE)
- 62 Landlord-Friendly
- State Pennsylvania
- 62 Landlord-Friendly · EVEN
- County
- — inherits STATE
- City
- — inherits STATE
ZIP-level market 16637
- Home prices YoY
- 3.6%
- Active inventory
- 12
- Price-to-rent
- 6.8×
Monthly cashflow live
- Estimated rent
- $980 medium interval (Pro) →
- Mortgage (P&I)
- −$420
- Tax from tax record
- −$134 /mo · $1,602/yr
- Insurance
- −$33
- Flood insurance flood zone
- −$66 /mo · $798/yr
- HOA
- −$0
- Vacancy / Maint / Mgmt
- −$206
- Net cashflow
- $122
Break-even live
Sensitivity live
| Price | -10% $167 | -5% $144 | +0% $122 | +5% $99 | +10% $76 |
|---|---|---|---|---|---|
| Rent | -10% $44 | -5% $83 | +0% $122 | +5% $160 | +10% $199 |
| Rate | -1.0pp $162 | -0.5pp $142 | base $122 | +0.5pp $101 | +1.0pp $80 |
UW: 25.0% down · 7.5% · 30yr · 1.5% tax · 5.0% vac · 8.0% maint · 8.0% mgmt
Financing live
Cash to close
- Down payment
- $20,000
- Closing costs
- $2,400
- Reserves months
- —
- Total cash needed
- —
Loan-product check · same deal, 3 products live
Conventional
25% down · 7.5% · 30yr
- Down + closing
- —
- Monthly P&I
- —
- Monthly cashflow
- —
- DSCR
- —
- Eligible?
- —
Personal DTI + credit; lowest rate.
DSCR
20% down · 8.5% · 30yr
- Down + closing
- —
- Monthly P&I
- —
- Monthly cashflow
- —
- DSCR
- —
- Eligible?
- —
No personal income docs; deal must DSCR.
Hard money
10% down · 12.0% · 12mo
- Down + closing
- —
- Monthly P&I
- —
- Monthly cashflow
- —
- DSCR
- —
- Eligible?
- —
Short-term bridge; refi at stabilization.
Listing history 2 events
-
2026-03-17status Pending
-
2026-03-09$80,000 Active
ⓘ Source: listings_history table (triggers on properties + properties_extension) + one-shot
backfill from property_details.listing_events for pre-trigger history.
Tax reassessment forecast PA · Partial reset (capped growth)
- Current annual tax
- $1,602 · $134/mo
- Projected year-2 tax
- $1,602 · $134/mo
- Expected delta
- $0/yr ($0/mo · 0.0%)
ⓘ Screening estimate from a state-policy table — verify with the county assessor before closing.
Climate risk First Street
- Flood 9/10 Extreme FEMA zone X (unshaded) · 99% chance over 30 yrs
- Wildfire 4/10 Moderate
- Heat 3/10 Moderate 7 d/yr ≥95°F today · 17 d/yr by 30 yrs out
- Wind 2/10 Low
- Air quality 2/10 Low 1 unhealthy d/yr today · 3 by 30 yrs out
Nearby sold comps map
Loading sold comps map…
Walkable amenities ~0.75 mi
Loading nearby amenities…
Taxation est. · year 1
- Rental income
- $11,766
- − Mortgage interest
- −$4,481
- − Property taxes
- −$1,602
- − Insurance
- −$1,198
- − Repairs & maintenance
- −$941
- − Management
- −$941
- − Depreciation
- −$2,327
- Taxable income
- $275
- Est. tax owed @ 24.0%
- −$66
- After-tax cash flow
- $1,395/yr
For passive investors: Depreciation is non-cash, so a rental often shows a tax loss while cash-flowing — sheltering income. Rental losses are passive: they offset passive income freely, and up to $25,000/yr can offset ordinary (W-2) income if you actively participate and your MAGI is under $100k (phasing out to $0 by $150k); unused losses carry forward. On sale, claimed depreciation is recaptured at up to 25%, and gains may owe capital-gains tax (a 1031 exchange can defer both). Figures are a year-1 estimate at your 24.0% rate — not tax advice; consult a CPA.
Schools (NCES district)
- District
- Spring Cove SD
- NCES district ID
- 4222530
- Math proficiency
- 31% ▼ -9.00%
- Reading proficiency
- 51% ▼ -10.00%
- Median HH income
- $46,105
- Composite
- 34.88/100
- National rank
- #5083
- State rank
- #344 of 539 in PA
Livability — East Freedom
- Score
- 63/100
- State rank
- #1282
- US rank
- #15578
Category grades
Schools grade is shown separately in the Schools card above.
Census & demographics
- Population (ZIP)
- 2,236
Population outlook (Blair County) Hauer SSP2
- Today (2025)
- 121,571 people
- By 2030
- 117,966 · -3.0%
- By 2040
- 109,174 · -10.2%
- By 2050
- 99,542 · -18.1%
- By 2075
- 76,775 · -36.8%
- By 2100
- 54,326 · -55.3%
Race, ethnicity, and origin ACS 2023
- Neighborhood character
- Predominantly White (97%)
- Race & ethnicity
- White 97% Two or more races 3%
- Common ancestry
- Slovak 2% Iranian 1% Portuguese 1%
- Foreign-born
- 1% · Canada
- Languages at home
- 97% English-only · German/W. Germanic 2% Spanish 1%
Political lean MEDSL · Blair
- 2024 margin
- Solid R (+43.5) · D 27.9% · R 71.4%
- 2008→2024 swing
- -19.2pp toward R · 2008: -24.3pp · 2024: -43.5pp
- All cycles
- 2024: R+43.5 2020: R+43.5 2016: R+46.4 2012: R+33.5 2008: R+24.3
Not yet ingested
- Civics
- —
Market trends
- HPI YoY
- ▲ 4.04%
- Current HPI
- 115.5472
- Rent YoY
- —
- Metro
- —
- State GDP YoY
- ▲ 1.68%
- F500 in state
- 34
Industry mix (Fortune 500 HQ in PA)
| Industry | F500 HQs | Revenue |
|---|---|---|
| Healthcare | 2 | $309B |
|
||
| Insurance | 2 | $27B |
|
||
| Telecommunications / Media | 1 | $124B |
|
||
| Industrial Distribution | 1 | $22B |
|
||
| Financial Services | 1 | $20B |
|
||
| Chemicals / Materials | 1 | $18B |
|
||
Price history
2 events — show timeline
- 2026-03-17 Pending — BRIGHT MLS
- 2026-03-09 Listed $80,000 BRIGHT MLS
Property tax history
-22.3%/yrLatest (2025): $1,602 · +4.6% YoY. Source: county tax records.
Cash-flow waterfall
monthlySold comps — $/sqft
last 12 mo · ≤1 miLoading sold comps…