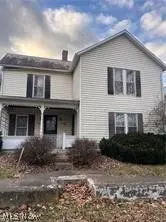
31 Leget St · Waterford, OH
Flood risk 5/10 · Moderate
- FEMA flood zone
- X (unshaded)
- Chance of flooding over 30 yrs
- 0.24%
- Est. flood insurance / yr
- $473 – $860
Fire risk 3/10 · Minor
- Est. fire insurance / yr
- $713 – $1,323
Heat risk 4/10 · Minor
- Hot days now (above 100°F)
- 7 days/yr
- Hot days in 30 yrs
- 18 days/yr
Wind risk 2/10 · Minimal
- Chance of severe wind over 30 yrs
- 1.0%
Air-quality risk 2/10 · Minimal
- Unhealthy air days now
- 0 days/yr
- Unhealthy air days in 30 yrs
- 1 days/yr
Risk factors via First Street. Map © Google.
Why this score? — see what drove the A- grade
The composite is a weighted blend of 9 inputs, each scored 0–100. Each bar is that input's sub-score; the figure is the points it added to the 100-point composite (weight × sub-score).
- Cash flow +30.0/30.0
- 1% rule +10.0/10.0
- DSCR +10.0/10.0
- Appreciation +9.5/10.0
- ARV discount +7.5/15.0
- Schools +4.9/10.0
- Livability +3.6/5.0
- Rent growth +2.5/5.0
- Condition / age +2.5/5.0
$69,900
🖨 Deal sheet (PDF) 📄 Offer letter ✓ Due diligence
Listing remarks
Opportunity awaits with this 2-story home locate in a convenient in-town location. Home needs some TLC giving the next owner the chance to bring their vision to life. Great potential in a small-town setting- don't miss this opportunity!
Key facts
- 5,227 sq ft lot
- Garage
- Built 1900
Property features AI
Exterior
- Parking: Detached garage (1 car)
- Utilities: Public water; Public sewer
- Home design: 2-story house; Condition: Fixer
- Construction: Vinyl siding; Slate roof; Partial basement
- Exterior features: Front porch
Interior
- Kitchen: Kitchen on first level
- Bedrooms: Bedroom on second level; Bedroom on second level
- Flooring: Carpet throughout main rooms and bedrooms
- Bathrooms: One full bathroom (main level)
- Heating & cooling: Forced air heating
- Interior features: Wood-frame windows; Decorative fireplace (1)
Neighborhood map
What this means for you Summary
Snapshot
- This is a 3-bed/1.0-bath single-family listed at $70k.
Deal economics
- At list price, monthly cash flow is $521 ($6k/yr) — positive.
- The deal already cash-flows at list — no discount required.
- Meets the 1% rule at list price ($1k rent vs $70k).
- Recommended offer: $68k (3.0% below list) — sets the bar for market timing.
Location & tenants
- Location reads 71/100 on livability (#433 in OH) — a middle-class / working-renter tenant base. Strengths: cost of living A+, housing A+, employment A; Watch: crime C-, health & safety D, amenities F.
- Wolf Creek Local (rural): math 55% / reading 60% proficiency, ranked #328 of 656 in OH (top 50%) — acceptable for families but not a draw, mixed tenant base, ~2y average lease.
- Zoned schools: Waterford Elementary School (math 57% / reading 59%, grade C+, #714 of 1,584 statewide, top 45%, 414 students, 33% FRL); Waterford High School (math 47% / reading 64%, grade C, #295 of 781 statewide, top 38%, 163 students, 26% FRL) — zoned schools at 29% FRL track the district average.
- Market conditions: 5 active listings in the ZIP; 3 units permitted in Washington County in 2024 (0 in 5+ unit buildings).
Forward outlook
- In year one you build about $7k of equity ($483 loan paydown + $6k appreciation (9.0% local appreciation)).
- Washington County population projected at -12% by 2050 — secular population decline; favor cash flow + early exit over multi-decade hold.
- At projected returns (9.0% appreciation + 3.0% rent growth), your $20k cash investment doubles in ~2 years — after that, you're playing with house money.
- By year 5, paydown + projected appreciation supports a ~$31k cash-out refi (75% LTV) — recoverable capital for the next deal without selling this one.
Negotiation context
- It's been on market 31 days — a 3% lower offer ($68k) is reasonable based on typical stale-listing flexibility.
- 2 sale attempts with the ask held roughly flat each time — persistent listings suggest the price (not the market) is what's stuck; bring a comps-based counter.
Risks & watch-outs
- Watch-outs: built in 1900 — expect roof / HVAC / electrical / plumbing capex.
- Climate carrying-cost: moderate flood risk — expect insurance premiums to compound above CPI over the hold.
Questions for the listing agent
- It's been on market 31 days. Have you received any prior offers? Is the seller open to a 3% concession, seller financing, or rate buy-down credit?
- Built in 1900 — when were the roof, HVAC, electrical panel, plumbing, and water heater last replaced?
- Is there a deadline driving the sale (1031 exchange, divorce, estate, relocation)? That informs how much negotiation room exists.
- Schools are A-rated — typically a magnet for longer-tenancy family renters. What's the average tenant stay here, and is there a school-zone premium baked into asking?
- What's the average days-on-market for RENTAL listings here right now (not sales)? A rising rental-DOM trend means longer vacancies and softer asking-rent achievability than the comps imply.
- What's the recent tenant-quality profile in this submarket — average credit score on applications, eviction rate, late-payment / NSF rate, and stable-employment percentage? A property-management company in the area should have these aggregated.
- How much new for-sale + rental construction is in the pipeline within 1–3 miles? Heavy new supply typically softens prices + rents 12–24 months out; constrained supply supports both.
Investment metrics
- 1% rule
- 1.83% ✓
- Cap rate
- 15.24%
- Cash-on-cash
- 31.95%
- DSCR
- 2.42
- GRM
- 4.6
CMA / ARV
- ARV (median comp)
- $173,296
- List price
- $69,900
- Delta
- -53.89%
- Verdict
- UNDERPRICED
- Comps
- 16 within 1.0 mi
Show comp detail 4 sales within ~0.75 mi
| Address | Dist | Beds/Ba | Sqft | Sold | Price | $/sf | Match |
|---|---|---|---|---|---|---|---|
| 322 and 318 3rd St | 0.41mi | 4/1.0 (+1) | 1,808 (-4%) | 2mo | $205,000 | $113 | 67 |
| 525 Main St | 0.10mi | 3/2.0 | 2,122 (+12%) | 19mo | $37,000 | $17 | 55 |
| 307 Fourth St | 0.45mi | 2/2.0 (-1) | 1,830 (-3%) | 24mo | $193,000 | $105 | 45 |
| 220 Center St | 0.36mi | 2/2.5 (-1) | 1,636 (-13%) | 16mo | $192,500 | $118 | 37 |
Match score weights: distance 35% · size 25% · config 20% · recency 20%. Top-matched comps best support the ARV.
Projected returns pro-forma
9.01% appreciation · 3.0% rent growth · sell at horizon
- IRR
- 47.2%
- Equity multiple
- 4.40×
- Total profit
- $66,601
- Equity at exit
- $57,989
- IRR
- 41.7%
- Equity multiple
- 9.64×
- Total profit
- $169,113
- Equity at exit
- $120,106
Cash invested: $19,572 (down + closing). Projections, not guarantees.
Landlord ↔ Tenant lean methodology
- Overall (STATE)
- 73 Landlord-Friendly
- State Ohio
- 73 Landlord-Friendly · R+6
- County
- — inherits STATE
- City
- — inherits STATE
ZIP-level market 45786
- Home prices YoY
- 3.6%
- Active inventory
- 5
- Price-to-rent
- 4.6×
Monthly cashflow live
- Estimated rent
- $1,279 medium interval (Pro) →
- Mortgage (P&I)
- −$367
- Tax from tax record
- −$94 /mo · $1,125/yr
- Insurance
- −$29
- HOA
- −$0
- Vacancy / Maint / Mgmt
- −$269
- Net cashflow
- $521
Break-even live
Sensitivity live
| Price | -10% $561 | -5% $541 | +0% $521 | +5% $501 | +10% $482 |
|---|---|---|---|---|---|
| Rent | -10% $420 | -5% $471 | +0% $521 | +5% $572 | +10% $622 |
| Rate | -1.0pp $556 | -0.5pp $539 | base $521 | +0.5pp $503 | +1.0pp $485 |
UW: 25.0% down · 7.5% · 30yr · 1.5% tax · 5.0% vac · 8.0% maint · 8.0% mgmt
Financing live
Cash to close
- Down payment
- $17,475
- Closing costs
- $2,097
- Reserves months
- —
- Total cash needed
- —
Loan-product check · same deal, 3 products live
Conventional
25% down · 7.5% · 30yr
- Down + closing
- —
- Monthly P&I
- —
- Monthly cashflow
- —
- DSCR
- —
- Eligible?
- —
Personal DTI + credit; lowest rate.
DSCR
20% down · 8.5% · 30yr
- Down + closing
- —
- Monthly P&I
- —
- Monthly cashflow
- —
- DSCR
- —
- Eligible?
- —
No personal income docs; deal must DSCR.
Hard money
10% down · 12.0% · 12mo
- Down + closing
- —
- Monthly P&I
- —
- Monthly cashflow
- —
- DSCR
- —
- Eligible?
- —
Short-term bridge; refi at stabilization.
Listing history 18 events
-
2026-06-21days on market $69,900 Active 31 DOM
-
2026-06-21days on market $69,900 Active 30 DOM
-
2026-06-18days on market $69,900 Active 28 DOM
-
2026-06-17days on market $69,900 Active 27 DOM
-
2026-06-16days on market $69,900 Active 26 DOM
-
2026-06-15days on market $69,900 Active 25 DOM
-
2026-06-13days on market $69,900 Active 23 DOM
-
2026-06-12days on market $69,900 Active 22 DOM
-
2026-06-09days on market $69,900 Active 19 DOM
-
2026-06-08days on market $69,900 Active 18 DOM
-
2026-06-08days on market $69,900 Active 17 DOM
-
2026-06-05days on market $69,900 Active 15 DOM
-
2026-06-04days on market $69,900 Active 13 DOM
-
2026-06-02days on market $69,900 Active 12 DOM
-
2026-06-01days on market $69,900 Active 11 DOM
-
2026-05-31days on market $69,900 Active 10 DOM
-
2026-05-12historical
-
2025-12-11$79,900 Active
ⓘ Source: listings_history table (triggers on properties + properties_extension) + one-shot
backfill from property_details.listing_events for pre-trigger history.
Tax reassessment forecast OH · Partial reset (capped growth)
- Current annual tax
- $1,125 · $94/mo
- Projected year-2 tax
- $1,125 · $94/mo
- Expected delta
- $0/yr ($0/mo · 0.0%)
ⓘ Screening estimate from a state-policy table — verify with the county assessor before closing.
Climate risk First Street
- Flood 5/10 Major FEMA zone X (unshaded) · 24% chance over 30 yrs
- Wildfire 3/10 Moderate
- Heat 4/10 Moderate 7 d/yr ≥100°F today · 18 d/yr by 30 yrs out
- Wind 2/10 Low 100% chance of damaging wind over 30 yrs
- Air quality 2/10 Low 0 unhealthy d/yr today · 1 by 30 yrs out
Nearby sold comps map
Loading sold comps map…
Walkable amenities ~0.75 mi
Loading nearby amenities…
Taxation est. · year 1
- Rental income
- $15,351
- − Mortgage interest
- −$3,915
- − Property taxes
- −$1,125
- − Insurance
- −$350
- − Repairs & maintenance
- −$1,228
- − Management
- −$1,228
- − Depreciation
- −$2,033
- Taxable income
- $5,471
- Est. tax owed @ 24.0%
- −$1,313
- After-tax cash flow
- $4,941/yr
For passive investors: Depreciation is non-cash, so a rental often shows a tax loss while cash-flowing — sheltering income. Rental losses are passive: they offset passive income freely, and up to $25,000/yr can offset ordinary (W-2) income if you actively participate and your MAGI is under $100k (phasing out to $0 by $150k); unused losses carry forward. On sale, claimed depreciation is recaptured at up to 25%, and gains may owe capital-gains tax (a 1031 exchange can defer both). Figures are a year-1 estimate at your 24.0% rate — not tax advice; consult a CPA.
Schools (NCES district)
- District
- Wolf Creek Local
- NCES district ID
- 3905051
- Math proficiency
- 55% ▼ -15.00%
- Reading proficiency
- 60% ▼ -9.00%
- Median HH income
- $50,626
- Composite
- 49.05/100
- National rank
- #2059
- State rank
- #328 of 656 in OH
Livability — Waterford
- Score
- 71/100
- State rank
- #433
- US rank
- #7143
Category grades
Schools grade is shown separately in the Schools card above.
Census & demographics
- Census place
- Waterford, OH
- County
- Washington · 57,253 people
- Population (ZIP)
- 3,019
- Household income
- $61,295
- Rent vs Own
Population outlook (Washington County) Hauer SSP2
- Today (2025)
- 59,640 people
- By 2030
- 58,315 · -2.2%
- By 2040
- 55,186 · -7.5%
- By 2050
- 52,246 · -12.4%
- By 2075
- 45,893 · -23.0%
- By 2100
- 38,128 · -36.1%
Race, ethnicity, and origin ACS 2023
- Neighborhood character
- Predominantly White (100%)
- Race & ethnicity
- White 100%
- Common ancestry
- Iranian 4% Serbian 2% Slovak 1%
- Languages at home
- 98% English-only · Spanish 2%
Political lean MEDSL · Washington
- 2024 margin
- Solid R (+43.8) · D 27.7% · R 71.5%
- 2008→2024 swing
- +40.2pp toward D · 2008: -83.9pp · 2024: -43.8pp
- All cycles
- 2024: R+43.8 2020: R+40.8 2016: R+41.6 2012: R+19.4 2008: R+83.9
Not yet ingested
- Civics
- —
Market trends
- HPI YoY
- ▲ 9.01%
- Current HPI
- 255.5858
- Rent YoY
- —
- Metro
- —
- State GDP YoY
- ▲ 1.98%
- F500 in state
- 48
Industry mix (Fortune 500 HQ in OH)
| Industry | F500 HQs | Revenue |
|---|---|---|
| Insurance | 3 | $145B |
|
||
| Industrial Machinery | 3 | $49B |
|
||
| Financial Services | 3 | $24B |
|
||
| Consumer Goods | 2 | $93B |
|
||
| Aerospace / Defense | 2 | $47B |
|
||
| Utilities | 2 | $33B |
|
||
Price history
-12.5% since first listed3 events — show timeline
- 2026-05-20 Listed $69,900 MLSNOW
- 2026-05-12 Listing Removed — MLSNOW
- 2025-12-11 Listed $79,900 MLSNOW
Property tax history
+7.8%/yrLatest (2025): $1,125 · +11.9% YoY. Source: county tax records.
Cash-flow waterfall
monthlySold comps — $/sqft
last 12 mo · ≤1 miLoading sold comps…