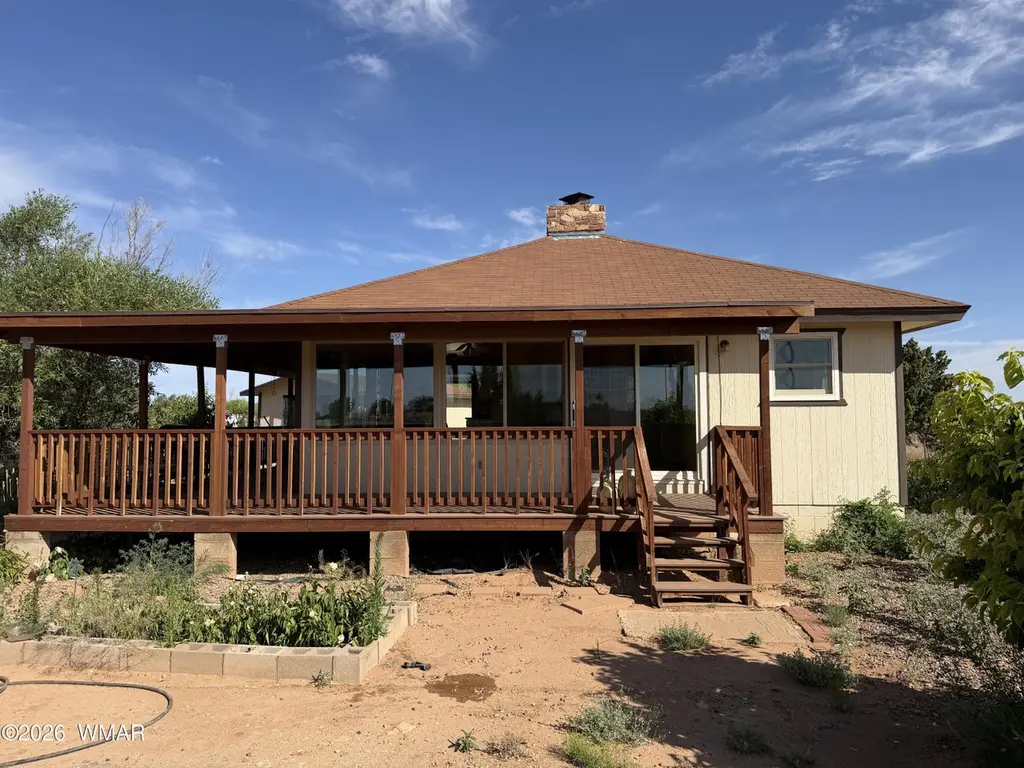
2491 E Mountain View Dr · Snowflake, AZ
Flood risk 1/10 · Minimal
- FEMA flood zone
- X (unshaded)
- Chance of flooding over 30 yrs
- 0.0%
- Est. flood insurance / yr
- $507 – $1,088
Fire risk 3/10 · Minor
- Est. fire insurance / yr
- $610 – $1,132
Heat risk 4/10 · Minor
- Hot days now (above 92°F)
- 5 days/yr
- Hot days in 30 yrs
- 14 days/yr
Wind risk 1/10 · Minimal
- Chance of severe wind over 30 yrs
- —
Air-quality risk 1/10 · Minimal
- Unhealthy air days now
- 0 days/yr
- Unhealthy air days in 30 yrs
- 0 days/yr
Risk factors via First Street. Map © Google.
Why this score? — see what drove the C- grade
The composite is a weighted blend of 9 inputs, each scored 0–100. Each bar is that input's sub-score; the figure is the points it added to the 100-point composite (weight × sub-score).
- Cash flow +14.3/30.0
- Appreciation +10.0/10.0
- ARV discount +7.5/15.0
- Schools +4.6/10.0
- DSCR +4.4/10.0
- 1% rule +4.0/10.0
- Livability +3.5/5.0
- Rent growth +2.5/5.0
- Condition / age +2.5/5.0
$175,000
🖨 Deal sheet (PDF) 📄 Offer letter ✓ Due diligence
Listing remarks MLS
Awesome panoramic views and open spaces wait for you in this cute bungalow high up in Snowflake Heights. Sitting on an acre of land with a nice sizedliving room, a fireplace, and 2 bedrooms. Laundry area is in the bathroom. Detached workshop/storage area. This is a Fannie Mae HomePath property. Approved for HomePath Renovation financing. Please visit the HomePath website for more information on HomePath financing options. Appliances remaining included without warranty.
Key facts
- Large living area
- Outdoor area porch
- Quick drive to town
Tags
Property features AI
Finance
- Other: Approximately 1.00 acre; Additional parcel numbers
- HOA & community: No HOA; Subdivision: Snowflake Heights
Exterior
- Parking: Has garage
- Utilities: Septic tank sewer; APS electric available; Propane / bottled gas available; Individual electric meter; Metered water available; Power available; Water available
- Home design: Site-built home; Single-story; Private adjoining property; R1 zoning
- Construction: Wood frame construction; Stemwall foundation; Shingle roof
- Exterior features: Patio; Covered deck; Covered patio; Wire fence; Trees on property; City-maintained road
Interior
- Kitchen: Electric range
- Flooring: Carpet; Laminate
- Heating & cooling: Evaporative cooling; Bottled gas heating; Wood heating; Electric water heater
- Interior features: Fireplace; Carpet and laminate flooring
Neighborhood map
What this means for you Summary
Snapshot
- This is a 2-bed/1.0-bath single-family listed at $175k.
Deal economics
- At list price, monthly cash flow is $32 ($388/yr) — positive.
- The deal already cash-flows at list — no discount required.
- To meet the 1% rule (rent ≥ 1% of price), the offer needs to be $157k (10.2% below list).
- Recommended offer: $157k (10.2% below list) — sets the bar for 1% rule.
- Cap rate 6.5% vs local median 2.9% in Snowflake — top-decile yield for the area; either an underpriced asset or a hidden risk that comps aren't pricing in. Stress-test before assuming the spread holds.
Location & tenants
- Location reads 69/100 on livability (#46 in AZ) — a middle-class / working-renter tenant base. Strengths: cost of living A+, housing A+; Watch: employment C-, amenities F, commute F.
- Snowflake Unified District (4391) (town): math 55% / reading 53% proficiency, ranked #36 of 249 in AZ (top 14%) — acceptable for families but not a draw, mixed tenant base, ~2y average lease.
- Market conditions: 290 active listings in the ZIP; 485 units permitted in Navajo County in 2024 (11 in 5+ unit buildings).
Forward outlook
- In year one you build about $19k of equity ($1k loan paydown + $18k appreciation (10.0% local appreciation)).
- Navajo County population projected at -16% by 2050 — secular population decline; favor cash flow + early exit over multi-decade hold.
- At projected returns (10.0% appreciation + 3.0% rent growth), your $49k cash investment doubles in ~3 years — after that, you're playing with house money.
- By year 2, paydown + projected appreciation supports a ~$30k cash-out refi (75% LTV) — recoverable capital for the next deal without selling this one.
Negotiation context
- Only 5 days on market — expect competitive offers; lowballing is unlikely to land.
- 2 sale attempts since 14y ago with the ask held roughly flat each time — persistent listings suggest the price (not the market) is what's stuck; bring a comps-based counter.
- Current owner paid $40k; list at $175k implies a 339% gain — meaningful room to come down on a strong offer.
Questions for the listing agent
- Is there a deadline driving the sale (1031 exchange, divorce, estate, relocation)? That informs how much negotiation room exists.
- What's the average days-on-market for RENTAL listings here right now (not sales)? A rising rental-DOM trend means longer vacancies and softer asking-rent achievability than the comps imply.
- What's the recent tenant-quality profile in this submarket — average credit score on applications, eviction rate, late-payment / NSF rate, and stable-employment percentage? A property-management company in the area should have these aggregated.
- How much new for-sale + rental construction is in the pipeline within 1–3 miles? Heavy new supply typically softens prices + rents 12–24 months out; constrained supply supports both.
Investment metrics
- 1% rule
- 0.90% ✗
- Cap rate
- 6.51%
- Cash-on-cash
- 0.79%
- DSCR
- 1.04
- GRM
- 9.3
CMA / ARV
No comps found within radius.
Projected returns pro-forma
10.0% appreciation · 3.0% rent growth · sell at horizon
- IRR
- 24.9%
- Equity multiple
- 2.99×
- Total profit
- $97,395
- Equity at exit
- $157,654
- IRR
- 21.9%
- Equity multiple
- 6.82×
- Total profit
- $285,238
- Equity at exit
- $339,987
Cash invested: $49,000 (down + closing). Projections, not guarantees.
Landlord ↔ Tenant lean methodology
- Overall (STATE)
- 87 Strongly Landlord-Friendly
- State Arizona
- 87 Strongly Landlord-Friendly · R+3
- County
- — inherits STATE
- City
- — inherits STATE
ZIP-level market 85937
- Home prices YoY
- 3.3%
- Active inventory
- 290
- Price-to-rent
- 9.3×
Monthly cashflow live
- Estimated rent
- $1,572 medium interval (Pro) →
- Mortgage (P&I)
- −$918
- Tax est. 1.5%
- −$219 /mo · $2,625/yr
- Insurance
- −$73
- HOA
- −$0
- Vacancy / Maint / Mgmt
- −$330
- Net cashflow
- $32
Break-even live
Sensitivity live
| Price | -10% $153 | -5% $93 | +0% $32 | +5% $-28 | +10% $-89 |
|---|---|---|---|---|---|
| Rent | -10% $-92 | -5% $-30 | +0% $32 | +5% $94 | +10% $157 |
| Rate | -1.0pp $120 | -0.5pp $77 | base $32 | +0.5pp $-13 | +1.0pp $-59 |
UW: 25.0% down · 7.5% · 30yr · 1.5% tax · 5.0% vac · 8.0% maint · 8.0% mgmt
Financing live
Cash to close
- Down payment
- $43,750
- Closing costs
- $5,250
- Reserves months
- —
- Total cash needed
- —
Loan-product check · same deal, 3 products live
Conventional
25% down · 7.5% · 30yr
- Down + closing
- —
- Monthly P&I
- —
- Monthly cashflow
- —
- DSCR
- —
- Eligible?
- —
Personal DTI + credit; lowest rate.
DSCR
20% down · 8.5% · 30yr
- Down + closing
- —
- Monthly P&I
- —
- Monthly cashflow
- —
- DSCR
- —
- Eligible?
- —
No personal income docs; deal must DSCR.
Hard money
10% down · 12.0% · 12mo
- Down + closing
- —
- Monthly P&I
- —
- Monthly cashflow
- —
- DSCR
- —
- Eligible?
- —
Short-term bridge; refi at stabilization.
Listing history 6 events
-
2026-06-17status $175,000 Pending 5 DOM
-
2026-06-17days on market $175,000 Active 5 DOM
-
2026-06-16days on market $175,000 Active 4 DOM
-
2026-06-15days on market $175,000 Active 3 DOM
-
2026-06-13remarks 264-char remark
-
2026-06-13$175,000 Active 1 DOM
ⓘ Source: listings_history table (triggers on properties + properties_extension) + one-shot
backfill from property_details.listing_events for pre-trigger history.
Climate risk First Street
- Flood 1/10 Low FEMA zone X (unshaded) · 0% chance over 30 yrs
- Wildfire 3/10 Moderate
- Heat 4/10 Moderate 5 d/yr ≥92°F today · 14 d/yr by 30 yrs out
- Wind 1/10 Low
- Air quality 1/10 Low 0 unhealthy d/yr today · 0 by 30 yrs out
Nearby sold comps map
Loading sold comps map…
Walkable amenities ~0.75 mi
Loading nearby amenities…
Taxation est. · year 1
- Rental income
- $18,862
- − Mortgage interest
- −$9,803
- − Property taxes
- −$2,625
- − Insurance
- −$875
- − Repairs & maintenance
- −$1,509
- − Management
- −$1,509
- − Depreciation
- −$5,091
- Taxable loss
- −$2,549
- Est. tax savings @ 24.0%
- +$612
- After-tax cash flow
- $1,000/yr
For passive investors: Depreciation is non-cash, so a rental often shows a tax loss while cash-flowing — sheltering income. Rental losses are passive: they offset passive income freely, and up to $25,000/yr can offset ordinary (W-2) income if you actively participate and your MAGI is under $100k (phasing out to $0 by $150k); unused losses carry forward. On sale, claimed depreciation is recaptured at up to 25%, and gains may owe capital-gains tax (a 1031 exchange can defer both). Figures are a year-1 estimate at your 24.0% rate — not tax advice; consult a CPA.
Schools (NCES district)
- District
- Snowflake Unified District (4391)
- NCES district ID
- 0407820
- Math proficiency
- 55% ▼ -9.00%
- Reading proficiency
- 53% ▼ -2.00%
- Median HH income
- $47,767
- Composite
- 45.91/100
- National rank
- #2545
- State rank
- #36 of 249 in AZ
Livability — Snowflake
- Score
- 69/100
- State rank
- #46
- US rank
- #8817
Category grades
Schools grade is shown separately in the Schools card above.
Census & demographics
- Census place
- Snowflake, AZ
- Population (ZIP)
- 9,975
Population outlook (Navajo County) Hauer SSP2
- Today (2025)
- 105,760 people
- By 2030
- 103,301 · -2.3%
- By 2040
- 97,070 · -8.2%
- By 2050
- 88,850 · -16.0%
- By 2075
- 65,180 · -38.4%
- By 2100
- 37,281 · -64.7%
Race, ethnicity, and origin ACS 2023
- Neighborhood character
- Predominantly White (83%)
- Race & ethnicity
- White 83% Hispanic / Latino 9% Two or more races 7% Black 4%
- Hispanic origin (detail)
- Mexican 7%
- Common ancestry
- Italian 5% Slovak 3% Portuguese 2%
- Foreign-born
- 4% · Canada
- Languages at home
- 90% English-only · Spanish 7% French/Haitian/Cajun 2% German/W. Germanic 1%
Political lean MEDSL · Navajo
- 2024 margin
- R (+17.2) · D 40.9% · R 58.1%
- 2008→2024 swing
- -5.5pp toward R · 2008: -11.7pp · 2024: -17.2pp
- All cycles
- 2024: R+17.2 2020: R+8.2 2016: R+7.9 2012: R+8.4 2008: R+11.7
Not yet ingested
- Civics
- —
Market trends
- HPI YoY
- ▲ 15.31%
- Current HPI
- 480.9577
- Rent YoY
- —
- Metro
- —
- State GDP YoY
- ▲ 4.54%
- F500 in state
- 20
Industry mix (Fortune 500 HQ in AZ)
| Industry | F500 HQs | Revenue |
|---|---|---|
| Technology | 2 | $13B |
|
||
| Mining / Metals | 1 | $23B |
|
||
| Environmental Services | 1 | $16B |
|
||
| Metals / Steel | 1 | $14B |
|
||
| Technology Distribution | 1 | $9B |
|
||
| Homebuilding | 1 | $8B |
|
||
Price history
+3265.4% since first listed7 events — show timeline
- 2026-06-12 Listed $175,000 WMMLS
- 2012-08-09 Sold (MLS) $39,900 NAZMLS
- 2012-07-05 Listed $39,900 NAZMLS
- 2012-04-30 Sold (Public Records) $72,987 Public Records
- 1999-12-14 Sold (Public Records) $65,000 Public Records
- 1992-04-14 Sold (Public Records) $30,500 Public Records
- 1985-04-01 Sold (Public Records) $5,200 Public Records
Property tax history
+1.6%/yrLatest (2025): $315 · +3.7% YoY. Source: county tax records.
Cash-flow waterfall
monthlySold comps — $/sqft
last 12 mo · ≤1 miLoading sold comps…