2114 Tierney Rd · Fort Worth, TX
Flood risk 1/10 · Minimal
- FEMA flood zone
- X (unshaded)
- Chance of flooding over 30 yrs
- 0.0%
- Est. flood insurance / yr
- $507 – $1,088
Fire risk 1/10 · Minimal
- Est. fire insurance / yr
- $1,222 – $2,270
Heat risk 7/10 · Major
- Hot days now (above 110°F)
- 6 days/yr
- Hot days in 30 yrs
- 19 days/yr
Wind risk 6/10 · Moderate
- Chance of severe wind over 30 yrs
- 27.0%
Air-quality risk 3/10 · Minor
- Unhealthy air days now
- 2 days/yr
- Unhealthy air days in 30 yrs
- 4 days/yr
Risk factors via First Street. Map © Google.
Why this score? — see what drove the B- grade
The composite is a weighted blend of 9 inputs, each scored 0–100. Each bar is that input's sub-score; the figure is the points it added to the 100-point composite (weight × sub-score).
- Cash flow +30.0/30.0
- 1% rule +10.0/10.0
- DSCR +10.0/10.0
- ARV discount +7.5/15.0
- Livability +4.0/5.0
- Condition / age +2.5/5.0
- Rent growth +2.4/5.0
- Schools +2.0/10.0
- Appreciation +0.0/10.0
$70,000
🖨 Deal sheet 📄 Offer letter ✓ Due diligence
Listing remarks
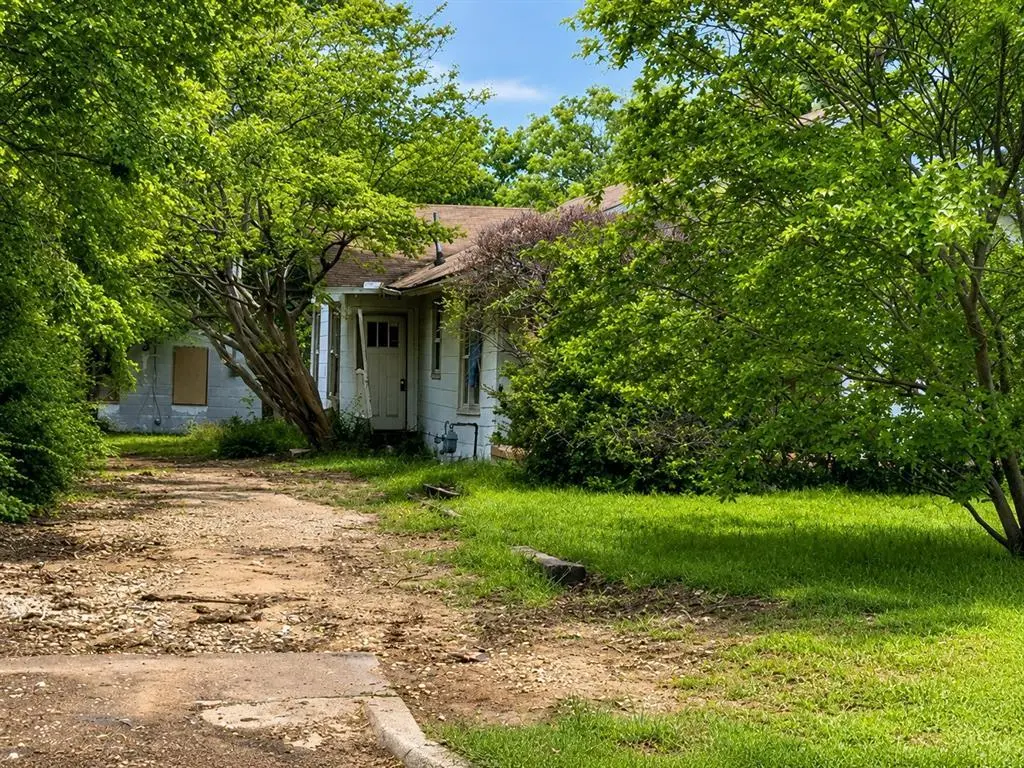
MULTIPLE OFFERS RECEIVED - HIGHEST & BEST REQUEST - DUE: 10:00 AM, Monday, June 1, 2026 Nestled on a generously sized, tree-covered lot in Fort Worth, 2114 Tierney Rd offers a rare opportunity to restore and reimagine a property full of character and potential. The property includes the main residence plus an additional structure, providing flexibility for storage, workshop space, guest quarters, or future creative use. Mature trees and expansive green space create a peaceful, private setting with room to grow. The home retains many vintage details and original charm, including wood floors, built-ins, and spacious rooms filled with natural light. Conveniently located with easy a
Key facts
- Tree covered lot
- Vintage details
- Additional structure
Tags
Property features AI
Finance
- Other: Lot approximately 0.629 acre; Will not subdivide; Directions: From I-20, head south on Hemphill St. for approximately 2 miles, then turn onto Tierney Rd. Continue a short distance to the property on your right.
- Financial info: Treat as clear loan type; No second mortgage; Special listing conditions: Real Estate Owned
- HOA & community: No association
Exterior
- Parking: Driveway (no garage or covered/carport spaces)
- Utilities: City water; City sewer; Not in a municipal utility district
- Home design: Single-family residence; One story; Residential property; Subdivision: GARRISON, MITCHELL
- Construction: Built in 1925; Wood construction; Composition roof; Pillar/post/pier foundation
- Exterior features: No fencing
Interior
- Kitchen: Gas range
- Bedrooms: Primary bedroom on main level (approx. 12 x 12)
- Flooring: Laminate flooring
- Bathrooms: Two full bathrooms
- Heating & cooling: No heating; No cooling
- Interior features: Two living areas; One dining area; Two total rooms (not including baths); Other interior features
- Laundry & utility: No laundry features listed
Neighborhood map
What this means for you Summary
Snapshot
- This is a 3-bed/1.0-bath single-family listed at $70k.
Deal economics
- At list price, monthly cash flow is $614 ($7k/yr) — positive.
- The deal already cash-flows at list — no discount required.
- Meets the 1% rule at list price ($2k rent vs $70k).
- Recommended offer: $69k (1.5% below list) — sets the bar for market timing.
- Cap rate 16.8% vs local median 3.9% in Fort Worth — top-decile yield for the area; either an underpriced asset or a hidden risk that comps aren't pricing in. Stress-test before assuming the spread holds.
Location & tenants
- Location reads 80/100 on livability (#49 in TX, #1,954 nationally) — a professional / high-income tenant draw. Strengths: amenities A+, cost of living A+, housing A+; Watch: crime F.
- Fort Worth ISD (urban): math 18% / reading 28% proficiency, ranked #742 of 826 in TX (top 90%) — low school quality limits family demand, transient renter base, plan for 1-2y turnover; 73% free/reduced lunch — lower-income household profile, screen leases tightly.
- Zoned schools: Eastern Hills El (math 13% / reading 19%, grade F, #3,974 of 4,322 statewide, top 92%, 472 students, 92% FRL) — zoned schools average 92% FRL vs 73% district-wide (20 pts higher); higher-poverty schools than district average — tighter screening recommended.
- Market conditions: Rents soft (-0.4%/yr); 169 active listings in the ZIP; 40 comparable units currently listed for rent nearby; rentals at typical pace (median 15d on market — plan ~3-4 weeks tenant-placement turnaround); 18,938 units permitted in Tarrant County in 2024 (8,336 in 5+ unit buildings).
- This rent runs 32% of the median local income ($58k/yr) — at the standard rent-burdened threshold; future hikes will face affordability resistance.
Forward outlook
- Local home prices are declining (-3.0%/yr); year-one equity from $484 of loan paydown is wiped out by about $2k of value loss. Plan a longer hold.
- Tarrant County population projected at +41% by 2050 — long-run rental-demand tailwind backs the buy-and-hold thesis.
- At projected returns (-3.0% appreciation + 0.0% rent growth), your $20k cash investment doubles in ~4 years — after that, you're playing with house money.
Negotiation context
- It's been on market 16 days — a 2% lower offer ($69k) is reasonable based on typical stale-listing flexibility.
Risks & watch-outs
- Watch-outs: property tax is 3.5% of price; built in 1925 — expect roof / HVAC / electrical / plumbing capex.
- Climate carrying-cost: major wind risk, 27% chance of damaging wind over 30y; extreme-heat days projected 6→19/yr by 2055 (HVAC capex compounding) — expect insurance premiums to compound above CPI over the hold.
Questions for the listing agent
- Built in 1925 — when were the roof, HVAC, electrical panel, plumbing, and water heater last replaced?
- Property tax is high relative to price — has the assessment been appealed recently, and will the sale trigger a re-assessment?
- Is there a deadline driving the sale (1031 exchange, divorce, estate, relocation)? That informs how much negotiation room exists.
- Schools are D-rated, which usually means shorter tenancies and higher turnover. Who's the typical renter profile here, and what's been the actual vacancy rate?
- Crime grade is F in this area — have there been break-ins, vandalism, or insurance claims at this property in the last 3 years? What carrier currently insures it and at what premium?
- What's the average days-on-market for RENTAL listings here right now (not sales)? A rising rental-DOM trend means longer vacancies and softer asking-rent achievability than the comps imply.
- What's the recent tenant-quality profile in this submarket — average credit score on applications, eviction rate, late-payment / NSF rate, and stable-employment percentage? A property-management company in the area should have these aggregated.
- How much new for-sale + rental construction is in the pipeline within 1–3 miles? Heavy new supply typically softens prices + rents 12–24 months out; constrained supply supports both.
Investment metrics
- 1% rule
- 2.20% ✓
- Cap rate
- 16.82%
- Cash-on-cash
- 37.60%
- DSCR
- 2.67
- GRM
- 3.8
CMA / ARV
- ARV (on-the-fly)
- $213,600
- Comps found
- 12
Show comp detail 12 sales within ~0.75 mi
| Address | Dist | Beds/Ba | Sqft | Sold | Price | $/sf | Match |
|---|---|---|---|---|---|---|---|
| 1916 Tierney Rd | 0.08mi | 2/1.0 (-1) | 1,098 (-8%) | 1mo | $193,500 | $176 | 76 |
| 2220 Jenson Rd | 0.13mi | 3/2.0 | 1,257 (+5%) | 7mo | $265,000 | $211 | 76 |
| 2221 Sturges Dr | 0.65mi | 3/1.0 | 1,187 (-1%) | 12mo | $187,500 | $158 | 58 |
| 1924 N Edgewood Ter | 0.50mi | 2/1.0 (-1) | 1,118 (-7%) | 4mo | $199,500 | $178 | 56 |
| 5521 Hightower St | 0.64mi | 2/1.0 (-1) | 1,152 (-4%) | 8mo | $129,999 | $113 | 52 |
| 2320 Maryel Dr | 0.50mi | 2/1.0 (-1) | 1,366 (+14%) | 0mo | $190,000 | $139 | 48 |
| 5413 Van Natta Ln | 0.68mi | 3/2.0 | 1,122 (-6%) | 8mo | $229,000 | $204 | 47 |
| 2108 San Jose Dr | 0.66mi | 2/1.0 (-1) | 1,275 (+6%) | 12mo | $200,000 | $157 | 44 |
| 4620 Meadowbrook Dr | 0.46mi | 3/3.5 | 1,327 (+11%) | 9mo | $279,000 | $210 | 44 |
| 4447 Normandy Rd | 0.62mi | 2/1.0 (-1) | 1,031 (-14%) | 1mo | $235,000 | $228 | 42 |
| 2200 Grandview Dr | 0.51mi | 2/2.0 (-1) | 1,370 (+14%) | 9mo | $275,000 | $201 | 36 |
| 5512 Greenlee St | 0.74mi | 2/1.0 (-1) | 1,066 (-11%) | 8mo | $174,000 | $163 | 36 |
Match score weights: distance 35% · size 25% · config 20% · recency 20%. Top-matched comps best support the ARV.
Projected returns pro-forma
-3.0% appreciation · 0.0% rent growth · sell at horizon
- IRR
- 29.8%
- Equity multiple
- 2.19×
- Total profit
- $23,362
- Equity at exit
- $10,437
- IRR
- 35.2%
- Equity multiple
- 3.74×
- Total profit
- $53,673
- Equity at exit
- $6,052
Cash invested: $19,600 (down + closing). Projections, not guarantees.
Landlord ↔ Tenant lean methodology
- Overall (STATE)
- 87 Strongly Landlord-Friendly
- State Texas
- 87 Strongly Landlord-Friendly · R+5
- County
- — inherits STATE
- City
- — inherits STATE
ZIP-level market 76112
- Home prices YoY
- -32.0%
- Rents YoY
- -0.4%
- Active inventory
- 169
- Price-to-rent
- 3.8×
Monthly cashflow live
- Estimated rent
- $1,539 high interval (Pro) →
- Mortgage (P&I)
- −$367
- Tax from tax record
- −$205 /mo · $2,465/yr
- Insurance
- −$29
- HOA
- −$0
- Vacancy / Maint / Mgmt
- −$323
- Net cashflow
- $614
Break-even live
UW: 25.0% down · 7.5% · 30yr · 1.5% tax · 5.0% vac · 8.0% maint · 8.0% mgmt
Financing live
Cash to close
- Down payment
- $17,500
- Closing costs
- $2,100
- Reserves months
- —
- Total cash needed
- —
Loan-product check · same deal, 3 products live
Conventional
25% down · 7.5% · 30yr
- Down + closing
- —
- Monthly P&I
- —
- Monthly cashflow
- —
- DSCR
- —
- Eligible?
- —
Personal DTI + credit; lowest rate.
DSCR
20% down · 8.5% · 30yr
- Down + closing
- —
- Monthly P&I
- —
- Monthly cashflow
- —
- DSCR
- —
- Eligible?
- —
No personal income docs; deal must DSCR.
Hard money
10% down · 12.0% · 12mo
- Down + closing
- —
- Monthly P&I
- —
- Monthly cashflow
- —
- DSCR
- —
- Eligible?
- —
Short-term bridge; refi at stabilization.
Rent comps 40 comps
| Address | Beds | Baths | Sqft | Rent | $/sqft | DOM | Units | Dist |
|---|---|---|---|---|---|---|---|---|
| 4900 Morris Ave Fort Worth, TX | 3.0 | 2.0 | 1248 | $1,695 | $1.36 | 6d | 1 | 0.29mi |
| 4909 E Lancaster Ave Fort Worth, TX | 1.0–3.0 | 1.0–2.0 | 958 | $2,225 | $2.32 | 3d | 12 | 0.46mi |
| 5308 Norma St Fort Worth, TX | 2.0 | 2.0 | 1175 | $1,350 | $1.15 | 6d | 1 | 0.49mi |
| 4761 E Lancaster Ave Fort Worth, TX | 2.0 | 1.0 | 714 | $1,500 | $2.10 | 1d | 9 | 0.53mi |
| 5317 Purington Ave Fort Worth, TX | 2.0 | 1.0 | 1363 | $1,525 | $1.12 | 24d | 1 | 0.54mi |
| 5200 E Lancaster Ave Fort Worth, TX | 1.0–2.0 | 1.0–2.0 | 799 | $1,575 | $1.97 | 2d | 14 | 0.56mi |
| 5433 Purington Ave Fort Worth, TX | 3.0 | 1.0 | 1168 | $1,850 | $1.58 | 14d | 1 | 0.64mi |
| 5023 Vinson St Unit 5023 Fort Worth, TX | 2.0 | 1.0 | 742 | $1,175 | $1.58 | 43d | 1 | 0.71mi |
| 501 S Edgewood Ter Fort Worth, TX | 1.0–2.0 | 1.0–2.0 | 887 | $1,575 | $1.77 | 12d | 10 | 0.73mi |
| 1444 Weiler Blvd Fort Worth, TX | 2.0 | 2.0 | 954 | $1,400 | $1.47 | 43d | 1 | 0.80mi |
| 4413 Menzer Rd Fort Worth, TX | 3.0 | 2.0 | 1430 | $2,050 | $1.43 | 6d | 1 | 0.81mi |
| 2607 Yeager St Fort Worth, TX | 3.0 | 2.0 | 1170 | $1,995 | $1.71 | 24d | 1 | 0.85mi |
| 2607 Yeager St Fort Worth, TX | 3.0 | 2.0 | 1170 | $1,995 | $1.71 | 3d | 1 | 0.85mi |
| 2607 Yeager St Fort Worth, TX | 3.0 | 2.0 | 1170 | $1,995 | $1.71 | 13d | 1 | 0.85mi |
| 1445 Weiler Blvd Unit 5407B Fort Worth, TX | 2.0 | 2.5 | 1130 | $1,225 | $1.08 | 6d | 1 | 0.85mi |
| 1445 Weiler Blvd #1423 Fort Worth, TX | 2.0 | 2.5 | 1130 | $1,225 | $1.08 | 24d | 1 | 0.85mi |
| 1445 Weiler Blvd #1423 Fort Worth, TX | 2.0 | 2.5 | 1130 | $1,225 | $1.08 | 2d | 1 | 0.85mi |
| 5407 Chimney Rock Rd Fort Worth, TX | 2.0 | 2.5 | 1130 | $1,225 | $1.08 | 10d | 1 | 0.85mi |
| 1423 Weiler Blvd Fort Worth, TX | 2.0 | 2.5 | 1130 | $1,225 | $1.08 | 24d | 1 | 0.87mi |
| 1417 Weiler Blvd Unit 5407B Fort Worth, TX | 2.0 | 2.5 | 1130 | $1,225 | $1.08 | 6d | 1 | 0.87mi |
| 5720 Meadowbrook Dr Unit 202 Fort Worth, TX | 2.0 | 2.0 | 919 | $1,350 | $1.47 | 43d | 1 | 0.88mi |
| 2112 Ederville Rd S Fort Worth, TX | 3.0 | 1.0 | 1344 | $1,795 | $1.34 | 16d | 1 | 0.94mi |
| 1820 Oakland Blvd Fort Worth, TX | 2.0 | 1.0 | 1224 | $1,775 | $1.45 | 43d | 1 | 0.95mi |
| 2521 Putnam St Fort Worth, TX | 3.0 | 1.5 | 1105 | $1,750 | $1.58 | 43d | 1 | 1.12mi |
| 5400 Boca Raton Blvd Fort Worth, TX | 1.0–3.0 | 1.0–2.0 | 922 | $1,500 | $1.63 | 2d | 1 | 1.15mi |
| 5401 Boca Raton Blvd Fort Worth, TX | 1.0–2.0 | 1.0–2.0 | 763 | $1,250 | $1.64 | 13d | 11 | 1.15mi |
| 5600 Cotswold Hills Dr Unit 512 Fort Worth, TX | 2.0 | 2.0 | 958 | $1,060 | $1.11 | 4d | 1 | 1.15mi |
| 5600 Cotswold Hills Dr Unit 2121 Fort Worth, TX | 2.0 | 2.0 | 958 | $1,017 | $1.06 | 2d | 1 | 1.15mi |
| 5534 Boca Raton Blvd #292 Fort Worth, TX | 2.0 | 2.5 | 1311 | $1,299 | $0.99 | 43d | 1 | 1.20mi |
| 5534 Boca Raton Blvd #292 Fort Worth, TX | 2.0 | 2.5 | 1311 | $1,250 | $0.95 | 24d | 1 | 1.20mi |
| 5534 Boca Raton Blvd Fort Worth, TX | 2.0 | 2.0 | 1010 | $1,125 | $1.11 | 24d | 1 | 1.20mi |
| 5618 Boca Raton Blvd #143 Fort Worth, TX | 2.0 | 3.0 | 1164 | $1,195 | $1.03 | 43d | 1 | 1.26mi |
| 525 King George Dr Fort Worth, TX | 1.0–2.0 | 1.0–2.0 | 798 | $1,100 | $1.38 | 43d | 1 | 1.28mi |
| 5700 Boca Raton Blvd Fort Worth, TX | 1.0–2.0 | 1.0–2.0 | 891 | $1,565 | $1.76 | 1d | 18 | 1.36mi |
| 6029 Plants Ave Fort Worth, TX | 3.0 | 2.0 | 1200 | $1,400 | $1.17 | 24d | 1 | 1.37mi |
| 394 Shady Lane Dr Apt 350 Fort Worth, TX | 1.0–2.0 | 1.0–2.0 | 781 | $1,349 | $1.73 | 3d | 8 | 1.38mi |
| 390 Shady Lane Dr Unit 347 Fort Worth, TX | 2.0 | 1.0 | 860 | $1,149 | $1.34 | 43d | 1 | 1.39mi |
| 390 Shady Lane Dr Unit 250 Fort Worth, TX | 2.0 | 2.0 | 1033 | $1,349 | $1.31 | 18d | 1 | 1.39mi |
| 231 Shady Lane Dr Fort Worth, TX | 2.0 | 2.0 | 1199 | $1,490 | $1.24 | 24d | 1 | 1.43mi |
| 2100 E Loop 820 Fort Worth, TX | 2.0–3.0 | 1.0–2.0 | 1070 | $1,690 | $1.58 | 1d | 36 | 1.46mi |
Listing history 7 events
-
2026-06-07statusdays on market $70,000 Pending 16 DOM
-
2026-06-04days on market $70,000 Active 15 DOM
-
2026-06-03days on market $70,000 Active 14 DOM
-
2026-06-02days on market $70,000 Active 13 DOM
-
2026-06-01days on market $70,000 Active 12 DOM
-
2026-05-31days on market $70,000 Active 11 DOM
-
2026-05-20$70,000 Active
ⓘ Source: listings_history table (triggers on properties + properties_extension) + one-shot
backfill from property_details.listing_events for pre-trigger history.
Tax reassessment forecast TX · Resets to sale price
- Current annual tax
- $2,465 · $205/mo
- Projected year-2 tax
- $2,465 · $205/mo
- Expected delta
- $0/yr ($0/mo · 0.0%)
ⓘ Screening estimate from a state-policy table — verify with the county assessor before closing.
Climate risk First Street
- Flood 1/10 Low FEMA zone X (unshaded) · 0% chance over 30 yrs
- Wildfire 1/10 Low
- Heat 7/10 Severe 6 d/yr ≥110°F today · 19 d/yr by 30 yrs out
- Wind 6/10 Major 27% chance of damaging wind over 30 yrs
- Air quality 3/10 Moderate 2 unhealthy d/yr today · 4 by 30 yrs out
Nearby sold comps map
Loading sold comps map…
Walkable amenities ~0.75 mi
Loading nearby amenities…
Taxation est. · year 1
- Rental income
- $18,469
- − Mortgage interest
- −$3,921
- − Property taxes
- −$2,465
- − Insurance
- −$350
- − Repairs & maintenance
- −$1,478
- − Management
- −$1,478
- − Depreciation
- −$2,036
- Taxable income
- $6,742
- Est. tax owed @ 24.0%
- −$1,618
- After-tax cash flow
- $5,753/yr
For passive investors: Depreciation is non-cash, so a rental often shows a tax loss while cash-flowing — sheltering income. Rental losses are passive: they offset passive income freely, and up to $25,000/yr can offset ordinary (W-2) income if you actively participate and your MAGI is under $100k (phasing out to $0 by $150k); unused losses carry forward. On sale, claimed depreciation is recaptured at up to 25%, and gains may owe capital-gains tax (a 1031 exchange can defer both). Figures are a year-1 estimate at your 24.0% rate — not tax advice; consult a CPA.
Schools (NCES district)
- District
- Fort Worth ISD
- NCES district ID
- 4819700
- Math proficiency
- 18% ▼ -16.00%
- Reading proficiency
- 28% ▼ -6.00%
- Median HH income
- $42,109
- Composite
- 19.61/100
- National rank
- #8753
- State rank
- #742 of 826 in TX
Livability — Fort Worth
- Score
- 80/100
- State rank
- #49
- US rank
- #1954
Category grades
Schools grade is shown separately in the Schools card above.
Census & demographics
- Census place
- Fort Worth, TX
- County
- Tarrant County · 2,033,669 people
- City population
- 911,619
- Metro
- Dallas-Fort Worth-Arlington, TX
- Population (ZIP)
- 44,514
- Household income
- $57,724
- Rent vs Own
- Severe rent burden
- 3056.0
Population outlook (Tarrant County) Hauer SSP2
- Today (2025)
- 2,380,417 people
- By 2030
- 2,578,900 · +8.3%
- By 2040
- 2,974,995 · +25.0%
- By 2050
- 3,350,489 · +40.8%
- By 2075
- 4,216,909 · +77.2%
- By 2100
- 4,741,527 · +99.2%
Race, ethnicity, and origin ACS 2023
- Neighborhood character
- Diverse neighborhood (Simpson 0.69)
- Race & ethnicity
- Black 38% Hispanic / Latino 34% White 21% Two or more races 19% Asian 3%
- Hispanic origin (detail)
- Mexican 28% Puerto Rican 1%
- Common ancestry
- Lithuanian 1% Slovak 1% Swiss 1%
- Foreign-born
- 15% · Canada, Vietnam
- Languages at home
- 67% English-only · Spanish 29% Other Indo-European 1% Vietnamese 1%
Political lean MEDSL · Tarrant
- 2024 margin
- Lean R (+5.1) · D 46.7% · R 51.9% · Other 1.4%
- 2008→2024 swing
- +6.6pp toward D · 2008: -11.7pp · 2024: -5.1pp
- All cycles
- 2024: R+5.1 2020: D+0.2 2016: R+8.7 2012: R+15.7 2008: R+11.7
Not yet ingested
- Civics
- —
Market trends
- HPI YoY
- ▼ -158.49%
- Current HPI
- 336.6297
- Rent YoY
- ▼ -0.43%
- Metro
- Dallas-Fort Worth-Arlington, TX
- State GDP YoY
- ▲ 3.95%
- F500 in state
- 110
Industry mix (Fortune 500 HQ in TX)
| Industry | F500 HQs | Revenue |
|---|---|---|
| Energy | 16 | $1,198B |
|
||
| Technology | 5 | $198B |
|
||
| Engineering / Construction | 4 | $72B |
|
||
| Energy Services | 3 | $60B |
|
||
| Utilities | 3 | $41B |
|
||
| Healthcare | 2 | $330B |
|
||
Price history
1 event — show timeline
- 2026-05-20 Listed $70,000 NTREIS
Property tax history
+3.2%/yrLatest (2025): $2,465 · -11.3% YoY. Source: county tax records.
Cash-flow waterfall
monthlySold comps — $/sqft
last 12 mo · ≤1 miLoading sold comps…