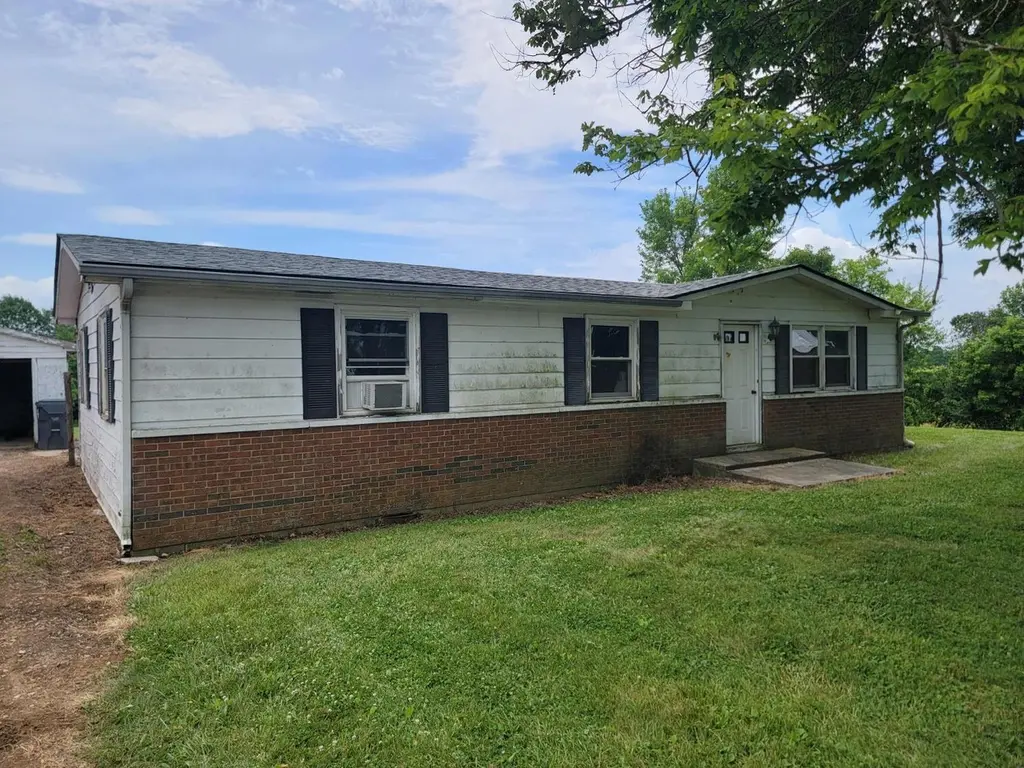
5219 Salem Ridge Rd · Aurora, IN
Flood risk 1/10 · Minimal
- FEMA flood zone
- X (unshaded)
- Chance of flooding over 30 yrs
- 0.0%
- Est. flood insurance / yr
- $507 – $1,088
Fire risk 3/10 · Minor
- Est. fire insurance / yr
- $717 – $1,331
Heat risk 4/10 · Minor
- Hot days now (above 104°F)
- 7 days/yr
- Hot days in 30 yrs
- 18 days/yr
Wind risk 2/10 · Minimal
- Chance of severe wind over 30 yrs
- 1.0%
Air-quality risk 2/10 · Minimal
- Unhealthy air days now
- 1 days/yr
- Unhealthy air days in 30 yrs
- 2 days/yr
Risk factors via First Street. Map © Google.
Why this score? — see what drove the B- grade
The composite is a weighted blend of 9 inputs, each scored 0–100. Each bar is that input's sub-score; the figure is the points it added to the 100-point composite (weight × sub-score).
- Cash flow +30.0/30.0
- 1% rule +10.0/10.0
- DSCR +10.0/10.0
- ARV discount +7.5/15.0
- Schools +2.7/10.0
- Livability +2.7/5.0
- Rent growth +2.5/5.0
- Condition / age +2.5/5.0
- Appreciation +0.0/10.0
$79,900
🖨 Deal sheet 📄 Offer letter ✓ Due diligence
Listing remarks
FIXER-UPPER OPPORTUNITY! Looking for a property with potential? This 3-bedroom modular home is ready for your vision and personal touch! Features include a detached garage, storage shed, and plenty of possibilities on 2+ acres. Awesome location just minutes from Aurora, offering convenience while maintaining a country setting. Newer roof shingles approx 5 years old. Property is being sold in as is condition; no warranties expressed or implied. Cash or conventional financing only, preapproval or proof of funds letter must be submitted with offer.
Key facts
- Country setting
- Storage shed
- 2 acres
Tags
Property features AI
Exterior
- Parking: 2-car garage; Gravel parking
- Utilities: Public water; Septic tank
- Home design: Single-family residence; One level / 1 story
- Construction: Aluminum siding and brick exterior
- Exterior features: Shingle roof; Rolling slope lot; Shed(s) on property
Interior
- Bathrooms: 1 full bathroom
- Heating & cooling: Baseboard heating
- Interior features: Electric water heater; 6 total rooms
Neighborhood map
What this means for you Summary
Snapshot
- This is a 3-bed/1.0-bath single-family listed at $80k.
Deal economics
- At list price, monthly cash flow is $642 ($8k/yr) — positive.
- The deal already cash-flows at list — no discount required.
- Meets the 1% rule at list price ($2k rent vs $80k).
Location & tenants
- Location reads 53/100 on livability (#648 in IN) — a working-class tenant base; expect higher turnover. Strengths: cost of living A+, crime A, housing B; Watch: amenities F, commute F, employment F.
- Rising Sun-Ohio County Com (rural): math 24% / reading 38% proficiency, ranked #225 of 301 in IN (top 75%) — families likely to look elsewhere, expect single-tenant / working-renter base with shorter leases.
- Zoned schools: Ohio County Elementary School (math 27% / reading 27%, grade F, #737 of 994 statewide, top 76%, 409 students, 49% FRL); Rising Sun High School (math 34% / reading 64%, grade D, #123 of 369 statewide, top 36%, 226 students, 35% FRL).
- Market conditions: 8 active listings in the ZIP; 6 units permitted in Ohio County in 2024 (0 in 5+ unit buildings).
Forward outlook
- Local home prices are declining (-3.0%/yr); year-one equity from $552 of loan paydown is wiped out by about $2k of value loss. Plan a longer hold.
- Ohio County population projected at -30% by 2050 — secular population decline; favor cash flow + early exit over multi-decade hold.
- At projected returns (-3.0% appreciation + 3.0% rent growth), your $22k cash investment doubles in ~4 years — after that, you're playing with house money.
Negotiation context
- Only 3 days on market — expect competitive offers; lowballing is unlikely to land.
Questions for the listing agent
- Built in 1975 — when were the roof, HVAC, electrical panel, plumbing, and water heater last replaced?
- Is there a deadline driving the sale (1031 exchange, divorce, estate, relocation)? That informs how much negotiation room exists.
- Schools are D-rated, which usually means shorter tenancies and higher turnover. Who's the typical renter profile here, and what's been the actual vacancy rate?
- What's the average days-on-market for RENTAL listings here right now (not sales)? A rising rental-DOM trend means longer vacancies and softer asking-rent achievability than the comps imply.
- What's the recent tenant-quality profile in this submarket — average credit score on applications, eviction rate, late-payment / NSF rate, and stable-employment percentage? A property-management company in the area should have these aggregated.
- How much new for-sale + rental construction is in the pipeline within 1–3 miles? Heavy new supply typically softens prices + rents 12–24 months out; constrained supply supports both.
Investment metrics
- 1% rule
- 1.89% ✓
- Cap rate
- 15.94%
- Cash-on-cash
- 34.46%
- DSCR
- 2.53
- GRM
- 4.4
CMA / ARV
No comps found within radius.
Projected returns pro-forma
-3.0% appreciation · 3.0% rent growth · sell at horizon
- IRR
- 29.9%
- Equity multiple
- 2.25×
- Total profit
- $27,991
- Equity at exit
- $11,913
- IRR
- 37.2%
- Equity multiple
- 4.45×
- Total profit
- $77,152
- Equity at exit
- $6,908
Cash invested: $22,372 (down + closing). Projections, not guarantees.
Landlord ↔ Tenant lean methodology
- Overall (STATE)
- 90 Strongly Landlord-Friendly
- State Indiana
- 90 Strongly Landlord-Friendly · R+11
- County
- — inherits STATE
- City
- — inherits STATE
ZIP-level market 47001
- Home prices YoY
- -20.1%
- Active inventory
- 8
- Price-to-rent
- 4.4×
Monthly cashflow live
- Estimated rent
- $1,512 medium interval (Pro) →
- Mortgage (P&I)
- −$419
- Tax est. 1.5%
- −$100 /mo · $1,198/yr
- Insurance
- −$33
- HOA
- −$0
- Vacancy / Maint / Mgmt
- −$318
- Net cashflow
- $642
Break-even live
UW: 25.0% down · 7.5% · 30yr · 1.5% tax · 5.0% vac · 8.0% maint · 8.0% mgmt
Financing live
Cash to close
- Down payment
- $19,975
- Closing costs
- $2,397
- Reserves months
- —
- Total cash needed
- —
Loan-product check · same deal, 3 products live
Conventional
25% down · 7.5% · 30yr
- Down + closing
- —
- Monthly P&I
- —
- Monthly cashflow
- —
- DSCR
- —
- Eligible?
- —
Personal DTI + credit; lowest rate.
DSCR
20% down · 8.5% · 30yr
- Down + closing
- —
- Monthly P&I
- —
- Monthly cashflow
- —
- DSCR
- —
- Eligible?
- —
No personal income docs; deal must DSCR.
Hard money
10% down · 12.0% · 12mo
- Down + closing
- —
- Monthly P&I
- —
- Monthly cashflow
- —
- DSCR
- —
- Eligible?
- —
Short-term bridge; refi at stabilization.
Listing history 4 events
-
2026-06-16status $79,900 Pending 3 DOM
-
2026-06-15days on market $79,900 Active 3 DOM
-
2026-06-12remarks 551-char remark
-
2026-06-12$79,900 Active 1 DOM
ⓘ Source: listings_history table (triggers on properties + properties_extension) + one-shot
backfill from property_details.listing_events for pre-trigger history.
Climate risk First Street
- Flood 1/10 Low FEMA zone X (unshaded) · 0% chance over 30 yrs
- Wildfire 3/10 Moderate
- Heat 4/10 Moderate 7 d/yr ≥104°F today · 18 d/yr by 30 yrs out
- Wind 2/10 Low 100% chance of damaging wind over 30 yrs
- Air quality 2/10 Low 1 unhealthy d/yr today · 2 by 30 yrs out
Nearby sold comps map
Loading sold comps map…
Walkable amenities ~0.75 mi
Loading nearby amenities…
Taxation est. · year 1
- Rental income
- $18,146
- − Mortgage interest
- −$4,476
- − Property taxes
- −$1,198
- − Insurance
- −$400
- − Repairs & maintenance
- −$1,452
- − Management
- −$1,452
- − Depreciation
- −$2,324
- Taxable income
- $6,844
- Est. tax owed @ 24.0%
- −$1,643
- After-tax cash flow
- $6,066/yr
For passive investors: Depreciation is non-cash, so a rental often shows a tax loss while cash-flowing — sheltering income. Rental losses are passive: they offset passive income freely, and up to $25,000/yr can offset ordinary (W-2) income if you actively participate and your MAGI is under $100k (phasing out to $0 by $150k); unused losses carry forward. On sale, claimed depreciation is recaptured at up to 25%, and gains may owe capital-gains tax (a 1031 exchange can defer both). Figures are a year-1 estimate at your 24.0% rate — not tax advice; consult a CPA.
Schools (NCES district)
- District
- Rising Sun-Ohio County Com
- NCES district ID
- 1809600
- Math proficiency
- 24% ▼ -12.00%
- Reading proficiency
- 38% ▼ -14.00%
- Median HH income
- $51,559
- Composite
- 27.13/100
- National rank
- #7034
- State rank
- #225 of 301 in IN
Livability — Aurora
- Score
- 53/100
- State rank
- #648
- US rank
- #24657
Category grades
Schools grade is shown separately in the Schools card above.
Census & demographics
- Population (ZIP)
- 10,374
Population outlook (Ohio County) Hauer SSP2
- Today (2025)
- 5,660 people
- By 2030
- 5,409 · -4.4%
- By 2040
- 4,718 · -16.6%
- By 2050
- 3,978 · -29.7%
- By 2075
- 2,798 · -50.6%
- By 2100
- 2,129 · -62.4%
Race, ethnicity, and origin ACS 2023
- Neighborhood character
- Predominantly White (93%)
- Race & ethnicity
- White 93% Two or more races 5% Hispanic / Latino 3%
- Common ancestry
- Slovak 3% Romanian 1% Scotch-Irish 1%
- Foreign-born
- 2% · Canada
Political lean MEDSL · Ohio
- 2024 margin
- Solid R (+55.5) · D 21.6% · R 77.0% · Other 1.4%
- 2008→2024 swing
- -36.5pp toward R · 2008: -19.0pp · 2024: -55.5pp
- All cycles
- 2024: R+55.5 2020: R+51.9 2016: R+49.1 2012: R+27.2 2008: R+19.0
Not yet ingested
- Civics
- —
Market trends
- HPI YoY
- ▼ -59.44%
- Current HPI
- 235.8562
- Rent YoY
- —
- Metro
- —
- State GDP YoY
- ▲ 2.90%
- F500 in state
- 18
Industry mix (Fortune 500 HQ in IN)
| Industry | F500 HQs | Revenue |
|---|---|---|
| Industrial Machinery | 2 | $37B |
|
||
| Healthcare | 1 | $177B |
|
||
| Pharmaceuticals | 1 | $45B |
|
||
| Metals / Steel | 1 | $18B |
|
||
| Agriculture | 1 | $17B |
|
||
| Packaging | 1 | $12B |
|
||
Price history
1 event — show timeline
- 2026-06-12 Listed $79,900 SEIBR
Property tax history
+56.0%/yrLatest (2024): $158 · +416.0% YoY. Source: county tax records.
Cash-flow waterfall
monthlySold comps — $/sqft
last 12 mo · ≤1 miLoading sold comps…