1900 Lyttonsville Rd #702 · Silver Spring, MD
Flood risk 10/10 · Severe
- FEMA flood zone
- X (unshaded)
- Chance of flooding over 30 yrs
- 0.99%
- Est. flood insurance / yr
- $507 – $1,088
Fire risk 1/10 · Minimal
- Est. fire insurance / yr
- $755 – $1,403
Heat risk 7/10 · Major
- Hot days now (above 104°F)
- 7 days/yr
- Hot days in 30 yrs
- 15 days/yr
Wind risk 4/10 · Minor
- Chance of severe wind over 30 yrs
- 17.0%
Air-quality risk 4/10 · Minor
- Unhealthy air days now
- 5 days/yr
- Unhealthy air days in 30 yrs
- 6 days/yr
Risk factors via First Street. Map © Google.
Why this score? — see what drove the D grade
The composite is a weighted blend of 9 inputs, each scored 0–100. Each bar is that input's sub-score; the figure is the points it added to the 100-point composite (weight × sub-score).
- ARV discount +15.0/15.0
- 1% rule +9.0/10.0
- Cash flow +6.5/30.0
- Livability +4.2/5.0
- Schools +3.6/10.0
- Condition / age +2.5/5.0
- Rent growth +1.9/5.0
- DSCR +0.8/10.0
- Appreciation +0.0/10.0
$135,500
🖨 Deal sheet 📄 Offer letter ✓ Due diligence
Listing remarks MLS
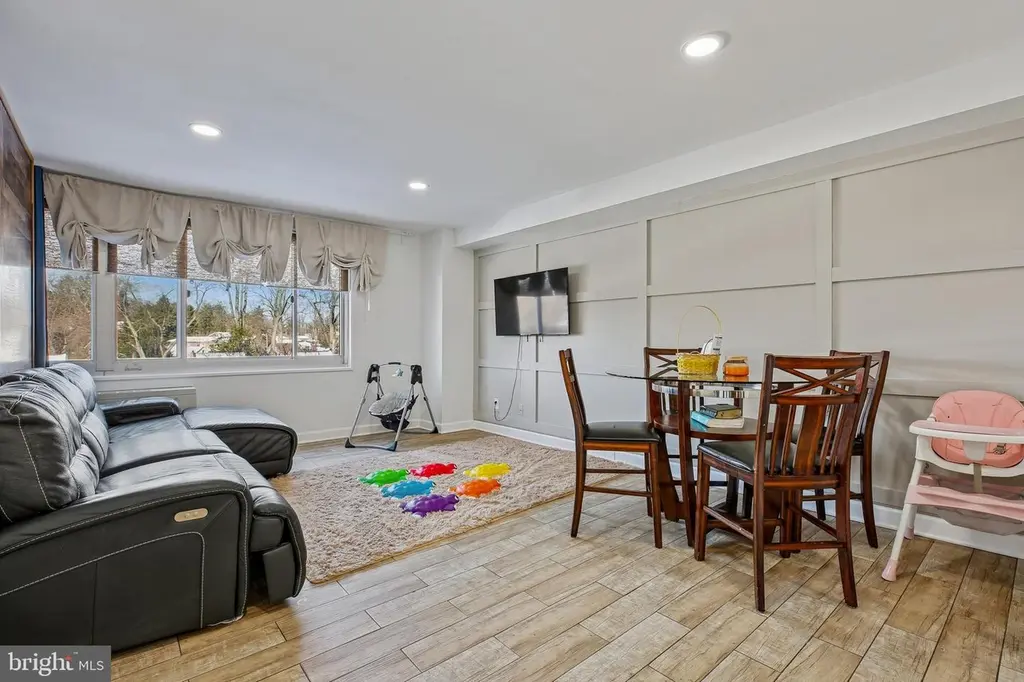
Best Value for your money! Fully Renovated AND 2026 Condo fees paid by the seller! Modern & Luxurious Junior One-Bedroom Condo In the heart of Silver Spring! Step into this beautifully renovated, modern home that feels far more spacious than you’d expect. Recently renovated and ready for the new owner with freshly painted, new kitchen cabinets with built-in wine rack, pantry, quartz counters and stainless steel appliances. There's new ceramic flooring throughout the entire unit for easy maintenance, modern light fixtures and recess lighting. The bathroom is fully renovated with oversized ceramic tiles, modern lighting and fixtures. This sun-drenched home features oversized windows that flood the space with natural light, creating an airy, open feel throughout. The roomy layout is paired with generous walk-in closets, giving you both style and serious storage! Located in a well-maintained, pet-friendly community, residents enjoy access to a sparkling pool, roof top deck that offers amazing views, a party room, a community garden and an indoor-laundry center; all conveniently located being steps from dining, shopping, entertainment, and transit. Everything you love about Silver Spring is right outside your door! ALL UTILITIES are included in the condo fee. The property is very well maintained with an on-site and off site management office and concierge services offered 7-days per week (9am-9pm). The community also also allows pets! Homes like this—modern, spacious, renovated, and perfectly located—don’t last long. If you’ve been waiting for the right one, this is it. Schedule your showing now before it’s gone.
Key facts
- Ceramic flooring
- Quartz counters
- Built-in wine rack
Tags
Neighborhood map
What this means for you Summary
Snapshot
- This is a 1-bed/1.0-bath condo listed at $136k.
Deal economics
- At list price, monthly cash flow is $-295 ($-4k/yr) — negative.
- To cash-flow at today's rent, offer at most $83k (38.5% below list).
- Meets the 1% rule at list price ($2k rent vs $136k).
- Recommended offer: $83k (38.5% below list) — sets the bar for cash-flow.
- Cap rate 4.3% vs local median 2.4% in Silver Spring — top-decile yield for the area; either an underpriced asset or a hidden risk that comps aren't pricing in. Stress-test before assuming the spread holds.
Location & tenants
- Location reads 83/100 on livability (#27 in MD, #973 nationally) — a professional / high-income tenant draw. Strengths: amenities A+, commute A+, employment A+; Watch: cost of living F.
- Montgomery County Public Schools (suburban): math 27% / reading 45% proficiency, ranked #3 of 24 in MD (top 12%) — families likely to look elsewhere, expect single-tenant / working-renter base with shorter leases.
- Market conditions: Rents soft (-2.3%/yr); 142 active listings in the ZIP; 40 comparable units currently listed for rent nearby; rentals leasing fast (median 3d on market — plan ~1-2 weeks tenant-placement turnaround); high-income renter base; 3,880 units permitted in Montgomery County in 2024 (2,054 in 5+ unit buildings).
Forward outlook
- Local home prices are declining (-3.0%/yr); year-one equity from $937 of loan paydown is wiped out by about $4k of value loss. Plan a longer hold.
- Montgomery County population projected at +27% by 2050 — long-run rental-demand tailwind backs the buy-and-hold thesis.
Negotiation context
- It's been on market 139 days — a 12% lower offer ($119k) is reasonable based on typical stale-listing flexibility.
- 5 sale attempts since 29y ago with the ask held roughly flat each time — persistent listings suggest the price (not the market) is what's stuck; bring a comps-based counter.
- Current owner paid $110k; 23% above their basis — modest negotiation headroom, anchor on the comps not their cost.
Risks & watch-outs
- Watch-outs: flood insurance adds $66/mo; HOA is 45% of rent.
- Climate carrying-cost: severe flood risk; extreme-heat days projected 7→15/yr by 2055 (HVAC capex compounding) — expect insurance premiums to compound above CPI over the hold.
Questions for the listing agent
- What do current leases actually rent for vs. the listed asking? Can we see a recent rent roll and the last 12 months of T-12 income?
- It's been on market 139 days. Have you received any prior offers? Is the seller open to a 38% concession, seller financing, or rate buy-down credit?
- Built in 1964 — when were the roof, HVAC, electrical panel, plumbing, and water heater last replaced?
- What's the actual annual flood-insurance premium (NFIP or private), and is the property in a SFHA with mandatory coverage?
- What does the HOA fee cover, when was the last increase, and are there any pending special assessments or reserve-fund shortfalls?
- Any open or pending special assessments — roof, HVAC, plumbing, elevator, façade? What's the per-unit balance and payoff schedule, and is the seller paying it off at close or rolling it to the buyer?
- Why hasn't it sold? Are there any deal-killer items the seller is aware of (foundation, flood, title, zoning, code violations)?
- Is there a deadline driving the sale (1031 exchange, divorce, estate, relocation)? That informs how much negotiation room exists.
- The area grade is low — what's the realistic commute time and amenity access for the typical tenant pool here? Any planned neighborhood developments (good or bad) we should know about?
- What's the average days-on-market for RENTAL listings here right now (not sales)? A rising rental-DOM trend means longer vacancies and softer asking-rent achievability than the comps imply.
- What's the recent tenant-quality profile in this submarket — average credit score on applications, eviction rate, late-payment / NSF rate, and stable-employment percentage? A property-management company in the area should have these aggregated.
- How much new apartment / multifamily construction is in the pipeline within 1–3 miles? Heavy new supply (>2% of stock underway) typically softens rents 12–24 months out; light construction supports rent growth.
Investment metrics
- 1% rule
- 1.40% ✓
- Cap rate
- 4.27%
- Cash-on-cash
- -7.23%
- DSCR
- 0.68
- GRM
- 5.9
CMA / ARV
- ARV (median comp)
- $223,698
- List price
- $135,500
- Delta
- -39.43%
- Verdict
- UNDERPRICED
- Comps
- 20 within 1.0 mi
Projected returns pro-forma
-3.0% appreciation · 0.0% rent growth · sell at horizon
- IRR
- -40.4%
- Equity multiple
- -0.21×
- Total profit
- $-45,755
- Equity at exit
- $20,203
- IRR
- —
- Equity multiple
- -1.20×
- Total profit
- $-83,293
- Equity at exit
- $11,716
Cash invested: $37,940 (down + closing). Projections, not guarantees.
Landlord ↔ Tenant lean methodology
- Overall (STATE)
- 27 Tenant-Leaning
- State Maryland
- 27 Tenant-Leaning · D+14
- County
- — inherits STATE
- City
- — inherits STATE
ZIP-level market 20910
- Rents YoY
- -2.3%
- Active inventory
- 142
- Price-to-rent
- 5.9×
Monthly cashflow live
- Estimated rent
- $1,901 high interval (Pro) →
- Mortgage (P&I)
- −$711
- Tax from tax record
- −$115 /mo · $1,379/yr
- Insurance
- −$56
- Flood insurance flood zone
- −$66 /mo · $798/yr
- HOA
- −$848
- Vacancy / Maint / Mgmt
- −$399
- Net cashflow
- $-295
Break-even live
UW: 25.0% down · 7.5% · 30yr · 1.5% tax · 5.0% vac · 8.0% maint · 8.0% mgmt
Financing live
Cash to close
- Down payment
- $33,875
- Closing costs
- $4,065
- Reserves months
- —
- Total cash needed
- —
Loan-product check · same deal, 3 products live
Conventional
25% down · 7.5% · 30yr
- Down + closing
- —
- Monthly P&I
- —
- Monthly cashflow
- —
- DSCR
- —
- Eligible?
- —
Personal DTI + credit; lowest rate.
DSCR
20% down · 8.5% · 30yr
- Down + closing
- —
- Monthly P&I
- —
- Monthly cashflow
- —
- DSCR
- —
- Eligible?
- —
No personal income docs; deal must DSCR.
Hard money
10% down · 12.0% · 12mo
- Down + closing
- —
- Monthly P&I
- —
- Monthly cashflow
- —
- DSCR
- —
- Eligible?
- —
Short-term bridge; refi at stabilization.
Rent comps 40 comps
| Address | Beds | Baths | Sqft | Rent | $/sqft | DOM | Units | Dist |
|---|---|---|---|---|---|---|---|---|
| 1900 Lyttonsville Rd Silver Spring, MD | 1.0 | 1.0 | 710 | $1,862 | $2.62 | 44d | 4 | 0.02mi |
| 8600 16th St Silver Spring, MD | 2.0 | 1.0–1.5 | 800 | $2,010 | $2.51 | 3d | 15 | 0.13mi |
| 8518 16th St Silver Spring, MD | 4.0 | 1.0–2.0 | 935 | $1,840 | $1.97 | 2d | 48 | 0.18mi |
| 8555 16th St Silver Spring, MD | 1.0–2.0 | 1.0 | 645 | $1,307 | $2.02 | 3d | 3 | 0.44mi |
| 8750 Georgia Ave Silver Spring, MD | 2.0 | 1.0–2.0 | 875 | $2,012 | $2.30 | 1d | 86 | 0.53mi |
| 1260 Spring St Silver Spring, MD | 2.0 | 1.0–2.0 | 1014 | $3,024 | $2.98 | 2d | 33 | 0.56mi |
| 1320 Fenwick Ln #6 Silver Spring, MD | 1.0 | 1.0 | 500 | $1,999 | $4.00 | 15d | 1 | 0.57mi |
| 2445 Lyttonsville Rd Silver Spring, MD | 2.0 | 1.0–2.0 | 852 | $1,874 | $2.20 | 2d | 39 | 0.60mi |
| 8305 16th St Silver Spring, MD | 1.0–2.0 | 1.0 | 683 | $1,418 | $2.08 | 5d | 8 | 0.62mi |
| 1400 E West Hwy Silver Spring, MD | 1.0–3.0 | 1.0–2.5 | 1416 | $1,863 | $1.32 | 2d | 30 | 0.66mi |
| 8710 Cameron St Silver Spring, MD | 2.0 | 1.0–2.5 | 879 | $2,270 | $2.58 | 1d | 20 | 0.66mi |
| 8605 Cameron St Silver Spring, MD | 2.0 | 1.0–2.0 | 664 | $2,280 | $3.43 | 2d | 76 | 0.67mi |
| 1203 Fidler Ln Silver Spring, MD | 2.0 | 1.0–2.0 | 876 | $2,048 | $2.34 | 2d | 1 | 0.68mi |
| 1110 Fidler Ln Silver Spring, MD | 2.0 | 1.0–2.0 | 900 | $1,964 | $2.18 | 1d | 17 | 0.72mi |
| 8621 Georgia Ave Silver Spring, MD | 2.0 | 1.0–2.0 | 726 | $2,256 | $3.11 | 2d | 18 | 0.72mi |
| 180 High Park Ln Silver Spring, MD | 3.0 | 1.0–2.0 | 927 | $3,080 | $3.32 | 2d | 8 | 0.76mi |
| 1001 Spring St Silver Spring, MD | 2.0 | 1.0–2.0 | 944 | $1,962 | $2.08 | 5d | 9 | 0.79mi |
| 2535 Ross Rd Silver Spring, MD | 1.0–2.0 | 1.0 | 745 | $1,434 | $1.92 | 2d | 7 | 0.81mi |
| 700 Roeder Rd Silver Spring, MD | 1.0 | 1.0 | 585 | $2,000 | $3.42 | 20d | 1 | 0.88mi |
| 710 Roeder Rd Silver Spring, MD | 2.0 | 1.0–1.5 | 785 | $2,035 | $2.59 | 8d | 7 | 0.88mi |
| 1155 Ripley St Silver Spring, MD | 2.0 | 1.0–2.5 | 859 | $2,274 | $2.65 | 2d | 26 | 0.89mi |
| 1401 Blair Mill Rd Silver Spring, MD | 3.0 | 1.0–2.5 | 960 | $2,096 | $2.18 | 2d | 85 | 0.89mi |
| 1150 Ripley St Silver Spring, MD | 2.0 | 1.0–2.0 | 1013 | $2,758 | $2.72 | 2d | 26 | 0.91mi |
| 815 Pershing Dr Silver Spring, MD | 2.0 | 1.0–2.0 | 793 | $2,314 | $2.92 | 3d | 11 | 0.92mi |
| 8000 Eastern Dr Silver Spring, MD | 1.0–2.0 | 1.0 | 840 | $1,550 | $1.84 | 2d | 16 | 0.93mi |
| 1215 E West Hwy Silver Spring, MD | 2.0 | 1.0–2.0 | 798 | $2,026 | $2.54 | 1d | 14 | 0.93mi |
| 8250 Georgia Ave Silver Spring, MD | 1.0–2.0 | 1.0–2.0 | 763 | $1,720 | $2.25 | 2d | 24 | 0.93mi |
| 8200 Dixon Ave Silver Spring, MD | 1.0–2.0 | 1.0–2.0 | 960 | $2,111 | $2.20 | 3d | 21 | 0.93mi |
| 1200 East-West Hwy Silver Spring, MD | 1.0–2.0 | 1.0–2.5 | 887 | $1,756 | $1.98 | 2d | 20 | 0.95mi |
| 929 Bonifant St Silver Spring, MD | 1.0–2.0 | 1.0 | 827 | $1,321 | $1.60 | 44d | 1 | 0.98mi |
| 8455 Fenton St Silver Spring, MD | 2.0 | 1.0–2.0 | 745 | $2,396 | $3.22 | 1d | 10 | 1.00mi |
| 915 Silver Spring Ave Silver Spring, MD | 2.0 | 1.0–2.0 | 843 | $2,400 | $2.85 | 2d | 37 | 1.02mi |
| 8584 Freyman Dr Chevy Chase, MD | 1.0 | 1.0 | 636 | $1,715 | $2.69 | 44d | 3 | 1.03mi |
| 816 Easley St Silver Spring, MD | 2.0 | 1.0 | 727 | $1,826 | $2.51 | 3d | 36 | 1.07mi |
| 1133 East-West Hwy Silver Spring, MD | 2.0 | 1.0–2.0 | 859 | $2,160 | $2.52 | 2d | 32 | 1.08mi |
| 8005 13th St #403 Silver Spring, MD | 1.0 | 1.0 | 622 | $2,100 | $3.38 | 44d | 1 | 1.16mi |
| 8060 13th St Silver Spring, MD | 2.0 | 1.0–2.0 | 1036 | $1,767 | $1.71 | 3d | 26 | 1.18mi |
| 7915 Eastern Ave #314 Silver Spring, MD | — | 1.0 | 584 | $1,780 | $3.05 | 44d | 1 | 1.20mi |
| 8025 13th St Silver Spring, MD | 1.0–2.0 | 1.0–2.0 | 880 | $1,299 | $1.48 | 2d | 10 | 1.20mi |
| 8021 Georgia Ave Silver Spring, MD | 2.0 | 1.0–2.0 | 934 | $2,248 | $2.41 | 3d | 20 | 1.22mi |
HOA detail condo
- Monthly dues
- $848 · $10,176/yr
- Likely covers
- pooldoorman
- Assessments
- None detected in remarks — confirm with the listing agent.
Listing history 26 events
-
2026-06-18days on market $135,500 Active 139 DOM
-
2026-06-17days on market $135,500 Active 138 DOM
-
2026-06-16days on market $135,500 Active 137 DOM
-
2026-06-15days on market $135,500 Active 136 DOM
-
2026-06-13days on market $135,500 Active 134 DOM
-
2026-06-09days on market $135,500 Active 130 DOM
-
2026-06-08days on market $135,500 Active 129 DOM
-
2026-06-07days on market $135,500 Active 128 DOM
-
2026-06-03days on market $135,500 Active 124 DOM
-
2026-06-02days on market $135,500 Active 123 DOM
-
2026-06-01days on market $135,500 Active 122 DOM
-
2026-05-31days on market $135,500 Active 121 DOM
-
2026-01-31historical
-
2026-01-30$142,000 Active 1679-char remark
Show marketing remark (1679 chars)
Best Value for your money! Fully Renovated AND 2026 Condo fees paid by the seller! Modern & Luxurious Junior One-Bedroom Condo In the heart of Silver Spring! Step into this beautifully renovated, modern home that feels far more spacious than you’d expect. Recently renovated and ready for the new owner with freshly painted, new kitchen cabinets with built-in wine rack, pantry, quartz counters and stainless steel appliances. There's new ceramic flooring throughout the entire unit for easy maintenance, modern light fixtures and recess lighting. The bathroom is fully renovated with oversized ceramic tiles, modern lighting and fixtures. This sun-drenched home features oversized windows that flood the space with natural light, creating an airy, open feel throughout. The roomy layout is paired with generous walk-in closets, giving you both style and serious storage! Located in a well-maintained, pet-friendly community, residents enjoy access to a sparkling pool, roof top deck that offers amazing views, a party room, a community garden and an indoor-laundry center; all conveniently located being steps from dining, shopping, entertainment, and transit. Everything you love about Silver Spring is right outside your door! ALL UTILITIES are included in the condo fee. The property is very well maintained with an on-site and off site management office and concierge services offered 7-days per week (9am-9pm). The community also also allows pets! Homes like this—modern, spacious, renovated, and perfectly located—don’t last long. If you’ve been waiting for the right one, this is it. Schedule your showing now before it’s gone.
-
2025-10-17$155,000 Active
-
2019-04-11soldstatus $110,000
-
2019-04-03soldstatus $110,000 Closed
-
2019-03-25status Pending
-
2019-03-20$115,000 Active
-
2001-07-16soldstatus $40,000
-
2001-07-06soldstatus $40,000
-
2001-05-11historical
-
2001-05-06$39,000
-
1997-07-19historical
-
1997-03-06
-
1979-12-28soldstatus $26,500
ⓘ Source: listings_history table (triggers on properties + properties_extension) + one-shot
backfill from property_details.listing_events for pre-trigger history.
Tax reassessment forecast MD · Partial reset (capped growth)
- Current annual tax
- $1,379 · $115/mo
- Projected year-2 tax
- $1,428 · $119/mo
- Expected delta
- +$49/yr (+$4/mo · 3.6%)
ⓘ Screening estimate from a state-policy table — verify with the county assessor before closing.
Climate risk First Street
- Flood 10/10 Extreme FEMA zone X (unshaded) · 99% chance over 30 yrs
- Wildfire 1/10 Low
- Heat 7/10 Severe 7 d/yr ≥104°F today · 15 d/yr by 30 yrs out
- Wind 4/10 Moderate 17% chance of damaging wind over 30 yrs
- Air quality 4/10 Moderate 5 unhealthy d/yr today · 6 by 30 yrs out
Nearby sold comps map
Loading sold comps map…
Walkable amenities ~0.75 mi
Loading nearby amenities…
Taxation est. · year 1
- Rental income
- $22,807
- − Mortgage interest
- −$7,590
- − Property taxes
- −$1,379
- − Insurance
- −$1,475
- − Repairs & maintenance
- −$1,825
- − Management
- −$1,825
- − HOA
- −$10,176
- − Depreciation
- −$3,942
- Taxable loss
- −$5,404
- Est. tax savings @ 24.0%
- +$1,297
- After-tax cash flow
- $-2,242/yr
For passive investors: Depreciation is non-cash, so a rental often shows a tax loss while cash-flowing — sheltering income. Rental losses are passive: they offset passive income freely, and up to $25,000/yr can offset ordinary (W-2) income if you actively participate and your MAGI is under $100k (phasing out to $0 by $150k); unused losses carry forward. On sale, claimed depreciation is recaptured at up to 25%, and gains may owe capital-gains tax (a 1031 exchange can defer both). Figures are a year-1 estimate at your 24.0% rate — not tax advice; consult a CPA.
Schools (NCES district)
- District
- Montgomery County Public Schools
- NCES district ID
- 2400480
- Math proficiency
- 27% ▼ -21.00%
- Reading proficiency
- 45% ▼ -10.00%
- Median HH income
- $97,191
- Composite
- 35.62/100
- National rank
- #4889
- State rank
- #3 of 24 in MD
Livability — Silver Spring
- Score
- 83/100
- State rank
- #27
- US rank
- #973
Category grades
Schools grade is shown separately in the Schools card above.
Census & demographics
- Census place
- Silver Spring, MD
- County
- Montgomery County · 961,106 people
- City population
- 309,699
- Metro
- Washington-Arlington-Alexandria, DC-VA-MD-WV
- Population (ZIP)
- 45,943
- Household income
- $112,134
- Rent vs Own
- Severe rent burden
- 2855.0
Population outlook (Montgomery County) Hauer SSP2
- Today (2025)
- 1,173,231 people
- By 2030
- 1,237,402 · +5.5%
- By 2040
- 1,365,115 · +16.4%
- By 2050
- 1,491,592 · +27.1%
- By 2075
- 1,803,893 · +53.8%
- By 2100
- 2,035,619 · +73.5%
Race, ethnicity, and origin ACS 2023
- Neighborhood character
- Diverse neighborhood (Simpson 0.69)
- Race & ethnicity
- White 45% Black 29% Hispanic / Latino 12% Two or more races 11% Asian 7%
- Hispanic origin (detail)
- Mexican 2% Puerto Rican 2%
- Common ancestry
- Romanian 3% Italian 3% Slovak 2%
- Foreign-born
- 23% · Canada, China, South Korea
- Languages at home
- 70% English-only · Spanish 10% French/Haitian/Cajun 4% Other Indo-European 3%
Political lean MEDSL · Montgomery
- 2024 margin
- Solid D (+53.3) · D 75.2% · R 21.9% · Other 2.9%
- 2008→2024 swing
- +8.7pp toward D · 2008: 44.6pp · 2024: 53.3pp
- All cycles
- 2024: D+53.3 2020: D+59.6 2016: D+55.5 2012: D+43.4 2008: D+44.6
Not yet ingested
- Civics
- —
Market trends
- HPI YoY
- ▼ -590.43%
- Current HPI
- 310.0087
- Rent YoY
- ▼ -2.26%
- Metro
- Washington-Arlington-Alexandria, DC-VA-MD-WV
- State GDP YoY
- ▲ 2.97%
- F500 in state
- 12
Industry mix (Fortune 500 HQ in MD)
| Industry | F500 HQs | Revenue |
|---|---|---|
| Aerospace / Defense | 1 | $71B |
|
||
| Utilities | 1 | $25B |
|
||
| Hotels | 1 | $24B |
|
||
| Consumer Goods | 1 | $7B |
|
||
| Real Estate | 1 | $6B |
|
||
| Chemicals | 1 | $2B |
|
||
Price history
+435.8% since first listed14 events — show timeline
- 2026-01-31 Listing Removed — BRIGHT MLS
- 2026-01-30 Listed $142,000 BRIGHT MLS
- 2025-10-17 Listed $155,000 BRIGHT MLS
- 2019-04-11 Sold (Public Records) $110,000 Public Records
- 2019-04-03 Sold (MLS) $110,000 BRIGHT MLS
- 2019-03-25 Pending — BRIGHT MLS
- 2019-03-20 Listed $115,000 BRIGHT MLS
- 2001-07-16 Sold (Public Records) $40,000 Public Records
- 2001-07-06 Sold (MLS) $40,000 MRIS
- 2001-05-11 Delisted — MRIS
- 2001-05-06 Listed $39,000 MRIS
- 1997-07-19 Delisted — MRIS
- 1997-03-06 Listed — MRIS
- 1979-12-28 Sold (Public Records) $26,500 Public Records
Property tax history
+0.7%/yrLatest (2025): $1,379 · +5.3% YoY. Source: county tax records.
Cash-flow waterfall
monthlySold comps — $/sqft
last 12 mo · ≤1 miLoading sold comps…