 Multi-family
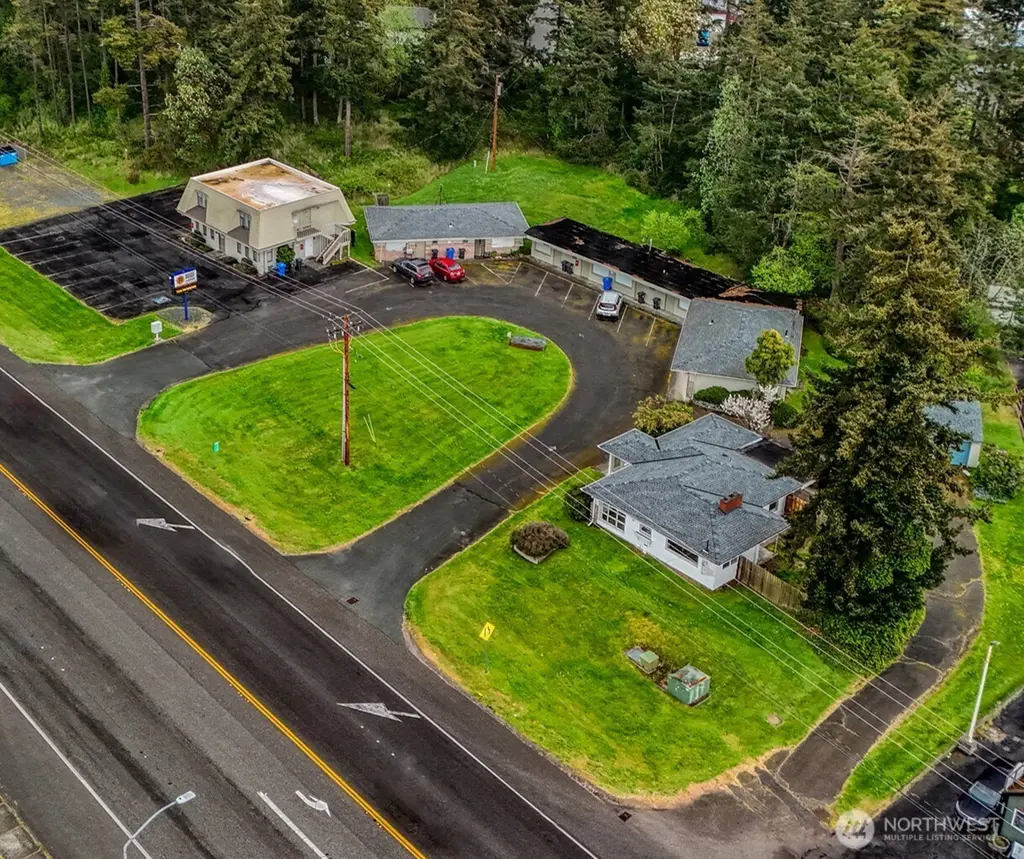
33020 State Route 20 Unit 1-14 · Oak Harbor, WA
Flood risk 1/10 · Minimal
- FEMA flood zone
- X (unshaded)
- Chance of flooding over 30 yrs
- 0.0%
- Est. flood insurance / yr
- $507 – $1,088
Fire risk 3/10 · Minor
- Est. fire insurance / yr
- $604 – $1,122
Heat risk 2/10 · Minimal
- Hot days now (above 78°F)
- 7 days/yr
- Hot days in 30 yrs
- 19 days/yr
Wind risk 1/10 · Minimal
- Chance of severe wind over 30 yrs
- —
Air-quality risk 6/10 · Moderate
- Unhealthy air days now
- 7 days/yr
- Unhealthy air days in 30 yrs
- 7 days/yr
Risk factors via First Street. Map © Google.
Why this score? — see what drove the C+ grade
The composite is a weighted blend of 9 inputs, each scored 0–100. Each bar is that input's sub-score; the figure is the points it added to the 100-point composite (weight × sub-score).
- Cash flow +24.7/30.0
- DSCR +8.0/10.0
- ARV discount +7.5/15.0
- 1% rule +6.4/10.0
- Schools +4.9/10.0
- Livability +3.9/5.0
- Rent growth +3.8/5.0
- Condition / age +2.8/5.0
- Appreciation +0.0/10.0
$2,000,000
🖨 Deal sheet 📄 Offer letter ✓ Due diligence
Multi-family units
County records classify this as Multi-Family (5+ Unit). Listing-text estimate: 1 unit. estimate disagrees with records
5+ unit building — per-unit beds/baths from public records are typically unavailable; the breakdown below (if shown) is an estimate from the listing text.
Listing remarks
Oak Harbor Terrace, a 14-unit multifamily investment opportunity located in Oak Harbor. The property offers investors an attractive combination of stable in-place cash flow and clear upside potential in a supply-constrained rental market supported by Naval Air Station Whidbey Island. Originally constructed in 1959, the property includes approximately 7,295 square feet of net rentable area across three buildings: a fourplex with a ground-floor commercial space, a nine-unit apartment building, and a single-family residence. The efficient unit layouts are well suited to local workforce housing demand. The asset provides meaningful opportunity to enhance income through rental rate growth, utili
Key facts
- 1.45 acre lot
- Garage
- Built 1959
Property features AI
Finance
- Other: Building area total: 7,295 square feet; Lot size approximately 1.4463 acres; Zoning jurisdiction: City
- Financial info: Gross scheduled income: $216,600; Gross adjusted income: $207,936; Total monthly income: $18,050; Net operating income: $146,753; Total expenses: $61,183; Electric expense: $11,501; Insurance expense: $11,455; Other expense: $15,491; Gross rent multiplier: 9.2; Vacancy rate: 4%; Listing terms: Cash or conventional
- HOA & community: On-site coin-operated laundry
Exterior
- Parking: One covered space; One garage space; 22 uncovered parking spaces
- Utilities: Electric energy source; Public water; Sewer connected; Power provided by PSE
- Home design: Residential income property — multi-family building; Single-story structure; Property in good condition; Possible commercial or multi-family use
- Construction: Built (effective) in 1959; Construction materials: cement and wood; Roof types: composition, flat and torch down; Foundation: block and slab
- Exterior features: Cement/concrete and wood exterior; Paved lot
Interior
- Kitchen: Some units include range/oven; Most units include refrigerator; Dishwasher not provided in listed units
- Bedrooms: Mix of 1-bedroom units (various unit sizes)
- Flooring: Laminate; Vinyl plank; Carpet
- Bathrooms: Each unit includes 1 bathroom
- Heating & cooling: Heating provided (baseboard, forced air and wall furnaces); No central air conditioning
- Interior features: Laminate, vinyl plank and carpet flooring
- Laundry & utility: Coin-operated laundry on-site; Most units do not include in-unit washer/dryer
Neighborhood map
What this means for you Summary
Snapshot
- This is a 7-bed/14.0-bath multifamily listed at $2.00M. Condition is rated average.
Deal economics
- At list price, monthly cash flow is $4k ($50k/yr) — positive.
- The deal already cash-flows at list — no discount required.
- Meets the 1% rule at list price ($23k rent vs $2.00M).
- Recommended offer: $1.97M (1.5% below list) — sets the bar for market timing.
- Cap rate 8.8% vs local median 2.7% in Oak Harbor — top-decile yield for the area; either an underpriced asset or a hidden risk that comps aren't pricing in. Stress-test before assuming the spread holds.
Location & tenants
- Location reads 77/100 on livability (#149 in WA, #3,120 nationally) — a middle-class / working-renter tenant base. Strengths: crime A+, health & safety A+, housing A; Watch: amenities D+, cost of living D+.
- Oak Harbor School District (town): math 49% / reading 61% proficiency, ranked #98 of 291 in WA (top 34%) — acceptable for families but not a draw, mixed tenant base, ~2y average lease.
- Market conditions: Rents rising fast (+5.4%/yr); 277 active listings in the ZIP; solid renter incomes; 402 units permitted in Island County in 2024 (54 in 5+ unit buildings).
- At $22,792/mo this rent would consume 329% of the median local household income ($83k/yr) (locally 1359% of renters already pay >50% of income on rent) — very limited rent-growth headroom before tenants either downsize or default.
Forward outlook
- Local home prices are declining (-3.0%/yr); year-one equity from $14k of loan paydown is wiped out by about $60k of value loss. Plan a longer hold.
- Island County population projected to shrink 6% by 2050 — rents likely to lag national; underwrite the cash flow, not the appreciation.
- At projected returns (-3.0% appreciation + 5.4% rent growth), your $560k cash investment doubles in ~9 years — after that, you're playing with house money.
Negotiation context
- It's been on market 15 days — a 2% lower offer ($1.97M) is reasonable based on typical stale-listing flexibility.
Risks & watch-outs
- Watch-outs: built in 1959 — expect roof / HVAC / electrical / plumbing capex.
Questions for the listing agent
- Built in 1959 — when were the roof, HVAC, electrical panel, plumbing, and water heater last replaced?
- Is there a deadline driving the sale (1031 exchange, divorce, estate, relocation)? That informs how much negotiation room exists.
- Schools are B-rated — typically a magnet for longer-tenancy family renters. What's the average tenant stay here, and is there a school-zone premium baked into asking?
- What's the average days-on-market for RENTAL listings here right now (not sales)? A rising rental-DOM trend means longer vacancies and softer asking-rent achievability than the comps imply.
- What's the recent tenant-quality profile in this submarket — average credit score on applications, eviction rate, late-payment / NSF rate, and stable-employment percentage? A property-management company in the area should have these aggregated.
- How much new apartment / multifamily construction is in the pipeline within 1–3 miles? Heavy new supply (>2% of stock underway) typically softens rents 12–24 months out; light construction supports rent growth.
Investment metrics
- 1% rule
- 1.14% ✓
- Cap rate
- 8.80%
- Cash-on-cash
- 8.97%
- DSCR
- 1.40
- GRM
- 7.3
CMA / ARV
No comps found within radius.
Projected returns pro-forma
-3.0% appreciation · 5.36% rent growth · sell at horizon
- IRR
- -0.1%
- Equity multiple
- 1.00×
- Total profit
- $-1,859
- Equity at exit
- $298,207
- IRR
- 11.9%
- Equity multiple
- 2.04×
- Total profit
- $581,497
- Equity at exit
- $172,923
Cash invested: $560,000 (down + closing). Projections, not guarantees.
Landlord ↔ Tenant lean methodology
- Overall (STATE)
- 28 Tenant-Leaning
- State Washington
- 28 Tenant-Leaning · D+8
- County
- — inherits STATE
- City
- — inherits STATE
ZIP-level market 98277
- Rents YoY
- 5.4%
- Active inventory
- 277
- Price-to-rent
- 102.4×
Monthly cashflow live
- Estimated rent
- $22,792 medium interval (Pro) →
- Mortgage (P&I)
- −$10,488
- Tax est. 1.5%
- −$2,500 /mo · $30,000/yr
- Insurance
- −$833
- HOA
- −$0
- Vacancy / Maint / Mgmt
- −$4,786
- Net cashflow
- $4,184
Break-even live
14-unit breakdown (identical units grouped — click to expand)
| Units | Beds | Baths | Est. rent |
|---|---|---|---|
| 14× units | 2 | 1 | $22,792 |
| #1 | 2 | 1 | $1,628 |
| #2 | 2 | 1 | $1,628 |
| #3 | 2 | 1 | $1,628 |
| #4 | 2 | 1 | $1,628 |
| #5 | 2 | 1 | $1,628 |
| #6 | 2 | 1 | $1,628 |
| #7 | 2 | 1 | $1,628 |
| #8 | 2 | 1 | $1,628 |
| #9 | 2 | 1 | $1,628 |
| #10 | 2 | 1 | $1,628 |
| #11 | 2 | 1 | $1,628 |
| #12 | 2 | 1 | $1,628 |
| #13 | 2 | 1 | $1,628 |
| #14 | 2 | 1 | $1,628 |
| Total (14 units) | $22,792 | ||
UW: 25.0% down · 7.5% · 30yr · 1.5% tax · 5.0% vac · 8.0% maint · 8.0% mgmt
Financing live
Cash to close
- Down payment
- $500,000
- Closing costs
- $60,000
- Reserves months
- —
- Total cash needed
- —
Loan-product check · same deal, 3 products live
Conventional
25% down · 7.5% · 30yr
- Down + closing
- —
- Monthly P&I
- —
- Monthly cashflow
- —
- DSCR
- —
- Eligible?
- —
Personal DTI + credit; lowest rate.
DSCR
20% down · 8.5% · 30yr
- Down + closing
- —
- Monthly P&I
- —
- Monthly cashflow
- —
- DSCR
- —
- Eligible?
- —
No personal income docs; deal must DSCR.
Hard money
10% down · 12.0% · 12mo
- Down + closing
- —
- Monthly P&I
- —
- Monthly cashflow
- —
- DSCR
- —
- Eligible?
- —
Short-term bridge; refi at stabilization.
Listing history 12 events
-
2026-06-19days on market $2,000,000 Active 15 DOM
-
2026-06-18days on market $2,000,000 Active 14 DOM
-
2026-06-17days on market $2,000,000 Active 13 DOM
-
2026-06-16days on market $2,000,000 Active 12 DOM
-
2026-06-15days on market $2,000,000 Active 11 DOM
-
2026-06-14days on market $2,000,000 Active 9 DOM
-
2026-06-13days on market $2,000,000 Active 8 DOM
-
2026-06-10days on market $2,000,000 Active 6 DOM
-
2026-06-09days on market $2,000,000 Active 5 DOM
-
2026-06-08days on market $2,000,000 Active 4 DOM
-
2026-06-07remarks 699-char remark
-
2026-06-07$2,000,000 Active 3 DOM
ⓘ Source: listings_history table (triggers on properties + properties_extension) + one-shot
backfill from property_details.listing_events for pre-trigger history.
Climate risk First Street
- Flood 1/10 Low FEMA zone X (unshaded) · 0% chance over 30 yrs
- Wildfire 3/10 Moderate
- Heat 2/10 Low 7 d/yr ≥78°F today · 19 d/yr by 30 yrs out
- Wind 1/10 Low
- Air quality 6/10 Major 7 unhealthy d/yr today · 7 by 30 yrs out
Nearby sold comps map
Loading sold comps map…
Walkable amenities ~0.75 mi
Loading nearby amenities…
Taxation est. · year 1
- Rental income
- $273,504
- − Mortgage interest
- −$112,031
- − Property taxes
- −$30,000
- − Insurance
- −$10,000
- − Repairs & maintenance
- −$21,880
- − Management
- −$21,880
- − Depreciation
- −$58,182
- Taxable income
- $19,530
- Est. tax owed @ 24.0%
- −$4,687
- After-tax cash flow
- $45,522/yr
For passive investors: Depreciation is non-cash, so a rental often shows a tax loss while cash-flowing — sheltering income. Rental losses are passive: they offset passive income freely, and up to $25,000/yr can offset ordinary (W-2) income if you actively participate and your MAGI is under $100k (phasing out to $0 by $150k); unused losses carry forward. On sale, claimed depreciation is recaptured at up to 25%, and gains may owe capital-gains tax (a 1031 exchange can defer both). Figures are a year-1 estimate at your 24.0% rate — not tax advice; consult a CPA.
Condition & rehab AI · 13 photos
The property is in average condition with moderate rehabilitation needs. Repairs and maintenance would significantly improve its appearance and functionality, enhancing its resale and rental value.
Repairs flagged
- Minor kitchen cabinets — slight wear
- Minor bathroom fixtures — slight wear
- Moderate HVAC units — visible wear
Value-add opportunities
- Both paint interior walls — enhances curb appeal and interior aesthetics
- Both replace carpet in living room — improves comfort and appearance
- Both repair kitchen cabinets — enhances functionality and appearance
- Both repair bathroom fixtures — enhances functionality and appearance
- Both service HVAC units — improves comfort and energy efficiency
Renovation cost estimate screening
| Repair item | Severity | Est. cost |
|---|---|---|
| kitchen cabinets · slight wear | Minor | $500–3,000 |
| bathroom fixtures · slight wear | Minor | $500–3,000 |
| HVAC units · visible wear | Moderate | $3,000–15,000 |
| Total estimated repair cost · 3 items | $4,000–21,000 |
Value-add ROI direction
- Both paint interior walls — enhances curb appeal and interior aesthetics ↑
- Both replace carpet in living room — improves comfort and appearance ↑
- Both repair kitchen cabinets — enhances functionality and appearance ↑
- Both repair bathroom fixtures — enhances functionality and appearance ↑
- Both service HVAC units — improves comfort and energy efficiency ↑
ⓘ Cost ranges are severity-bucket heuristics (US national rule-of-thumb). Get contractor quotes + a written scope before underwriting a rehab budget.
Schools (NCES district)
- District
- Oak Harbor School District
- NCES district ID
- 5305940
- Math proficiency
- 49% ▲ 1.00%
- Reading proficiency
- 61% ▲ 1.00%
- Median HH income
- $53,606
- Composite
- 49.07/100
- National rank
- #4427
- State rank
- #98 of 291 in WA
Livability — Oak Harbor
- Score
- 77/100
- State rank
- #149
- US rank
- #3120
Category grades
Schools grade is shown separately in the Schools card above.
Census & demographics
- Census place
- Oak Harbor, WA
- County
- Island County · 71,196 people
- City population
- 40,917
- Metro
- Oak Harbor, WA
- Population (ZIP)
- 40,917
- Household income
- $83,253
- Rent vs Own
- Severe rent burden
- 1359.0
Population outlook (Island County) Hauer SSP2
- Today (2025)
- 82,019 people
- By 2030
- 81,329 · -0.8%
- By 2040
- 78,552 · -4.2%
- By 2050
- 77,042 · -6.1%
- By 2075
- 80,799 · -1.5%
- By 2100
- 84,451 · +3.0%
Race, ethnicity, and origin ACS 2023
- Neighborhood character
- Predominantly White (66%)
- Race & ethnicity
- White 66% Two or more races 14% Hispanic / Latino 12% Asian 8% Black 4%
- Hispanic origin (detail)
- Mexican 9%
- Common ancestry
- Portuguese 4% Slovak 3% Iranian 3%
- Foreign-born
- 9% · Canada, Vietnam
- Languages at home
- 87% English-only · Spanish 5% Tagalog/Filipino 4% Other Asian/Pacific 1%
Political lean MEDSL · Island
- 2024 margin
- D (+16.6) · D 56.8% · R 40.3% · Other 2.9%
- 2008→2024 swing
- +10.3pp toward D · 2008: 6.2pp · 2024: 16.6pp
- All cycles
- 2024: D+16.6 2020: D+12.0 2016: D+5.9 2012: D+4.4 2008: D+6.2
Not yet ingested
- Civics
- —
Market trends
- HPI YoY
- ▼ -608.47%
- Current HPI
- 188.2874
- Rent YoY
- ▲ 5.36%
- Metro
- Oak Harbor, WA
- State GDP YoY
- ▲ 4.65%
- F500 in state
- 22
Industry mix (Fortune 500 HQ in WA)
| Industry | F500 HQs | Revenue |
|---|---|---|
| Retail | 2 | $269B |
|
||
| Technology / Retail | 1 | $638B |
|
||
| Technology | 1 | $245B |
|
||
| Telecommunications | 1 | $38B |
|
||
| Food / Beverage | 1 | $36B |
|
||
| Automotive / Trucks | 1 | $34B |
|
||
Price history
1 event — show timeline
- 2026-06-04 Listed $2,000,000 NWMLS as Distributed by MLS Grid
Cash-flow waterfall
monthlySold comps — $/sqft
last 12 mo · ≤1 miLoading sold comps…