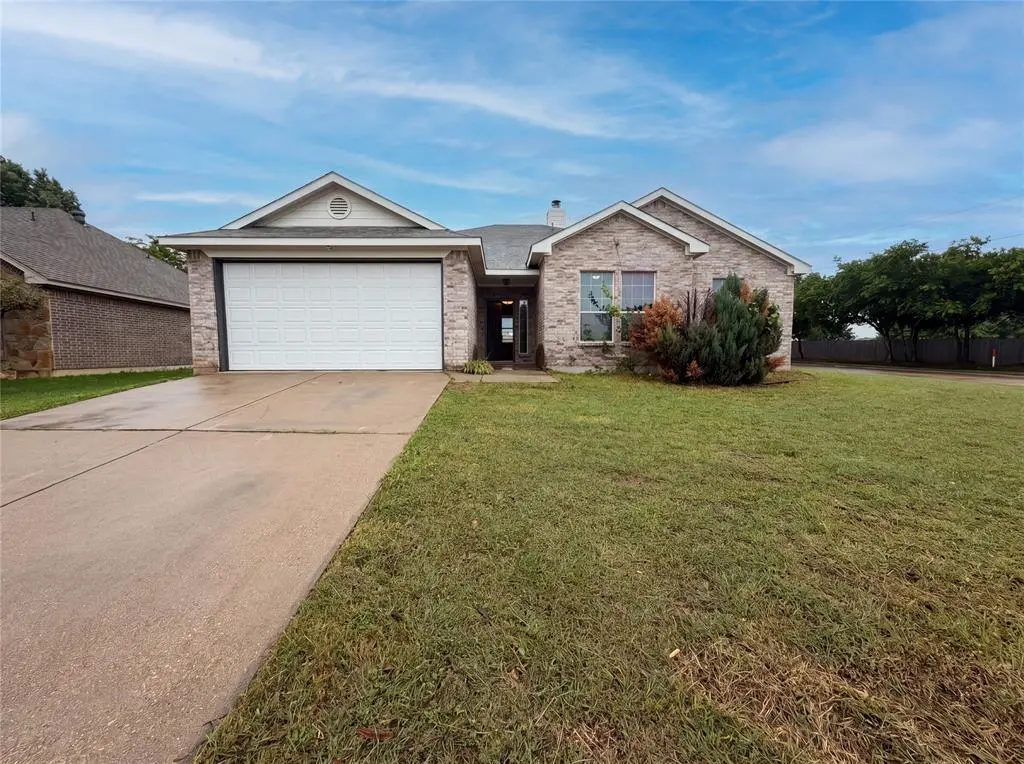
1100 Whispering Mdws · Crowley, TX
Flood risk 1/10 · Minimal
- FEMA flood zone
- X (unshaded)
- Chance of flooding over 30 yrs
- 0.0%
- Est. flood insurance / yr
- $507 – $1,088
Fire risk 4/10 · Minor
- Est. fire insurance / yr
- $1,222 – $2,270
Heat risk 7/10 · Major
- Hot days now (above 108°F)
- 7 days/yr
- Hot days in 30 yrs
- 25 days/yr
Wind risk 4/10 · Minor
- Chance of severe wind over 30 yrs
- 24.0%
Air-quality risk 3/10 · Minor
- Unhealthy air days now
- 2 days/yr
- Unhealthy air days in 30 yrs
- 3 days/yr
Risk factors via First Street. Map © Google.
Why this score? — see what drove the D- grade
The composite is a weighted blend of 9 inputs, each scored 0–100. Each bar is that input's sub-score; the figure is the points it added to the 100-point composite (weight × sub-score).
- ARV discount +10.4/15.0
- Cash flow +10.1/30.0
- 1% rule +3.8/10.0
- Livability +3.8/5.0
- Rent growth +3.1/5.0
- DSCR +2.9/10.0
- Schools +2.5/10.0
- Condition / age +2.5/5.0
- Appreciation +0.0/10.0
$275,000
🖨 Deal sheet 📄 Offer letter ✓ Due diligence
Listing remarks MLS
Single story brick home with 4 bedroom, 2 bath home with 2,023 sqft of living space and sits on a large corner lot. The home features a formal dining area and eat in kitchen. Spacious living area with wood burning fireplace. HUD home to be sold as is. HUD case #492-816938 Buyer to verify all information wherein. Sq ft information is from FHA appraisal and is deemed accurate but not guaranteed.
Key facts
- Double sinks
- New flooring
- Fresh interior paint
Tags
Property features AI
Finance
- Other: Standard listing conditions; Possession at closing/funding
- Financial info: Acceptable financing: Cash, Conventional, VA
- HOA & community: No homeowners association
Exterior
- Parking: 2 covered parking spaces; 2-car attached garage; Driveway
- Security: Security system does not convey; Kwikset lock will be replaced at closing
- Utilities: City water; No municipal utility district
- Home design: Single-family residence; Residential property; Built in 2006; Not attached to another unit
- Construction: Brick construction; Slab foundation
- Exterior features: Back yard fencing; Corner lot
Interior
- Kitchen: Dishwasher
- Bedrooms: 4 bedrooms (primary bedroom on main level)
- Flooring: Ceramic tile; Concrete; Laminate
- Bathrooms: 2 full bathrooms
- Heating & cooling: Central heating; Central electric air conditioning
- Interior features: One-level layout; Two dining areas; One living area; Other interior features
- Laundry & utility: No specific laundry appliances listed
Neighborhood map
What this means for you Summary
Snapshot
- This is a 4-bed/2.0-bath single-family listed at $275k.
Deal economics
- At list price, monthly cash flow is $-162 ($-2k/yr) — negative.
- To cash-flow at today's rent, offer at most $246k (10.4% below list).
- To meet the 1% rule (rent ≥ 1% of price), the offer needs to be $243k (11.8% below list).
- Recommended offer: $243k (11.8% below list) — sets the bar for 1% rule.
- Cap rate 5.6% vs local median 4.5% in Crowley — meaningfully above typical; check what's discounted (condition, days-on-market, listing class) to confirm the premium yield is real.
Location & tenants
- Location reads 76/100 on livability (#103 in TX, #3,462 nationally) — a middle-class / working-renter tenant base. Strengths: cost of living A+, housing A+, health & safety A+; Watch: amenities F, commute F.
- Crowley ISD (urban): math 23% / reading 32% proficiency, ranked #643 of 826 in TX (top 78%) — low school quality limits family demand, transient renter base, plan for 1-2y turnover.
- Zoned schools: Bess Race El (math 28% / reading 32%, grade F, #2,500 of 4,322 statewide, top 58%, 665 students, 77% FRL) — zoned schools average 77% FRL vs 52% district-wide (26 pts higher); higher-poverty schools than district average — tighter screening recommended.
- Market conditions: Rents rising (+2.3%/yr); 1018 active listings in the ZIP; 40 comparable units currently listed for rent nearby; rentals at typical pace (median 25d on market — plan ~3-4 weeks tenant-placement turnaround); solid renter incomes; 18,938 units permitted in Tarrant County in 2024 (8,336 in 5+ unit buildings).
Forward outlook
- Local home prices are declining (-3.0%/yr); year-one equity from $2k of loan paydown is wiped out by about $8k of value loss. Plan a longer hold.
- Tarrant County population projected at +41% by 2050 — long-run rental-demand tailwind backs the buy-and-hold thesis.
Negotiation context
- It's been on market 33 days — a 3% lower offer ($267k) is reasonable based on typical stale-listing flexibility.
- 3 sale attempts since 18y ago with the ask held roughly flat each time — persistent listings suggest the price (not the market) is what's stuck; bring a comps-based counter.
Risks & watch-outs
- Climate carrying-cost: extreme-heat days projected 7→25/yr by 2055 (HVAC capex compounding) — expect insurance premiums to compound above CPI over the hold.
Questions for the listing agent
- What do current leases actually rent for vs. the listed asking? Can we see a recent rent roll and the last 12 months of T-12 income?
- It's been on market 33 days. Have you received any prior offers? Is the seller open to a 12% concession, seller financing, or rate buy-down credit?
- Is there a deadline driving the sale (1031 exchange, divorce, estate, relocation)? That informs how much negotiation room exists.
- Schools are D-rated, which usually means shorter tenancies and higher turnover. Who's the typical renter profile here, and what's been the actual vacancy rate?
- The area grade is low — what's the realistic commute time and amenity access for the typical tenant pool here? Any planned neighborhood developments (good or bad) we should know about?
- What's the average days-on-market for RENTAL listings here right now (not sales)? A rising rental-DOM trend means longer vacancies and softer asking-rent achievability than the comps imply.
- What's the recent tenant-quality profile in this submarket — average credit score on applications, eviction rate, late-payment / NSF rate, and stable-employment percentage? A property-management company in the area should have these aggregated.
- How much new for-sale + rental construction is in the pipeline within 1–3 miles? Heavy new supply typically softens prices + rents 12–24 months out; constrained supply supports both.
Investment metrics
- 1% rule
- 0.88% ✗
- Cap rate
- 5.59%
- Cash-on-cash
- -2.53%
- DSCR
- 0.89
- GRM
- 9.4
CMA / ARV
- ARV (median comp)
- $293,769
- List price
- $275,000
- Delta
- -6.39%
- Verdict
- FAIR
- Comps
- 20 within 1.0 mi
Show comp detail 12 sales within ~0.75 mi
| Address | Dist | Beds/Ba | Sqft | Sold | Price | $/sf | Match |
|---|---|---|---|---|---|---|---|
| 505 Park Meadows Dr | 0.13mi | 4/2.0 | 2,018 (-0%) | 1mo | $275,000 | $136 | 93 |
| 1151 Whispering Mdws | 0.15mi | 4/2.0 | 2,042 (+1%) | 2mo | $295,000 | $144 | 90 |
| 1217 Meadow Gln | 0.14mi | 4/2.0 | 1,984 (-2%) | 1mo | $293,000 | $148 | 89 |
| 424 Shady Shore Ln | 0.08mi | 5/2.0 (+1) | 2,276 (+12%) | 2mo | $319,000 | $140 | 69 |
| 801 Redbud St | 0.37mi | 3/2.0 (-1) | 1,944 (-4%) | 2mo | $235,000 | $121 | 69 |
| 477 Bank Way | 0.19mi | 4/2.5 | 2,285 (+13%) | 1mo | $327,000 | $143 | 67 |
| 1009 Tarryhill Dr | 0.34mi | 3/2.0 (-1) | 1,845 (-9%) | 1mo | $317,990 | $172 | 64 |
| 1160 Greenlee Dr | 0.31mi | 4/2.0 | 1,764 (-13%) | 1mo | $329,990 | $187 | 63 |
| 620 Horn St | 0.47mi | 4/2.0 | 1,790 (-12%) | 1mo | $266,000 | $149 | 58 |
| 620 S Heights Dr | 0.37mi | 3/2.0 (-1) | 1,785 (-12%) | 2mo | $295,000 | $165 | 57 |
| 513 Creekbend St | 0.52mi | 4/2.5 | 2,270 (+12%) | 3mo | $320,000 | $141 | 51 |
| 10450 Fort Cibolo Trl | 0.71mi | 4/3.0 | 2,315 (+14%) | 1mo | $319,900 | $138 | 38 |
Match score weights: distance 35% · size 25% · config 20% · recency 20%. Top-matched comps best support the ARV.
Projected returns pro-forma
-3.0% appreciation · 2.28% rent growth · sell at horizon
- IRR
- -21.3%
- Equity multiple
- 0.27×
- Total profit
- $-56,490
- Equity at exit
- $41,003
- IRR
- -16.7%
- Equity multiple
- 0.10×
- Total profit
- $-68,955
- Equity at exit
- $23,777
Cash invested: $77,000 (down + closing). Projections, not guarantees.
Landlord ↔ Tenant lean methodology
- Overall (STATE)
- 87 Strongly Landlord-Friendly
- State Texas
- 87 Strongly Landlord-Friendly · R+5
- County
- — inherits STATE
- City
- — inherits STATE
ZIP-level market 76036
- Home prices YoY
- -25.2%
- Rents YoY
- 2.3%
- Active inventory
- 1018
- Price-to-rent
- 9.4×
Monthly cashflow live
- Estimated rent
- $2,426 high interval (Pro) →
- Mortgage (P&I)
- −$1,442
- Tax from tax record
- −$522 /mo · $6,264/yr
- Insurance
- −$115
- HOA
- −$0
- Vacancy / Maint / Mgmt
- −$509
- Net cashflow
- $-162
Break-even live
UW: 25.0% down · 7.5% · 30yr · 1.5% tax · 5.0% vac · 8.0% maint · 8.0% mgmt
Financing live
Cash to close
- Down payment
- $68,750
- Closing costs
- $8,250
- Reserves months
- —
- Total cash needed
- —
Loan-product check · same deal, 3 products live
Conventional
25% down · 7.5% · 30yr
- Down + closing
- —
- Monthly P&I
- —
- Monthly cashflow
- —
- DSCR
- —
- Eligible?
- —
Personal DTI + credit; lowest rate.
DSCR
20% down · 8.5% · 30yr
- Down + closing
- —
- Monthly P&I
- —
- Monthly cashflow
- —
- DSCR
- —
- Eligible?
- —
No personal income docs; deal must DSCR.
Hard money
10% down · 12.0% · 12mo
- Down + closing
- —
- Monthly P&I
- —
- Monthly cashflow
- —
- DSCR
- —
- Eligible?
- —
Short-term bridge; refi at stabilization.
Rent comps 40 comps
| Address | Beds | Baths | Sqft | Rent | $/sqft | DOM | Units | Dist |
|---|---|---|---|---|---|---|---|---|
| 1136 Park Gln Crowley, TX | 3.0 | 2.0 | 1487 | $2,000 | $1.34 | 12d | 1 | 0.13mi |
| 636 Horn St Crowley, TX | 3.0 | 2.0 | 1804 | $1,980 | $1.10 | 5d | 1 | 0.42mi |
| 573 Creekbend St Crowley, TX | 3.0 | 2.0 | 1874 | $2,230 | $1.19 | 2d | 1 | 0.44mi |
| 10316 Fort Teran Trl Crowley, TX | 3.0 | 2.0 | 1501 | $2,199 | $1.47 | 12d | 1 | 0.45mi |
| 672 S Heights Dr Crowley, TX | 4.0 | 3.0 | 2136 | $2,345 | $1.10 | 22d | 1 | 0.46mi |
| 10381 Fort Ewell Trl Crowley, TX | 3.0 | 2.0 | 1494 | $2,149 | $1.44 | 43d | 1 | 0.46mi |
| 10344 Fort Teran Trl Crowley, TX | 3.0 | 2.0 | 1494 | $2,149 | $1.44 | 43d | 1 | 0.48mi |
| 10356 Fort Teran Trl Crowley, TX | 3.0 | 2.0 | 1508 | $2,169 | $1.44 | 43d | 1 | 0.49mi |
| 517 Creekbend St Crowley, TX | 4.0 | 2.5 | 2552 | $2,385 | $0.93 | 2d | 1 | 0.51mi |
| 1145 Maplewood Ln Crowley, TX | 5.0 | 2.5 | 2992 | $2,550 | $0.85 | 2d | 1 | 0.52mi |
| 404 Canoe Way Crowley, TX | 4.0 | 2.0 | 1827 | $2,195 | $1.20 | 19d | 1 | 0.52mi |
| 432 Canoe Way Crowley, TX | 3.0 | 2.0 | 1589 | $1,985 | $1.25 | 2d | 1 | 0.53mi |
| 1208 Boxwood Dr Crowley, TX | 3.0 | 2.0 | 1677 | $2,095 | $1.25 | 24d | 1 | 0.56mi |
| 1004 Junegrass Ln Crowley, TX | 4.0 | 2.5 | 2329 | $2,145 | $0.92 | 19d | 1 | 0.58mi |
| 525 Canoe Way Crowley, TX | 4.0 | 2.5 | 2406 | $2,340 | $0.97 | 43d | 1 | 0.60mi |
| 520 Horn St Crowley, TX | 4.0 | 2.5 | 2095 | $2,290 | $1.09 | 24d | 1 | 0.60mi |
| 10373 Fort Belknap Trl Crowley, TX | 4.0 | 2.0 | 1780 | $2,160 | $1.21 | 43d | 1 | 0.62mi |
| 1020 Junegrass Ln Crowley, TX | 5.0 | 2.5 | 2996 | $2,575 | $0.86 | 24d | 1 | 0.62mi |
| 1213 Gardenia Ln Crowley, TX | 3.0 | 2.0 | 1501 | $2,170 | $1.45 | 43d | 1 | 0.62mi |
| 10432 Fort Bird Trl Crowley, TX | 4.0 | 2.0 | 2100 | $3,000 | $1.43 | 43d | 1 | 0.63mi |
| 4118 Tobin Dr Crowley, TX | 4.0 | 2.5 | 2139 | $2,495 | $1.17 | 43d | 1 | 0.65mi |
| 10406 Fort Cibolo Trl Crowley, TX | 4.0 | 2.0 | 1808 | $1,900 | $1.05 | 43d | 1 | 0.65mi |
| 10368 Fort Crockett Trl Crowley, TX | 4.0 | 2.0 | 1905 | $2,150 | $1.13 | 24d | 1 | 0.66mi |
| 4117 Tobin Dr Crowley, TX | 3.0 | 2.5 | 1900 | $2,295 | $1.21 | 2d | 1 | 0.68mi |
| 4140 Tobin Dr Crowley, TX | 3.0 | 2.5 | 1900 | $2,395 | $1.26 | 43d | 1 | 0.69mi |
| 4144 Tower Ln Crowley, TX | 3.0 | 2.0 | 1528 | $2,175 | $1.42 | 2d | 1 | 0.71mi |
| 4226 Tobin Dr Crowley, TX | 3.0–4.0 | 2.5 | 2019 | $2,495 | $1.24 | 1d | 5 | 0.75mi |
| 1113 Switchgrass Ln Crowley, TX | 3.0 | 2.5 | 2196 | $2,195 | $1.00 | 43d | 1 | 0.77mi |
| 4212 Pont du Gard Way Crowley, TX | 3.0 | 2.0 | 1720 | $6,100 | $3.55 | 43d | 1 | 0.78mi |
| 1149 Beaverwood Ln Crowley, TX | 3.0 | 2.0 | 1552 | $1,895 | $1.22 | 12d | 1 | 0.81mi |
| 1137 Junegrass Ln Crowley, TX | 3.0 | 2.0 | 1768 | $2,150 | $1.22 | 43d | 1 | 0.82mi |
| 1157 Beaverwood Ln Crowley, TX | 4.0 | 3.0 | 2244 | $2,200 | $0.98 | 43d | 1 | 0.82mi |
| 1032 Verde Valley Ln Crowley, TX | 3.0 | 2.5 | 2145 | $2,400 | $1.12 | 18d | 1 | 0.82mi |
| 4268 Tower Ln Crowley, TX | 4.0 | 2.5 | 2368 | $2,540 | $1.07 | 2d | 1 | 0.83mi |
| 1013 Verde Valley Ln Crowley, TX | 4.0 | 2.5 | 2225 | $2,400 | $1.08 | 24d | 1 | 0.86mi |
| 4148 Crooked Bend Dr Crowley, TX | 3.0 | 2.0 | 1450 | $2,100 | $1.45 | 12d | 1 | 0.97mi |
| 4148 Crooked Bend Dr Crowley, TX | 3.0 | 2.0 | 1469 | $2,100 | $1.43 | 24d | 1 | 0.97mi |
| 1017 Wheatfield Ln Crowley, TX | 3.0 | 2.0 | 1552 | $2,145 | $1.38 | 22d | 1 | 0.98mi |
| 305 W FM 1187 Crowley, TX | 1.0–3.0 | 1.0–2.0 | 1181 | $4,194 | $3.55 | 1d | 23 | 0.98mi |
| 412 Riverbed Dr Crowley, TX | 3.0 | 2.0 | 1638 | $2,100 | $1.28 | 43d | 1 | 1.03mi |
Listing history 13 events
-
2026-06-02statusdays on market $275,000 Pending 33 DOM
-
2026-06-01days on market $275,000 Active Option Contract 32 DOM
-
2026-05-31days on market $275,000 Active Option Contract 31 DOM
-
2026-05-14historical Active Option Contract 596-char remark
-
2026-04-30$275,000 Active 596-char remark
-
2026-04-08soldstatus
-
2013-07-16soldstatus Closed 396-char remark
Show marketing remark (396 chars)
Single story brick home with 4 bedroom, 2 bath home with 2,023 sqft of living space and sits on a large corner lot. The home features a formal dining area and eat in kitchen. Spacious living area with wood burning fireplace. HUD home to be sold as is. HUD case #492-816938 Buyer to verify all information wherein. Sq ft information is from FHA appraisal and is deemed accurate but not guaranteed.
-
2013-05-06status Pending 396-char remark
Show marketing remark (396 chars)
Single story brick home with 4 bedroom, 2 bath home with 2,023 sqft of living space and sits on a large corner lot. The home features a formal dining area and eat in kitchen. Spacious living area with wood burning fireplace. HUD home to be sold as is. HUD case #492-816938 Buyer to verify all information wherein. Sq ft information is from FHA appraisal and is deemed accurate but not guaranteed.
-
2013-04-29historical Active Contingent 396-char remark
Show marketing remark (396 chars)
Single story brick home with 4 bedroom, 2 bath home with 2,023 sqft of living space and sits on a large corner lot. The home features a formal dining area and eat in kitchen. Spacious living area with wood burning fireplace. HUD home to be sold as is. HUD case #492-816938 Buyer to verify all information wherein. Sq ft information is from FHA appraisal and is deemed accurate but not guaranteed.
-
2013-04-19$95,000 Active 396-char remark
Show marketing remark (396 chars)
Single story brick home with 4 bedroom, 2 bath home with 2,023 sqft of living space and sits on a large corner lot. The home features a formal dining area and eat in kitchen. Spacious living area with wood burning fireplace. HUD home to be sold as is. HUD case #492-816938 Buyer to verify all information wherein. Sq ft information is from FHA appraisal and is deemed accurate but not guaranteed.
-
2008-08-29soldstatus
Show marketing remark (217 chars)
Cute starter home on corner lot, nuetral colors, ready for move in! 4 beds, all good size, overiszed master bath, kitchen has flat surface stove, lots of counter & cabinet space & island. Close to schools.
-
2008-07-28historical
Show marketing remark (217 chars)
Cute starter home on corner lot, nuetral colors, ready for move in! 4 beds, all good size, overiszed master bath, kitchen has flat surface stove, lots of counter & cabinet space & island. Close to schools.
-
2008-07-09$129,900
Show marketing remark (217 chars)
Cute starter home on corner lot, nuetral colors, ready for move in! 4 beds, all good size, overiszed master bath, kitchen has flat surface stove, lots of counter & cabinet space & island. Close to schools.
ⓘ Source: listings_history table (triggers on properties + properties_extension) + one-shot
backfill from property_details.listing_events for pre-trigger history.
Tax reassessment forecast TX · Resets to sale price
- Current annual tax
- $6,264 · $522/mo
- Projected year-2 tax
- $6,264 · $522/mo
- Expected delta
- $0/yr ($0/mo · 0.0%)
ⓘ Screening estimate from a state-policy table — verify with the county assessor before closing.
Climate risk First Street
- Flood 1/10 Low FEMA zone X (unshaded) · 0% chance over 30 yrs
- Wildfire 4/10 Moderate
- Heat 7/10 Severe 7 d/yr ≥108°F today · 25 d/yr by 30 yrs out
- Wind 4/10 Moderate 24% chance of damaging wind over 30 yrs
- Air quality 3/10 Moderate 2 unhealthy d/yr today · 3 by 30 yrs out
Nearby sold comps map
Loading sold comps map…
Walkable amenities ~0.75 mi
Loading nearby amenities…
Taxation est. · year 1
- Rental income
- $29,112
- − Mortgage interest
- −$15,404
- − Property taxes
- −$6,264
- − Insurance
- −$1,375
- − Repairs & maintenance
- −$2,329
- − Management
- −$2,329
- − Depreciation
- −$8,000
- Taxable loss
- −$6,589
- Est. tax savings @ 24.0%
- +$1,581
- After-tax cash flow
- $-365/yr
For passive investors: Depreciation is non-cash, so a rental often shows a tax loss while cash-flowing — sheltering income. Rental losses are passive: they offset passive income freely, and up to $25,000/yr can offset ordinary (W-2) income if you actively participate and your MAGI is under $100k (phasing out to $0 by $150k); unused losses carry forward. On sale, claimed depreciation is recaptured at up to 25%, and gains may owe capital-gains tax (a 1031 exchange can defer both). Figures are a year-1 estimate at your 24.0% rate — not tax advice; consult a CPA.
Schools (NCES district)
- District
- Crowley ISD
- NCES district ID
- 4815910
- Math proficiency
- 23% ▼ -15.00%
- Reading proficiency
- 32% ▼ -6.00%
- Median HH income
- $59,810
- Composite
- 25.04/100
- National rank
- #7549
- State rank
- #643 of 826 in TX
Livability — Crowley
- Score
- 76/100
- State rank
- #103
- US rank
- #3462
Category grades
Schools grade is shown separately in the Schools card above.
Census & demographics
- Census place
- Crowley, TX
- County
- Tarrant County · 2,033,669 people
- City population
- 36,044
- Metro
- Dallas-Fort Worth-Arlington, TX
- Population (ZIP)
- 36,044
- Household income
- $97,973
- Rent vs Own
- Severe rent burden
- 584.0
Population outlook (Tarrant County) Hauer SSP2
- Today (2025)
- 2,380,417 people
- By 2030
- 2,578,900 · +8.3%
- By 2040
- 2,974,995 · +25.0%
- By 2050
- 3,350,489 · +40.8%
- By 2075
- 4,216,909 · +77.2%
- By 2100
- 4,741,527 · +99.2%
Race, ethnicity, and origin ACS 2023
- Neighborhood character
- Diverse neighborhood (Simpson 0.65)
- Race & ethnicity
- White 48% Hispanic / Latino 28% Black 20% Two or more races 14% Asian 2%
- Hispanic origin (detail)
- Mexican 23% Puerto Rican 2%
- Common ancestry
- Slovak 3% Italian 2% Serbian 1%
- Foreign-born
- 8% · Canada, Vietnam
- Languages at home
- 79% English-only · Spanish 18% Other Indo-European 1% Vietnamese 1%
Political lean MEDSL · Tarrant
- 2024 margin
- Lean R (+5.1) · D 46.7% · R 51.9% · Other 1.4%
- 2008→2024 swing
- +6.6pp toward D · 2008: -11.7pp · 2024: -5.1pp
- All cycles
- 2024: R+5.1 2020: D+0.2 2016: R+8.7 2012: R+15.7 2008: R+11.7
Not yet ingested
- Civics
- —
Market trends
- HPI YoY
- ▼ -80.45%
- Current HPI
- 238.6365
- Rent YoY
- ▲ 2.28%
- Metro
- Dallas-Fort Worth-Arlington, TX
- State GDP YoY
- ▲ 3.95%
- F500 in state
- 110
Industry mix (Fortune 500 HQ in TX)
| Industry | F500 HQs | Revenue |
|---|---|---|
| Energy | 16 | $1,198B |
|
||
| Technology | 5 | $198B |
|
||
| Engineering / Construction | 4 | $72B |
|
||
| Energy Services | 3 | $60B |
|
||
| Utilities | 3 | $41B |
|
||
| Healthcare | 2 | $330B |
|
||
Price history
+111.7% since first listed11 events — show timeline
- 2026-06-02 Pending — NTREIS
- 2026-05-14 Contingent — NTREIS
- 2026-04-30 Listed $275,000 NTREIS
- 2026-04-08 Sold (Public Records) — Public Records
- 2013-07-16 Sold (MLS) — NTREIS
- 2013-05-06 Pending — NTREIS
- 2013-04-29 Contingent — NTREIS
- 2013-04-19 Listed $95,000 NTREIS
- 2008-08-29 Sold (MLS) — NTREIS
- 2008-07-28 Listing Removed — NTREIS
- 2008-07-09 Listed $129,900 NTREIS
Property tax history
+3.5%/yrLatest (2025): $6,264 · +10.5% YoY. Source: county tax records.
Cash-flow waterfall
monthlySold comps — $/sqft
last 12 mo · ≤1 miLoading sold comps…