 Multi-family
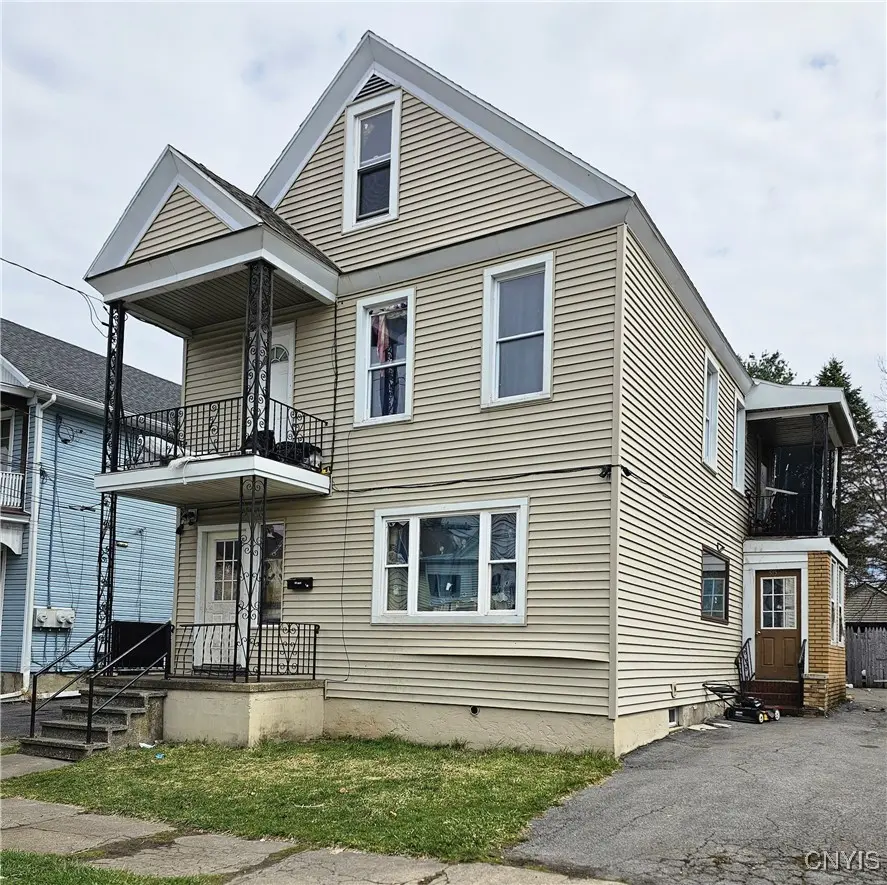
515 Nichols St · Utica, NY
Flood risk 1/10 · Minimal
- FEMA flood zone
- X (unshaded)
- Chance of flooding over 30 yrs
- 0.0%
- Est. flood insurance / yr
- $473 – $860
Fire risk 3/10 · Minor
- Est. fire insurance / yr
- $691 – $1,283
Heat risk 3/10 · Minor
- Hot days now (above 95°F)
- 7 days/yr
- Hot days in 30 yrs
- 17 days/yr
Wind risk 2/10 · Minimal
- Chance of severe wind over 30 yrs
- 1.0%
Air-quality risk 2/10 · Minimal
- Unhealthy air days now
- 0 days/yr
- Unhealthy air days in 30 yrs
- 1 days/yr
Risk factors via First Street. Map © Google.
Why this score? — see what drove the B grade
The composite is a weighted blend of 9 inputs, each scored 0–100. Each bar is that input's sub-score; the figure is the points it added to the 100-point composite (weight × sub-score).
- Cash flow +21.9/30.0
- ARV discount +15.0/15.0
- Appreciation +10.0/10.0
- DSCR +7.0/10.0
- 1% rule +5.2/10.0
- Livability +4.0/5.0
- Schools +2.9/10.0
- Rent growth +2.5/5.0
- Condition / age +2.5/5.0
$189,900
🖨 Deal sheet 📄 Offer letter ✓ Due diligence
Multi-family units
County records classify this as Multi-Family (2-4 Unit). Listing-text estimate: 1 unit. estimate disagrees with records
Key facts
- Garage
- Built 1887
- Listed 247 days
Neighborhood map
What this means for you Summary
Snapshot
- This is a 5-bed/3.0-bath multifamily listed at $190k.
Deal economics
- At list price, monthly cash flow is $299 ($4k/yr) — positive.
- The deal already cash-flows at list — no discount required.
- Meets the 1% rule at list price ($2k rent vs $190k).
- Recommended offer: $167k (12.0% below list) — sets the bar for market timing.
Location & tenants
- Location reads 80/100 on livability (#104 in NY, #1,589 nationally) — a professional / high-income tenant draw. Strengths: commute A+, cost of living A+, housing A+; Watch: employment D, schools D-, crime F.
- Utica City School District (urban): math 33% / reading 38% proficiency, ranked #562 of 590 in NY (top 95%) — families likely to look elsewhere, expect single-tenant / working-renter base with shorter leases; 71% free/reduced lunch — lower-income household profile, screen leases tightly.
- Market conditions: 143 active listings in the ZIP; 204 units permitted in Oneida County in 2024 (68 in 5+ unit buildings).
- This rent runs 44% of the median local income ($53k/yr) — at the standard rent-burdened threshold; future hikes will face affordability resistance.
Forward outlook
- In year one you build about $20k of equity ($1k loan paydown + $19k appreciation (10.0% local appreciation)).
- Oneida County population projected at -12% by 2050 — secular population decline; favor cash flow + early exit over multi-decade hold.
- At projected returns (10.0% appreciation + 3.0% rent growth), your $53k cash investment doubles in ~3 years — after that, you're playing with house money.
- By year 2, paydown + projected appreciation supports a ~$33k cash-out refi (75% LTV) — recoverable capital for the next deal without selling this one.
Negotiation context
- It's been on market 248 days — a 12% lower offer ($167k) is reasonable based on typical stale-listing flexibility.
- 7 sale attempts since 21y ago with the ask held roughly flat each time — persistent listings suggest the price (not the market) is what's stuck; bring a comps-based counter.
- Current owner paid $110k; list at $190k implies a 73% gain — meaningful room to come down on a strong offer.
Risks & watch-outs
- Watch-outs: built in 1887 — expect roof / HVAC / electrical / plumbing capex.
Questions for the listing agent
- It's been on market 248 days. Have you received any prior offers? Is the seller open to a 12% concession, seller financing, or rate buy-down credit?
- Built in 1887 — when were the roof, HVAC, electrical panel, plumbing, and water heater last replaced?
- Why hasn't it sold? Are there any deal-killer items the seller is aware of (foundation, flood, title, zoning, code violations)?
- Is there a deadline driving the sale (1031 exchange, divorce, estate, relocation)? That informs how much negotiation room exists.
- Schools are D-rated, which usually means shorter tenancies and higher turnover. Who's the typical renter profile here, and what's been the actual vacancy rate?
- Crime grade is F in this area — have there been break-ins, vandalism, or insurance claims at this property in the last 3 years? What carrier currently insures it and at what premium?
- What's the average days-on-market for RENTAL listings here right now (not sales)? A rising rental-DOM trend means longer vacancies and softer asking-rent achievability than the comps imply.
- What's the recent tenant-quality profile in this submarket — average credit score on applications, eviction rate, late-payment / NSF rate, and stable-employment percentage? A property-management company in the area should have these aggregated.
- How much new apartment / multifamily construction is in the pipeline within 1–3 miles? Heavy new supply (>2% of stock underway) typically softens rents 12–24 months out; light construction supports rent growth.
Investment metrics
- 1% rule
- 1.02% ✓
- Cap rate
- 8.18%
- Cash-on-cash
- 6.75%
- DSCR
- 1.30
- GRM
- 8.1
CMA / ARV
- ARV (median comp)
- $309,853
- List price
- $189,900
- Delta
- -38.71%
- Verdict
- UNDERPRICED
- Comps
- 20 within 1.0 mi
Show comp detail 12 sales within ~0.75 mi
| Address | Dist | Beds/Ba | Sqft | Sold | Price | $/sf | Match |
|---|---|---|---|---|---|---|---|
| 1203 Blandina St | 0.17mi | 6/2.0 (+1) | 2,866 (-2%) | 20mo | $159,000 | $55 | 63 |
| 1110 Blandina St | 0.17mi | 6/4.0 (+1) | 2,810 (-4%) | 21mo | $252,000 | $90 | 60 |
| 923 Rutger St | 0.25mi | 6/2.0 (+1) | 2,600 (-11%) | 4mo | $245,500 | $94 | 57 |
| 1110 Lansing St | 0.21mi | 6/2.0 (+1) | 2,690 (-8%) | 20mo | $195,000 | $72 | 51 |
| 518 Wetmore St | 0.24mi | 6/2.0 (+1) | 2,530 (-13%) | 12mo | $201,000 | $79 | 48 |
| 413 Tilden Ave | 0.41mi | 5/2.0 | 2,560 (-12%) | 15mo | $180,000 | $70 | 44 |
| 710 Blandina St | 0.50mi | 6/3.0 (+1) | 2,722 (-7%) | 21mo | $130,000 | $48 | 43 |
| 1020 Tilden Ave | 0.46mi | 6/2.0 (+1) | 2,508 (-14%) | 5mo | $230,000 | $92 | 42 |
| 720 Lansing St | 0.49mi | 6/3.0 (+1) | 2,620 (-10%) | 16mo | $105,000 | $40 | 42 |
| 1010 Morris St | 0.66mi | 5/2.0 | 2,512 (-14%) | 8mo | $280,000 | $111 | 36 |
| 636 Mary St | 0.56mi | 5/1.0 | 2,516 (-14%) | 20mo | $65,000 | $26 | 26 |
| 805 Eagle St | 0.75mi | 6/2.0 (+1) | 2,488 (-15%) | 10mo | $145,000 | $58 | 23 |
Match score weights: distance 35% · size 25% · config 20% · recency 20%. Top-matched comps best support the ARV.
Projected returns pro-forma
10.0% appreciation · 3.0% rent growth · sell at horizon
- IRR
- 29.2%
- Equity multiple
- 3.30×
- Total profit
- $122,468
- Equity at exit
- $171,077
- IRR
- 25.3%
- Equity multiple
- 7.50×
- Total profit
- $345,623
- Equity at exit
- $368,934
Cash invested: $53,172 (down + closing). Projections, not guarantees.
Landlord ↔ Tenant lean methodology
- Overall (STATE)
- 15 Strongly Tenant-Friendly
- State New York
- 15 Strongly Tenant-Friendly · D+10
- County
- — inherits STATE
- City
- — inherits STATE
ZIP-level market 13501
- Home prices YoY
- 5.6%
- Active inventory
- 143
- Price-to-rent
- 8.1×
Monthly cashflow live
- Estimated rent
- $1,944 medium interval (Pro) →
- Mortgage (P&I)
- −$996
- Tax from tax record
- −$161 /mo · $1,934/yr
- Insurance
- −$79
- HOA
- −$0
- Vacancy / Maint / Mgmt
- −$408
- Net cashflow
- $299
Break-even live
UW: 25.0% down · 7.5% · 30yr · 1.5% tax · 5.0% vac · 8.0% maint · 8.0% mgmt
Financing live
Cash to close
- Down payment
- $47,475
- Closing costs
- $5,697
- Reserves months
- —
- Total cash needed
- —
Loan-product check · same deal, 3 products live
Conventional
25% down · 7.5% · 30yr
- Down + closing
- —
- Monthly P&I
- —
- Monthly cashflow
- —
- DSCR
- —
- Eligible?
- —
Personal DTI + credit; lowest rate.
DSCR
20% down · 8.5% · 30yr
- Down + closing
- —
- Monthly P&I
- —
- Monthly cashflow
- —
- DSCR
- —
- Eligible?
- —
No personal income docs; deal must DSCR.
Hard money
10% down · 12.0% · 12mo
- Down + closing
- —
- Monthly P&I
- —
- Monthly cashflow
- —
- DSCR
- —
- Eligible?
- —
Short-term bridge; refi at stabilization.
Listing history 30 events
-
2026-06-19days on market $189,900 Active 248 DOM
-
2026-06-18days on market $189,900 Active 247 DOM
-
2026-06-17days on market $189,900 Active 246 DOM
-
2026-06-16days on market $189,900 Active 245 DOM
-
2026-06-15days on market $189,900 Active 244 DOM
-
2026-06-14days on market $189,900 Active 242 DOM
-
2026-06-13days on market $189,900 Active 241 DOM
-
2026-06-10days on market $189,900 Active 239 DOM
-
2026-06-09days on market $189,900 Active 238 DOM
-
2026-06-08days on market $189,900 Active 237 DOM
-
2026-06-07days on market $189,900 Active 236 DOM
-
2026-06-03days on market $189,900 Active 232 DOM
-
2026-06-02days on market $189,900 Active 231 DOM
-
2026-06-01days on market $189,900 Active 230 DOM
-
2026-05-31days on market $189,900 Active 229 DOM
-
2026-05-30days on market $189,900 Active 228 DOM
-
2025-10-14$189,900 Active
-
2025-10-13historical
-
2025-04-14$189,900 Active
-
2021-03-16soldstatus $110,000
-
2020-03-18$109,900
-
2019-04-02historical
-
2019-04-02$120,000
-
2016-04-25historical
-
2016-01-25$59,900
-
2009-06-30historical
-
2008-08-25$69,900
-
2006-03-20soldstatus $54,000
-
2006-03-20soldstatus $54,000
-
2005-10-22$64,900
ⓘ Source: listings_history table (triggers on properties + properties_extension) + one-shot
backfill from property_details.listing_events for pre-trigger history.
Tax reassessment forecast NY · Partial reset (capped growth)
- Current annual tax
- $1,934 · $161/mo
- Projected year-2 tax
- $2,572 · $214/mo
- Expected delta
- +$638/yr (+$53/mo · 33.0%)
ⓘ Screening estimate from a state-policy table — verify with the county assessor before closing.
Climate risk First Street
- Flood 1/10 Low FEMA zone X (unshaded) · 0% chance over 30 yrs
- Wildfire 3/10 Moderate
- Heat 3/10 Moderate 7 d/yr ≥95°F today · 17 d/yr by 30 yrs out
- Wind 2/10 Low 100% chance of damaging wind over 30 yrs
- Air quality 2/10 Low 0 unhealthy d/yr today · 1 by 30 yrs out
Nearby sold comps map
Loading sold comps map…
Walkable amenities ~0.75 mi
Loading nearby amenities…
Taxation est. · year 1
- Rental income
- $23,322
- − Mortgage interest
- −$10,637
- − Property taxes
- −$1,934
- − Insurance
- −$950
- − Repairs & maintenance
- −$1,866
- − Management
- −$1,866
- − Depreciation
- −$5,524
- Taxable income
- $546
- Est. tax owed @ 24.0%
- −$131
- After-tax cash flow
- $3,460/yr
For passive investors: Depreciation is non-cash, so a rental often shows a tax loss while cash-flowing — sheltering income. Rental losses are passive: they offset passive income freely, and up to $25,000/yr can offset ordinary (W-2) income if you actively participate and your MAGI is under $100k (phasing out to $0 by $150k); unused losses carry forward. On sale, claimed depreciation is recaptured at up to 25%, and gains may owe capital-gains tax (a 1031 exchange can defer both). Figures are a year-1 estimate at your 24.0% rate — not tax advice; consult a CPA.
Schools (NCES district)
- District
- Utica City School District
- NCES district ID
- 3629370
- Math proficiency
- 33% ▼ -7.00%
- Reading proficiency
- 38% ▲ 2.00%
- Median HH income
- $31,834
- Composite
- 29.01/100
- National rank
- #6613
- State rank
- #562 of 590 in NY
Livability — Utica
- Score
- 80/100
- State rank
- #104
- US rank
- #1589
Category grades
Schools grade is shown separately in the Schools card above.
Census & demographics
- Census place
- Utica, NY
- County
- Oneida County · 89,710 people
- City population
- 72,968
- Metro
- Utica-Rome, NY
- Population (ZIP)
- 38,931
- Household income
- $52,548
- Rent vs Own
- Severe rent burden
- 2251.0
Population outlook (Oneida County) Hauer SSP2
- Today (2025)
- 225,223 people
- By 2030
- 220,384 · -2.1%
- By 2040
- 209,071 · -7.2%
- By 2050
- 197,920 · -12.1%
- By 2075
- 175,541 · -22.1%
- By 2100
- 148,491 · -34.1%
Race, ethnicity, and origin ACS 2023
- Neighborhood character
- Highly diverse neighborhood (Simpson 0.70)
- Race & ethnicity
- White 49% Two or more races 15% Hispanic / Latino 14% Black 14% Asian 14%
- Hispanic origin (detail)
- Puerto Rican 8% Dominican 4%
- Common ancestry
- American 8% Romanian 3% Lithuanian 1%
- Foreign-born
- 25% · Canada, Philippines, Vietnam
- Languages at home
- 62% English-only · Other Asian/Pacific 11% Russian/Polish/Slavic 10% Spanish 9%
Political lean MEDSL · Oneida
- 2024 margin
- Strong R (+21.3) · D 39.4% · R 60.6%
- 2008→2024 swing
- -15.2pp toward R · 2008: -6.1pp · 2024: -21.3pp
- All cycles
- 2024: R+21.3 2020: R+15.5 2016: R+21.1 2012: R+5.3 2008: R+6.1
Not yet ingested
- Civics
- —
Market trends
- HPI YoY
- ▲ 20.28%
- Current HPI
- 382.3726
- Rent YoY
- —
- Metro
- Utica-Rome, NY
- State GDP YoY
- ▲ 2.60%
- F500 in state
- 92
Industry mix (Fortune 500 HQ in NY)
| Industry | F500 HQs | Revenue |
|---|---|---|
| Financial Services | 10 | $950B |
|
||
| Consumer Goods | 9 | $162B |
|
||
| Insurance | 4 | $225B |
|
||
| Telecommunications | 2 | $144B |
|
||
| Pharmaceuticals | 2 | $112B |
|
||
| Media / Entertainment | 2 | $69B |
|
||
Price history
+192.6% since first listed14 events — show timeline
- 2025-10-14 Listed $189,900 CNYIS
- 2025-10-13 Listing Removed — CNYIS
- 2025-04-14 Listed $189,900 CNYIS
- 2021-03-16 Sold (MLS) $110,000 CNYIS
- 2020-03-18 Listed $109,900 CNYIS
- 2019-04-02 Listed $120,000 CNYIS
- 2019-04-02 Listing Removed — CNYIS
- 2016-04-25 Listing Removed — CNYIS
- 2016-01-25 Listed $59,900 CNYIS
- 2009-06-30 Listing Removed — CNYIS
- 2008-08-25 Listed $69,900 CNYIS
- 2006-03-20 Sold (Public Records) $54,000 Public Records
- 2006-03-20 Sold (MLS) $54,000 CNYIS
- 2005-10-22 Listed $64,900 CNYIS
Property tax history
+4.0%/yrLatest (2025): $1,934 · -28.3% YoY. Source: county tax records.
Cash-flow waterfall
monthlySold comps — $/sqft
last 12 mo · ≤1 miLoading sold comps…