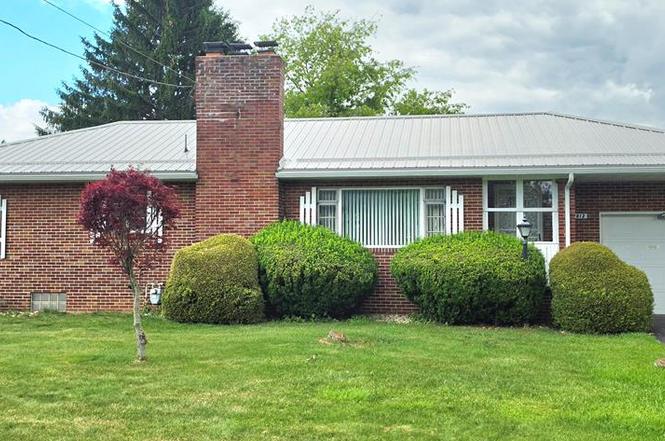
1012 Willet Dr · Westwood, PA
Flood risk 1/10 · Minimal
- FEMA flood zone
- X (unshaded)
- Chance of flooding over 30 yrs
- 0.0%
- Est. flood insurance / yr
- $473 – $860
Fire risk 1/10 · Minimal
- Est. fire insurance / yr
- $511 – $949
Heat risk 3/10 · Minor
- Hot days now (above 96°F)
- 7 days/yr
- Hot days in 30 yrs
- 17 days/yr
Wind risk 2/10 · Minimal
- Chance of severe wind over 30 yrs
- —
Air-quality risk 2/10 · Minimal
- Unhealthy air days now
- 1 days/yr
- Unhealthy air days in 30 yrs
- 2 days/yr
Risk factors via First Street. Map © Google.
Why this score? — see what drove the C+ grade
The composite is a weighted blend of 9 inputs, each scored 0–100. Each bar is that input's sub-score; the figure is the points it added to the 100-point composite (weight × sub-score).
- Cash flow +23.6/30.0
- ARV discount +15.0/15.0
- DSCR +7.6/10.0
- 1% rule +6.6/10.0
- Livability +3.2/5.0
- Rent growth +2.5/5.0
- Condition / age +2.5/5.0
- Schools +1.3/10.0
- Appreciation +0.0/10.0
$117,500
🖨 Deal sheet 📄 Offer letter ✓ Due diligence
Listing remarks
Conveniently located in Lower Yoder Township and close to shopping, restaurants, and other everyday amenities, this solid brick ranch offers both comfort and convenience. Hardwood flooring lies beneath the carpeting throughout the home. The spacious living room with a brick fireplace opens to a separate dining room, which flows into the eat-in kitchen complete with included appliances. The partially finished lower level features a family room, perfect for entertaining or additional living space. Additional highlights include an attached garage, durable metal roof, and sewer compliance. Don't miss this opportunity—call today to schedule your personal tour!
Key facts
- Hardwood flooring
- Brick fireplace
- Separate dining room
Tags
Property features AI
Exterior
- Parking: Attached garage (1 car)
- Utilities: Public water; Public sewer; Sewer available
- Home design: Single-family residence; One story
- Construction: Brick construction; Metal roof; Full, partially finished basement; Below-grade finished area
- Exterior features: Covered porch; Patio/porch; Rectangular lot
Interior
- Kitchen: Range; Oven; Refrigerator; Dishwasher not listed
- Bedrooms: Master on main level
- Flooring: Hardwood floors
- Bathrooms: 1 full bathroom; 1 half bathroom
- Heating & cooling: Hot water heating (natural gas); Ceiling fan(s) for cooling
- Interior features: Master bedroom on the main floor; Wood-burning fireplace
- Laundry & utility: Washer and dryer included; Laundry located in the basement
Neighborhood map
What this means for you Summary
Snapshot
- This is a 3-bed/1.5-bath single-family listed at $118k.
Deal economics
- At list price, monthly cash flow is $221 ($3k/yr) — positive.
- The deal already cash-flows at list — no discount required.
- Meets the 1% rule at list price ($1k rent vs $118k).
Location & tenants
- Location reads 63/100 on livability (#1,263 in PA) — a middle-class / working-renter tenant base. Strengths: crime A+, cost of living A+; Watch: schools F, amenities F, commute F.
- Greater Johnstown SD (urban): math 9% / reading 25% proficiency, ranked #509 of 539 in PA (top 94%) — low school quality limits family demand, transient renter base, plan for 1-2y turnover; 80% free/reduced lunch — lower-income household profile, screen leases tightly.
- Market conditions: 92 active listings in the ZIP; 3 comparable units currently listed for rent nearby; rentals at typical pace (median 15d on market — plan ~3-4 weeks tenant-placement turnaround); 64 units permitted in Cambria County in 2024 (0 in 5+ unit buildings).
Forward outlook
- Local home prices are declining (-3.0%/yr); year-one equity from $812 of loan paydown is wiped out by about $4k of value loss. Plan a longer hold.
- Cambria County population projected at -28% by 2050 — secular population decline; favor cash flow + early exit over multi-decade hold.
Negotiation context
- Only 4 days on market — expect competitive offers; lowballing is unlikely to land.
- Current owner paid $65k; list at $118k implies a 81% gain — meaningful room to come down on a strong offer.
Risks & watch-outs
- Watch-outs: built in 1952 — expect roof / HVAC / electrical / plumbing capex.
Questions for the listing agent
- Built in 1952 — when were the roof, HVAC, electrical panel, plumbing, and water heater last replaced?
- Is there a deadline driving the sale (1031 exchange, divorce, estate, relocation)? That informs how much negotiation room exists.
- Schools are F-rated, which usually means shorter tenancies and higher turnover. Who's the typical renter profile here, and what's been the actual vacancy rate?
- What's the average days-on-market for RENTAL listings here right now (not sales)? A rising rental-DOM trend means longer vacancies and softer asking-rent achievability than the comps imply.
- What's the recent tenant-quality profile in this submarket — average credit score on applications, eviction rate, late-payment / NSF rate, and stable-employment percentage? A property-management company in the area should have these aggregated.
- How much new for-sale + rental construction is in the pipeline within 1–3 miles? Heavy new supply typically softens prices + rents 12–24 months out; constrained supply supports both.
Investment metrics
- 1% rule
- 1.16% ✓
- Cap rate
- 8.55%
- Cash-on-cash
- 8.07%
- DSCR
- 1.36
- GRM
- 7.2
CMA / ARV
- ARV (on-the-fly)
- $170,136
- Comps found
- 12
Show comp detail 12 sales within ~0.75 mi
| Address | Dist | Beds/Ba | Sqft | Sold | Price | $/sf | Match |
|---|---|---|---|---|---|---|---|
| 121 Vesta Ln | 0.45mi | 3/1.5 | 1,574 (-6%) | 1mo | $163,000 | $104 | 69 |
| 1734 Goucher St | 0.15mi | 3/1.0 | 1,473 (-12%) | 4mo | $154,900 | $105 | 68 |
| 1936 Minno Dr | 0.31mi | 3/2.0 | 1,484 (-11%) | 0mo | $112,000 | $75 | 65 |
| 1618 Emmett Dr | 0.17mi | 4/2.0 (+1) | 1,510 (-10%) | 6mo | $220,000 | $146 | 64 |
| 1769 Jaffa Dr | 0.25mi | 3/2.0 | 1,881 (+13%) | 1mo | $220,000 | $117 | 64 |
| 1914 Willet Dr | 0.33mi | 3/1.5 | 1,836 (+10%) | 6mo | $154,000 | $84 | 63 |
| 1604 Menoher Blvd | 0.37mi | 3/1.5 | 1,848 (+11%) | 2mo | $157,500 | $85 | 63 |
| 1027 Pomona Dr | 0.27mi | 3/2.0 | 1,464 (-12%) | 6mo | $150,000 | $102 | 60 |
| 427 Slater St | 0.60mi | 3/2.5 | 1,604 (-4%) | 3mo | $220,000 | $137 | 60 |
| 775 Parkview | 0.27mi | 2/3.0 (-1) | 1,847 (+11%) | 3mo | $169,500 | $92 | 56 |
| 301 Irving St | 0.58mi | 3/1.5 | 1,826 (+10%) | 6mo | $145,000 | $79 | 52 |
| 260 Sherwood Dr | 0.40mi | 4/2.5 (+1) | 1,809 (+8%) | 8mo | $138,000 | $76 | 52 |
Match score weights: distance 35% · size 25% · config 20% · recency 20%. Top-matched comps best support the ARV.
Projected returns pro-forma
-3.0% appreciation · 3.0% rent growth · sell at horizon
- IRR
- -4.0%
- Equity multiple
- 0.85×
- Total profit
- $-4,898
- Equity at exit
- $17,520
- IRR
- 5.8%
- Equity multiple
- 1.43×
- Total profit
- $14,076
- Equity at exit
- $10,159
Cash invested: $32,900 (down + closing). Projections, not guarantees.
Landlord ↔ Tenant lean methodology
- Overall (STATE)
- 62 Landlord-Friendly
- State Pennsylvania
- 62 Landlord-Friendly · EVEN
- County
- — inherits STATE
- City
- — inherits STATE
ZIP-level market 15905
- Home prices YoY
- -31.1%
- Active inventory
- 92
- Price-to-rent
- 7.2×
Monthly cashflow live
- Estimated rent
- $1,363 medium interval (Pro) →
- Mortgage (P&I)
- −$616
- Tax from tax record
- −$191 /mo · $2,289/yr
- Insurance
- −$49
- HOA
- −$0
- Vacancy / Maint / Mgmt
- −$286
- Net cashflow
- $221
Break-even live
UW: 25.0% down · 7.5% · 30yr · 1.5% tax · 5.0% vac · 8.0% maint · 8.0% mgmt
Financing live
Cash to close
- Down payment
- $29,375
- Closing costs
- $3,525
- Reserves months
- —
- Total cash needed
- —
Loan-product check · same deal, 3 products live
Conventional
25% down · 7.5% · 30yr
- Down + closing
- —
- Monthly P&I
- —
- Monthly cashflow
- —
- DSCR
- —
- Eligible?
- —
Personal DTI + credit; lowest rate.
DSCR
20% down · 8.5% · 30yr
- Down + closing
- —
- Monthly P&I
- —
- Monthly cashflow
- —
- DSCR
- —
- Eligible?
- —
No personal income docs; deal must DSCR.
Hard money
10% down · 12.0% · 12mo
- Down + closing
- —
- Monthly P&I
- —
- Monthly cashflow
- —
- DSCR
- —
- Eligible?
- —
Short-term bridge; refi at stabilization.
Rent comps 3 comps
| Address | Beds | Baths | Sqft | Rent | $/sqft | DOM | Units | Dist |
|---|---|---|---|---|---|---|---|---|
| 212-214 Palliser St Johnstown, PA | 3.0 | 1.0 | 1400 | $1,150 | $0.82 | 23d | 1 | 0.84mi |
| 108 Dell St Johnstown, PA | 3.0 | 2.0 | 2250 | $1,749 | $0.78 | 14d | 1 | 1.18mi |
| 108 Dell St Johnstown, PA | 3.0 | 2.0 | 2250 | $1,749 | $0.78 | 7d | 1 | 1.18mi |
Listing history 5 events
-
2026-06-19days on market $117,500 Active 4 DOM
-
2026-06-18days on market $117,500 Active 3 DOM
-
2026-06-17days on market $117,500 Active 2 DOM
-
2026-06-16remarks 663-char remark
-
2026-06-16$117,500 Active 1 DOM
ⓘ Source: listings_history table (triggers on properties + properties_extension) + one-shot
backfill from property_details.listing_events for pre-trigger history.
Tax reassessment forecast PA · Partial reset (capped growth)
- Current annual tax
- $2,289 · $191/mo
- Projected year-2 tax
- $2,289 · $191/mo
- Expected delta
- $0/yr ($0/mo · 0.0%)
ⓘ Screening estimate from a state-policy table — verify with the county assessor before closing.
Climate risk First Street
- Flood 1/10 Low FEMA zone X (unshaded) · 0% chance over 30 yrs
- Wildfire 1/10 Low
- Heat 3/10 Moderate 7 d/yr ≥96°F today · 17 d/yr by 30 yrs out
- Wind 2/10 Low
- Air quality 2/10 Low 1 unhealthy d/yr today · 2 by 30 yrs out
Nearby sold comps map
Loading sold comps map…
Walkable amenities ~0.75 mi
Loading nearby amenities…
Taxation est. · year 1
- Rental income
- $16,362
- − Mortgage interest
- −$6,582
- − Property taxes
- −$2,289
- − Insurance
- −$588
- − Repairs & maintenance
- −$1,309
- − Management
- −$1,309
- − Depreciation
- −$3,418
- Taxable income
- $868
- Est. tax owed @ 24.0%
- −$208
- After-tax cash flow
- $2,447/yr
For passive investors: Depreciation is non-cash, so a rental often shows a tax loss while cash-flowing — sheltering income. Rental losses are passive: they offset passive income freely, and up to $25,000/yr can offset ordinary (W-2) income if you actively participate and your MAGI is under $100k (phasing out to $0 by $150k); unused losses carry forward. On sale, claimed depreciation is recaptured at up to 25%, and gains may owe capital-gains tax (a 1031 exchange can defer both). Figures are a year-1 estimate at your 24.0% rate — not tax advice; consult a CPA.
Schools (NCES district)
- District
- Greater Johnstown SD
- NCES district ID
- 4210950
- Math proficiency
- 9% ▼ -6.00%
- Reading proficiency
- 25% ▼ -6.00%
- Median HH income
- $27,890
- Composite
- 13.25/100
- National rank
- #9550
- State rank
- #509 of 539 in PA
Livability — Westwood
- Score
- 63/100
- State rank
- #1263
- US rank
- #15213
Category grades
Schools grade is shown separately in the Schools card above.
Census & demographics
- Census place
- Westwood, PA
- County
- Cambria County · 30,791 people
- Metro
- Johnstown, PA
- Population (ZIP)
- 19,329
- Household income
- $69,212
- Rent vs Own
- Severe rent burden
- 359.0
Population outlook (Cambria County) Hauer SSP2
- Today (2025)
- 122,754 people
- By 2030
- 115,827 · -5.6%
- By 2040
- 101,309 · -17.5%
- By 2050
- 88,379 · -28.0%
- By 2075
- 65,237 · -46.9%
- By 2100
- 46,909 · -61.8%
Race, ethnicity, and origin ACS 2023
- Neighborhood character
- Predominantly White (92%)
- Race & ethnicity
- White 92% Two or more races 3% Hispanic / Latino 2% Black 2%
- Common ancestry
- Romanian 7% Scotch-Irish 1% Italian 1%
- Foreign-born
- 2% · Canada
- Languages at home
- 96% English-only · Spanish 1%
Political lean MEDSL · Cambria
- 2024 margin
- Solid R (+39.7) · D 29.8% · R 69.5%
- 2008→2024 swing
- -40.4pp toward R · 2008: 0.7pp · 2024: -39.7pp
- All cycles
- 2024: R+39.7 2020: R+37.3 2016: R+37.8 2012: R+17.8 2008: D+0.7
Not yet ingested
- Civics
- —
Market trends
- HPI YoY
- ▼ -64.18%
- Current HPI
- 142.5218
- Rent YoY
- —
- Metro
- Johnstown, PA
- State GDP YoY
- ▲ 1.68%
- F500 in state
- 34
Industry mix (Fortune 500 HQ in PA)
| Industry | F500 HQs | Revenue |
|---|---|---|
| Healthcare | 2 | $309B |
|
||
| Insurance | 2 | $27B |
|
||
| Telecommunications / Media | 1 | $124B |
|
||
| Industrial Distribution | 1 | $22B |
|
||
| Financial Services | 1 | $20B |
|
||
| Chemicals / Materials | 1 | $18B |
|
||
Price history
+80.8% since first listed2 events — show timeline
- 2026-06-15 Listed $117,500 CSMLS
- 1989-06-01 Sold (Public Records) $65,000 Public Records
Property tax history
+0.6%/yrLatest (2026): $2,289 · +0.0% YoY. Source: county tax records.
Cash-flow waterfall
monthlySold comps — $/sqft
last 12 mo · ≤1 miLoading sold comps…