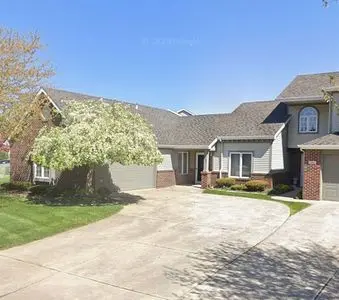
9443 Van Buren St · Crown Point, IN
Flood risk 1/10 · Minimal
- FEMA flood zone
- X (unshaded)
- Chance of flooding over 30 yrs
- 0.0%
- Est. flood insurance / yr
- $507 – $1,088
Fire risk 1/10 · Minimal
- Est. fire insurance / yr
- $717 – $1,331
Heat risk 3/10 · Minor
- Hot days now (above 102°F)
- 7 days/yr
- Hot days in 30 yrs
- 16 days/yr
Wind risk 2/10 · Minimal
- Chance of severe wind over 30 yrs
- —
Air-quality risk 2/10 · Minimal
- Unhealthy air days now
- 1 days/yr
- Unhealthy air days in 30 yrs
- 3 days/yr
Risk factors via First Street. Map © Google.
Why this score? — see what drove the D grade
The composite is a weighted blend of 9 inputs, each scored 0–100. Each bar is that input's sub-score; the figure is the points it added to the 100-point composite (weight × sub-score).
- Cash flow +14.7/30.0
- ARV discount +8.6/15.0
- DSCR +4.5/10.0
- Livability +3.9/5.0
- 1% rule +3.2/10.0
- Rent growth +3.1/5.0
- Schools +2.6/10.0
- Condition / age +2.5/5.0
- Appreciation +0.0/10.0
$269,900
🖨 Deal sheet (PDF) 📄 Offer letter ✓ Due diligence
Listing remarks
Ranch on pond. Vaulted ceilings in living room. 2 spacious bedrooms and a primary bedroom suite with jacuzzi tub. Walk in closet in primary bedroom. Enjoy a cup of coffee on the screened in deck that looks out to the pond with the fountain.
Key facts
- Screened in deck
- Walk in closet
- Ranch on pond
Tags
Neighborhood map
What this means for you Summary
Snapshot
- This is a 2-bed/2.0-bath single-family listed at $270k.
Deal economics
- At list price, monthly cash flow is $67 ($801/yr) — positive.
- The deal already cash-flows at list — no discount required.
- To meet the 1% rule (rent ≥ 1% of price), the offer needs to be $220k (18.3% below list).
- Recommended offer: $220k (18.3% below list) — sets the bar for 1% rule.
- Cap rate 6.6% vs local median 3.4% in Crown Point — top-decile yield for the area; either an underpriced asset or a hidden risk that comps aren't pricing in. Stress-test before assuming the spread holds.
Location & tenants
- Location reads 77/100 on livability (#45 in IN, #3,244 nationally) — a middle-class / working-renter tenant base. Strengths: crime A+, employment A+, cost of living A+; Watch: amenities F, commute F, health & safety D-.
- Merrillville Community School Corporation (suburban): math 22% / reading 36% proficiency, ranked #240 of 301 in IN (top 80%) — low school quality limits family demand, transient renter base, plan for 1-2y turnover.
- Zoned schools: Homer Iddings Elementary School (math 22% / reading 22%, grade F, #790 of 994 statewide, top 81%, 488 students, 69% FRL); Pierce Middle School (math 18% / reading 37%, grade F, #230 of 330 statewide, top 71%, 919 students, 70% FRL); Merrillville High School (math 19% / reading 55%, grade F, #247 of 369 statewide, top 70%, 2,042 students, 64% FRL) — zoned schools average 68% FRL vs 50% district-wide (18 pts higher); higher-poverty schools than district average — tighter screening recommended.
- Market conditions: Rents rising (+2.5%/yr); 753 active listings in the ZIP; 9 comparable units currently listed for rent nearby; rentals at typical pace (median 17d on market — plan ~3-4 weeks tenant-placement turnaround); solid renter incomes; 1,642 units permitted in Lake County in 2024 (14 in 5+ unit buildings).
Forward outlook
- Local home prices are declining (-3.0%/yr); year-one equity from $2k of loan paydown is wiped out by about $8k of value loss. Plan a longer hold.
- Lake County population projected to shrink 7% by 2050 — rents likely to lag national; underwrite the cash flow, not the appreciation.
Negotiation context
- It's been on market 27 days — a 2% lower offer ($266k) is reasonable based on typical stale-listing flexibility.
Questions for the listing agent
- Is there a deadline driving the sale (1031 exchange, divorce, estate, relocation)? That informs how much negotiation room exists.
- Schools are B-rated — typically a magnet for longer-tenancy family renters. What's the average tenant stay here, and is there a school-zone premium baked into asking?
- The area grade is low — what's the realistic commute time and amenity access for the typical tenant pool here? Any planned neighborhood developments (good or bad) we should know about?
- What's the average days-on-market for RENTAL listings here right now (not sales)? A rising rental-DOM trend means longer vacancies and softer asking-rent achievability than the comps imply.
- What's the recent tenant-quality profile in this submarket — average credit score on applications, eviction rate, late-payment / NSF rate, and stable-employment percentage? A property-management company in the area should have these aggregated.
- How much new for-sale + rental construction is in the pipeline within 1–3 miles? Heavy new supply typically softens prices + rents 12–24 months out; constrained supply supports both.
Investment metrics
- 1% rule
- 0.82% ✗
- Cap rate
- 6.59%
- Cash-on-cash
- 1.06%
- DSCR
- 1.05
- GRM
- 10.2
CMA / ARV
- ARV (on-the-fly)
- $276,675
- Comps found
- 6
Show comp detail 6 sales within ~0.75 mi
| Address | Dist | Beds/Ba | Sqft | Sold | Price | $/sf | Match |
|---|---|---|---|---|---|---|---|
| 1423 W 93rd Pl | 0.39mi | 3/2.0 (+1) | 1,357 (+6%) | 6mo | $324,000 | $239 | 61 |
| 1422 W 97th Pl | 0.39mi | 3/2.0 (+1) | 1,186 (-7%) | 8mo | $287,000 | $242 | 58 |
| 1280 W 97th Ln | 0.42mi | 3/2.0 (+1) | 1,200 (-6%) | 21mo | $260,000 | $217 | 48 |
| 9501 Lincoln Ct | 0.36mi | 3/2.0 (+1) | 1,422 (+12%) | 17mo | $250,000 | $176 | 45 |
| 9740 Grant Pl | 0.69mi | 2/1.5 | 1,122 (-12%) | 17mo | $205,000 | $183 | 32 |
| 1553 W 98th Pl | 0.60mi | 3/1.5 (+1) | 1,412 (+11%) | 21mo | $295,000 | $209 | 29 |
Match score weights: distance 35% · size 25% · config 20% · recency 20%. Top-matched comps best support the ARV.
Projected returns pro-forma
-3.0% appreciation · 2.53% rent growth · sell at horizon
- IRR
- -15.1%
- Equity multiple
- 0.46×
- Total profit
- $-40,606
- Equity at exit
- $40,243
- IRR
- -7.3%
- Equity multiple
- 0.54×
- Total profit
- $-34,443
- Equity at exit
- $23,336
Cash invested: $75,572 (down + closing). Projections, not guarantees.
Landlord ↔ Tenant lean methodology
- Overall (STATE)
- 90 Strongly Landlord-Friendly
- State Indiana
- 90 Strongly Landlord-Friendly · R+11
- County
- — inherits STATE
- City
- — inherits STATE
ZIP-level market 46307
- Rents YoY
- 2.5%
- Active inventory
- 753
- Price-to-rent
- 10.2×
Monthly cashflow live
- Estimated rent
- $2,205 high interval (Pro) →
- Mortgage (P&I)
- −$1,415
- Tax from tax record
- −$147 /mo · $1,764/yr
- Insurance
- −$112
- HOA
- −$0
- Vacancy / Maint / Mgmt
- −$463
- Net cashflow
- $67
Break-even live
Sensitivity live
| Price | -10% $220 | -5% $143 | +0% $67 | +5% $-10 | +10% $-86 |
|---|---|---|---|---|---|
| Rent | -10% $-107 | -5% $-20 | +0% $67 | +5% $154 | +10% $241 |
| Rate | -1.0pp $203 | -0.5pp $135 | base $67 | +0.5pp $-3 | +1.0pp $-74 |
UW: 25.0% down · 7.5% · 30yr · 1.5% tax · 5.0% vac · 8.0% maint · 8.0% mgmt
Financing live
Cash to close
- Down payment
- $67,475
- Closing costs
- $8,097
- Reserves months
- —
- Total cash needed
- —
Loan-product check · same deal, 3 products live
Conventional
25% down · 7.5% · 30yr
- Down + closing
- —
- Monthly P&I
- —
- Monthly cashflow
- —
- DSCR
- —
- Eligible?
- —
Personal DTI + credit; lowest rate.
DSCR
20% down · 8.5% · 30yr
- Down + closing
- —
- Monthly P&I
- —
- Monthly cashflow
- —
- DSCR
- —
- Eligible?
- —
No personal income docs; deal must DSCR.
Hard money
10% down · 12.0% · 12mo
- Down + closing
- —
- Monthly P&I
- —
- Monthly cashflow
- —
- DSCR
- —
- Eligible?
- —
Short-term bridge; refi at stabilization.
Rent comps 9 comps
| Address | Beds | Baths | Sqft | Rent | $/sqft | DOM | Units | Dist |
|---|---|---|---|---|---|---|---|---|
| 9310 Monroe St Crown Point, IN | 3.0 | 2.0 | 1370 | $2,521 | $1.84 | 6d | 1 | 0.21mi |
| 9310 Monroe St Crown Point, IN | 2.0 | 2.0 | 1034 | $2,254 | $2.18 | 26d | 1 | 0.21mi |
| 9310 Monroe St Crown Point, IN | 2.0 | 2.0 | 947 | $2,314 | $2.44 | 45d | 1 | 0.21mi |
| 9047 Connecticut Dr Merrillville, IN | 2.0 | 2.0 | 1252 | $2,852 | $2.28 | 0d | 1 | 0.82mi |
| 9000 Lincoln St Merrillville, IN | 2.0 | 2.0 | 1196 | $2,181 | $1.82 | 17d | 1 | 0.83mi |
| 9000 Lincoln St Merrillville, IN | 3.0 | 2.0 | 1223 | $3,119 | $2.55 | 24d | 1 | 0.83mi |
| 9000 Lincoln St Merrillville, IN | 2.0 | 2.0 | 1196 | $2,238 | $1.87 | 45d | 1 | 0.83mi |
| 9123 Cleveland St Merrillville, IN | 1.0–2.0 | 1.0–2.0 | 1068 | $2,145 | $2.01 | 0d | 34 | 0.87mi |
| 8400 Grant Cir Merrillville, IN | 1.0–2.0 | 1.0–2.0 | 904 | $1,550 | $1.71 | 0d | 9 | 1.27mi |
Listing history 16 events
-
2026-06-21days on market $269,900 Active 27 DOM
-
2026-06-18days on market $269,900 Active 24 DOM
-
2026-06-17days on market $269,900 Active 23 DOM
-
2026-06-16days on market $269,900 Active 22 DOM
-
2026-06-15days on market $269,900 Active 21 DOM
-
2026-06-13days on market $269,900 Active 19 DOM
-
2026-06-13days on market $269,900 Active 18 DOM
-
2026-06-09days on market $269,900 Active 15 DOM
-
2026-06-08days on market $269,900 Active 14 DOM
-
2026-06-07days on market $269,900 Active 13 DOM
-
2026-06-04days on market $269,900 Active 10 DOM
-
2026-06-03days on market $269,900 Active 9 DOM
-
2026-06-02days on market $269,900 Active 8 DOM
-
2026-06-01days on market $269,900 Active 7 DOM
-
2026-05-31days on market $269,900 Active 6 DOM
-
2026-05-26$269,900 Active
ⓘ Source: listings_history table (triggers on properties + properties_extension) + one-shot
backfill from property_details.listing_events for pre-trigger history.
Tax reassessment forecast IN · Partial reset (capped growth)
- Current annual tax
- $1,764 · $147/mo
- Projected year-2 tax
- $2,029 · $169/mo
- Expected delta
- +$265/yr (+$22/mo · 15.0%)
ⓘ Screening estimate from a state-policy table — verify with the county assessor before closing.
Climate risk First Street
- Flood 1/10 Low FEMA zone X (unshaded) · 0% chance over 30 yrs
- Wildfire 1/10 Low
- Heat 3/10 Moderate 7 d/yr ≥102°F today · 16 d/yr by 30 yrs out
- Wind 2/10 Low
- Air quality 2/10 Low 1 unhealthy d/yr today · 3 by 30 yrs out
Nearby sold comps map
Loading sold comps map…
Walkable amenities ~0.75 mi
Loading nearby amenities…
Taxation est. · year 1
- Rental income
- $26,455
- − Mortgage interest
- −$15,119
- − Property taxes
- −$1,764
- − Insurance
- −$1,350
- − Repairs & maintenance
- −$2,116
- − Management
- −$2,116
- − Depreciation
- −$7,852
- Taxable loss
- −$3,862
- Est. tax savings @ 24.0%
- +$927
- After-tax cash flow
- $1,728/yr
For passive investors: Depreciation is non-cash, so a rental often shows a tax loss while cash-flowing — sheltering income. Rental losses are passive: they offset passive income freely, and up to $25,000/yr can offset ordinary (W-2) income if you actively participate and your MAGI is under $100k (phasing out to $0 by $150k); unused losses carry forward. On sale, claimed depreciation is recaptured at up to 25%, and gains may owe capital-gains tax (a 1031 exchange can defer both). Figures are a year-1 estimate at your 24.0% rate — not tax advice; consult a CPA.
Schools (NCES district)
- District
- Merrillville Community School Corporation
- NCES district ID
- 1809690
- Math proficiency
- 22% ▼ -17.00%
- Reading proficiency
- 36% ▼ -8.00%
- Median HH income
- $54,401
- Composite
- 25.74/100
- National rank
- #7375
- State rank
- #240 of 301 in IN
Livability — Crown Point
- Score
- 77/100
- State rank
- #45
- US rank
- #3244
Category grades
Schools grade is shown separately in the Schools card above.
Census & demographics
- Census place
- Crown Point, IN
- County
- Lake County · 422,878 people
- City population
- 71,673
- Metro
- Chicago-Naperville-Elgin, IL-IN-WI
- Population (ZIP)
- 71,673
- Household income
- $107,800
- Rent vs Own
- Severe rent burden
- 705.0
Population outlook (Lake County) Hauer SSP2
- Today (2025)
- 484,026 people
- By 2030
- 478,091 · -1.2%
- By 2040
- 462,974 · -4.3%
- By 2050
- 449,894 · -7.1%
- By 2075
- 436,169 · -9.9%
- By 2100
- 426,607 · -11.9%
Race, ethnicity, and origin ACS 2023
- Neighborhood character
- Predominantly White (76%)
- Race & ethnicity
- White 76% Hispanic / Latino 12% Two or more races 10% Black 7% Asian 2%
- Hispanic origin (detail)
- Mexican 9% Puerto Rican 1%
- Common ancestry
- Romanian 12% Iranian 3% Lithuanian 2%
- Foreign-born
- 7% · Canada, Vietnam
- Languages at home
- 88% English-only · Spanish 5% Russian/Polish/Slavic 3% Other Indo-European 1%
Political lean MEDSL · Lake
- 2024 margin
- Lean D (+5.6) · D 52.1% · R 46.5% · Other 1.5%
- 2008→2024 swing
- -28.6pp toward R · 2008: 34.3pp · 2024: 5.6pp
- All cycles
- 2024: D+5.6 2020: D+15.1 2016: D+20.6 2012: D+31.0 2008: D+34.3
Not yet ingested
- Civics
- —
Market trends
- HPI YoY
- ▼ -164.91%
- Current HPI
- 226.0335
- Rent YoY
- ▲ 2.53%
- Metro
- Chicago-Naperville-Elgin, IL-IN-WI
- State GDP YoY
- ▲ 2.90%
- F500 in state
- 18
Industry mix (Fortune 500 HQ in IN)
| Industry | F500 HQs | Revenue |
|---|---|---|
| Industrial Machinery | 2 | $37B |
|
||
| Healthcare | 1 | $177B |
|
||
| Pharmaceuticals | 1 | $45B |
|
||
| Metals / Steel | 1 | $18B |
|
||
| Agriculture | 1 | $17B |
|
||
| Packaging | 1 | $12B |
|
||
Price history
1 event — show timeline
- 2026-05-26 Listed $269,900 FSBO.com
Property tax history
+2.3%/yrLatest (2024): $1,764 · +3.1% YoY. Source: county tax records.
Cash-flow waterfall
monthlySold comps — $/sqft
last 12 mo · ≤1 miLoading sold comps…