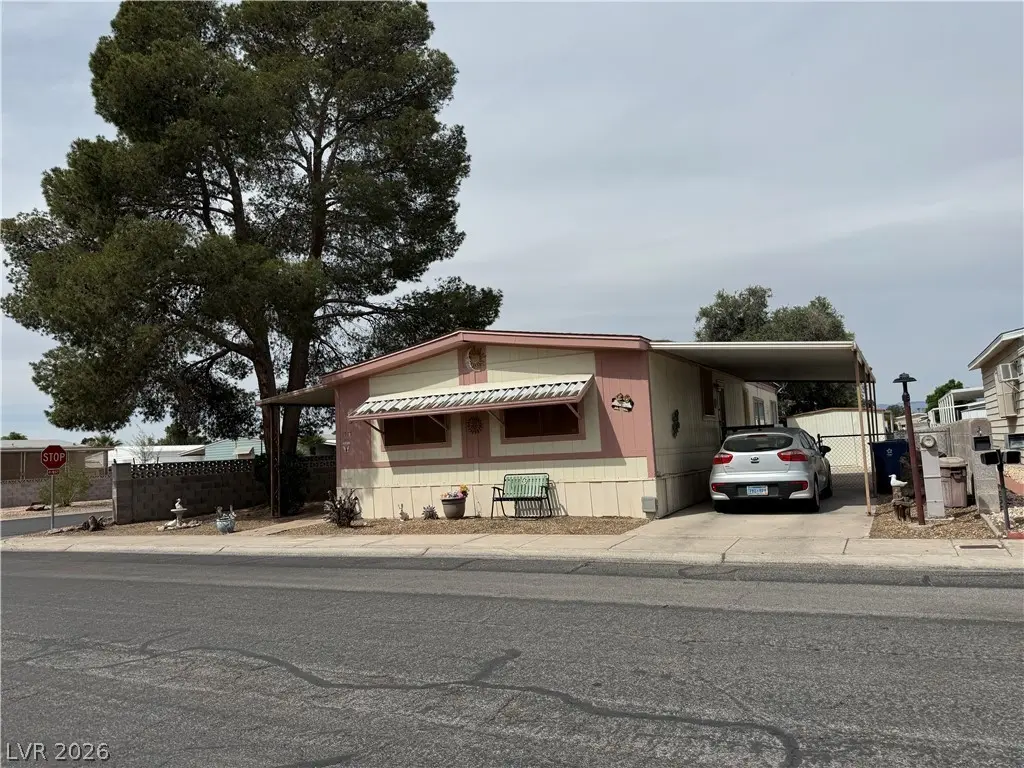
3579 Isle Royale Dr · Sunrise Manor, NV
Flood risk 1/10 · Minimal
- FEMA flood zone
- X (unshaded)
- Chance of flooding over 30 yrs
- 0.0%
- Est. flood insurance / yr
- $507 – $1,088
Fire risk 1/10 · Minimal
- Est. fire insurance / yr
- $490 – $910
Heat risk 8/10 · Major
- Hot days now (above 108°F)
- 7 days/yr
- Hot days in 30 yrs
- 16 days/yr
Wind risk 1/10 · Minimal
- Chance of severe wind over 30 yrs
- —
Air-quality risk 3/10 · Minor
- Unhealthy air days now
- 3 days/yr
- Unhealthy air days in 30 yrs
- 4 days/yr
Risk factors via First Street. Map © Google.
Why this score? — see what drove the C grade
The composite is a weighted blend of 9 inputs, each scored 0–100. Each bar is that input's sub-score; the figure is the points it added to the 100-point composite (weight × sub-score).
- Cash flow +25.1/30.0
- DSCR +8.2/10.0
- 1% rule +7.5/10.0
- ARV discount +7.5/15.0
- Livability +2.9/5.0
- Schools +2.6/10.0
- Condition / age +2.5/5.0
- Rent growth +2.3/5.0
- Appreciation +0.0/10.0
$115,000
🖨 Deal sheet 📄 Offer letter ✓ Due diligence
Listing remarks
Great fixer upper. CASH ONLY Needs a lot of TLC
Key facts
- 5,227 sq ft lot
- Parking
- Community pool
Property features AI
Finance
- Other: Community pool
- HOA & community: Part of Desert Inn Estates HOA (monthly fee); HOA fee includes security; Community clubhouse; Community pool; Community spa/hot tub; Senior community
Exterior
- Parking: Attached carport; Includes 1 carport space; Guest parking
- Security: HOA provides security
- Utilities: Public water; Public sewer; Cable available; Photovoltaics: none
- Home design: Single-family property; One story; Faces east; Manufactured home (48' x 24')
- Construction: Frame construction; Composition/shingle roof; Resale condition
- Exterior features: Handicap accessible; Porch; Private yard; Shed(s); Brick backyard fencing; Landscaped lot; Trees; Less than quarter acre lot
Interior
- Kitchen: Breakfast bar/counter; Laminate countertops; Linoleum/vinyl flooring in kitchen; Gas range
- Bedrooms: 2 possible bedrooms
- Flooring: Carpet; Linoleum; Vinyl
- Bathrooms: 2 full bathrooms
- Heating & cooling: Central heating (gas); Central electric air conditioning
- Interior features: Unfurnished; Bedroom on main level; Primary bedroom downstairs; Paneling/wainscoting
- Laundry & utility: Gas dryer hookup; Laundry on main level
Neighborhood map
What this means for you Summary
Snapshot
- This is a 2-bed/2.0-bath land listed at $115k.
Deal economics
- At list price, monthly cash flow is $252 ($3k/yr) — positive.
- The deal already cash-flows at list — no discount required.
- Meets the 1% rule at list price ($1k rent vs $115k).
Location & tenants
- Location reads 58/100 on livability (#83 in NV) — a working-class tenant base; expect higher turnover. Strengths: cost of living A+, housing A+; Watch: employment D, schools F, crime F.
- Clark County School District (urban): math 21% / reading 39% proficiency, ranked #11 of 17 in NV (top 65%) — families likely to look elsewhere, expect single-tenant / working-renter base with shorter leases.
- Market conditions: Rents soft (-0.6%/yr); 323 active listings in the ZIP; 40 comparable units currently listed for rent nearby; rentals at typical pace (median 15d on market — plan ~3-4 weeks tenant-placement turnaround); 14,754 units permitted in Clark County in 2024 (2,301 in 5+ unit buildings).
Forward outlook
- Local home prices are declining (-3.0%/yr); year-one equity from $795 of loan paydown is wiped out by about $3k of value loss. Plan a longer hold.
- Clark County population projected at +36% by 2050 — long-run rental-demand tailwind backs the buy-and-hold thesis.
Negotiation context
- Only 1 days on market — expect competitive offers; lowballing is unlikely to land.
Risks & watch-outs
- Climate carrying-cost: extreme-heat days projected 7→16/yr by 2055 (HVAC capex compounding) — expect insurance premiums to compound above CPI over the hold.
Questions for the listing agent
- Built in 1976 — when were the roof, HVAC, electrical panel, plumbing, and water heater last replaced?
- What does the HOA fee cover, when was the last increase, and are there any pending special assessments or reserve-fund shortfalls?
- Is there a deadline driving the sale (1031 exchange, divorce, estate, relocation)? That informs how much negotiation room exists.
- Schools are F-rated, which usually means shorter tenancies and higher turnover. Who's the typical renter profile here, and what's been the actual vacancy rate?
- Crime grade is F in this area — have there been break-ins, vandalism, or insurance claims at this property in the last 3 years? What carrier currently insures it and at what premium?
- What's the average days-on-market for RENTAL listings here right now (not sales)? A rising rental-DOM trend means longer vacancies and softer asking-rent achievability than the comps imply.
- What's the recent tenant-quality profile in this submarket — average credit score on applications, eviction rate, late-payment / NSF rate, and stable-employment percentage? A property-management company in the area should have these aggregated.
- How much new for-sale + rental construction is in the pipeline within 1–3 miles? Heavy new supply typically softens prices + rents 12–24 months out; constrained supply supports both.
Investment metrics
- 1% rule
- 1.25% ✓
- Cap rate
- 8.93%
- Cash-on-cash
- 9.40%
- DSCR
- 1.42
- GRM
- 6.7
CMA / ARV
No comps found within radius.
Projected returns pro-forma
-3.0% appreciation · 0.0% rent growth · sell at horizon
- IRR
- -5.8%
- Equity multiple
- 0.79×
- Total profit
- $-6,694
- Equity at exit
- $17,147
- IRR
- -0.6%
- Equity multiple
- 0.97×
- Total profit
- $-1,078
- Equity at exit
- $9,943
Cash invested: $32,200 (down + closing). Projections, not guarantees.
Landlord ↔ Tenant lean methodology
- Overall (STATE)
- 71 Landlord-Friendly
- State Nevada
- 71 Landlord-Friendly · R+1
- County
- — inherits STATE
- City
- — inherits STATE
ZIP-level market 89122
- Rents YoY
- -0.6%
- Active inventory
- 323
- Price-to-rent
- 6.7×
Monthly cashflow live
- Estimated rent
- $1,434 high interval (Pro) →
- Mortgage (P&I)
- −$603
- Tax est. 1.5%
- −$144 /mo · $1,725/yr
- Insurance
- −$48
- HOA
- −$86
- Vacancy / Maint / Mgmt
- −$301
- Net cashflow
- $252
Break-even live
UW: 25.0% down · 7.5% · 30yr · 1.5% tax · 5.0% vac · 8.0% maint · 8.0% mgmt
Financing live
Cash to close
- Down payment
- $28,750
- Closing costs
- $3,450
- Reserves months
- —
- Total cash needed
- —
Loan-product check · same deal, 3 products live
Conventional
25% down · 7.5% · 30yr
- Down + closing
- —
- Monthly P&I
- —
- Monthly cashflow
- —
- DSCR
- —
- Eligible?
- —
Personal DTI + credit; lowest rate.
DSCR
20% down · 8.5% · 30yr
- Down + closing
- —
- Monthly P&I
- —
- Monthly cashflow
- —
- DSCR
- —
- Eligible?
- —
No personal income docs; deal must DSCR.
Hard money
10% down · 12.0% · 12mo
- Down + closing
- —
- Monthly P&I
- —
- Monthly cashflow
- —
- DSCR
- —
- Eligible?
- —
Short-term bridge; refi at stabilization.
Rent comps 40 comps
| Address | Beds | Baths | Sqft | Rent | $/sqft | DOM | Units | Dist |
|---|---|---|---|---|---|---|---|---|
| 5101 E Twain Ave Las Vegas, NV | 1.0–2.0 | 1.0–2.0 | 780 | $1,150 | $1.47 | 43d | 4 | 0.24mi |
| 3481 Cape Cod Dr Las Vegas, NV | 2.0 | 2.0 | 840 | $1,300 | $1.55 | 3d | 1 | 0.28mi |
| 5051 Sitka Ln Las Vegas, NV | 3.0 | 2.0 | 1265 | $1,225 | $0.97 | 43d | 1 | 0.29mi |
| 3800 S Nellis Blvd Las Vegas, NV | 1.0–3.0 | 1.0–2.0 | 943 | $1,355 | $1.44 | 2d | 16 | 0.35mi |
| 3400 Cabana Dr Las Vegas, NV | 2.0–3.0 | 2.0 | 1124 | $1,325 | $1.18 | 22d | 2 | 0.42mi |
| 3400 Cabana Dr #2019 Las Vegas, NV | 2.0 | 2.0 | 1053 | $1,350 | $1.28 | 14d | 1 | 0.42mi |
| 3055 S Nellis Blvd Las Vegas, NV | 1.0–2.0 | 1.0–2.0 | 983 | $1,432 | $1.46 | 2d | 41 | 0.90mi |
| 3850 Mountain Vista St Las Vegas, NV | 1.0–3.0 | 1.0–2.0 | 802 | $1,206 | $1.50 | 14d | 9 | 0.92mi |
| 2978 Juniper Hills Blvd #204 Las Vegas, NV | 2.0 | 2.0 | 884 | $1,245 | $1.41 | 20d | 1 | 0.92mi |
| 2980 Juniper Hills Blvd #103 Las Vegas, NV | 2.0 | 2.0 | 896 | $1,090 | $1.22 | 12d | 1 | 0.93mi |
| 2980 Juniper Hills Blvd Las Vegas, NV | 2.0 | 2.0 | 896 | $1,090 | $1.22 | 3d | 1 | 0.93mi |
| 2982 Juniper Hills Blvd #202 Las Vegas, NV | 3.0 | 2.0 | 1074 | $1,700 | $1.58 | 43d | 1 | 0.93mi |
| 2985 Juniper Hills Blvd #102 Las Vegas, NV | 2.0 | 2.0 | 891 | $1,225 | $1.37 | 14d | 1 | 0.94mi |
| 2985 Juniper Hills Blvd #203 Las Vegas, NV | 2.0 | 2.0 | 884 | $1,000 | $1.13 | 7d | 1 | 0.94mi |
| 2977 Juniper Hills Blvd #104 Las Vegas, NV | 2.0 | 2.0 | 896 | $1,050 | $1.17 | 7d | 1 | 0.94mi |
| 2979 Juniper Hills Blvd #203 Las Vegas, NV | 2.0 | 2.0 | 889 | $1,195 | $1.34 | 20d | 1 | 0.94mi |
| 2972 Juniper Hills Blvd #202 Las Vegas, NV | 3.0 | 2.0 | 1074 | $1,445 | $1.35 | 14d | 1 | 0.95mi |
| 3037 Aloha Ave Las Vegas, NV | 3.0 | 2.0 | 1270 | $1,800 | $1.42 | 4d | 1 | 0.95mi |
| 2974 Juniper Hills Blvd #102 Las Vegas, NV | 3.0 | 2.0 | 867 | $1,620 | $1.87 | 14d | 1 | 0.95mi |
| 2974 Juniper Hills Blvd Las Vegas, NV | 3.0 | 2.0 | 867 | $1,620 | $1.87 | 12d | 1 | 0.95mi |
| 2975 Juniper Hills Blvd #204 Las Vegas, NV | 2.0 | 2.0 | 884 | $1,000 | $1.13 | 43d | 1 | 0.95mi |
| 3021 Aloha Ave Las Vegas, NV | 3.0 | 2.0 | 1270 | $1,800 | $1.42 | 3d | 1 | 0.96mi |
| 2962 Juniper Hills Blvd #104 Las Vegas, NV | 3.0 | 2.0 | 1074 | $1,550 | $1.44 | 43d | 1 | 0.97mi |
| 2963 Juniper Hills Blvd #204 Las Vegas, NV | 2.0 | 2.0 | 884 | $1,250 | $1.41 | 16d | 1 | 0.97mi |
| 2963 Juniper Hills Blvd #204 Las Vegas, NV | 2.0 | 2.0 | 884 | $1,250 | $1.41 | 43d | 1 | 0.97mi |
| 2967 Juniper Hills Blvd #203 Las Vegas, NV | 2.0 | 2.0 | 884 | $1,190 | $1.35 | 43d | 1 | 0.97mi |
| 2967 Juniper Hills Blvd #104 Las Vegas, NV | 2.0 | 4.0 | 891 | $1,350 | $1.52 | 43d | 1 | 0.97mi |
| 2967 Juniper Hills Blvd Las Vegas, NV | 2.0 | 2.0 | 884 | $1,190 | $1.35 | 17d | 1 | 0.97mi |
| 2847 Mammoth Ct Las Vegas, NV | 3.0 | 2.0 | 1440 | $1,700 | $1.18 | 7d | 1 | 0.98mi |
| 4455 E Twain Ave Las Vegas, NV | 1.0–3.0 | 1.0–2.0 | 871 | $1,157 | $1.33 | 4d | 9 | 0.98mi |
| 4855 E Vegas Valley Dr Las Vegas, NV | 1.0–3.0 | 1.0–2.0 | 949 | $1,304 | $1.37 | 2d | 15 | 1.05mi |
| 6103 Falconer Ave Las Vegas, NV | 3.0 | 2.0 | 1234 | $1,690 | $1.37 | 14d | 1 | 1.08mi |
| 6103 Falconer Ave Las Vegas, NV | 3.0 | 2.0 | 1234 | $1,690 | $1.37 | 43d | 1 | 1.08mi |
| 6120 Majestic Wind Ave Las Vegas, NV | 3.0 | 2.0 | 1234 | $1,750 | $1.42 | 4d | 1 | 1.09mi |
| 5421 E Harmon Ave Las Vegas, NV | 1.0–2.0 | 1.0–2.0 | 523 | $1,195 | $2.28 | 2d | 17 | 1.10mi |
| 2689 Rungsted St Las Vegas, NV | 3.0 | 2.0 | 1315 | $1,775 | $1.35 | 43d | 1 | 1.10mi |
| 3956 Clear View Dr Las Vegas, NV | 3.0 | 2.0 | 1306 | $2,600 | $1.99 | 17d | 1 | 1.13mi |
| 5075 Spyglass Hill Dr Las Vegas, NV | 1.0–2.0 | 1.0–2.0 | 851 | $1,421 | $1.67 | 2d | 38 | 1.15mi |
| 4952 E Harmon Ave Las Vegas, NV | 2.0 | 1.0 | 800 | $1,900 | $2.38 | 23d | 1 | 1.17mi |
| 3012 S Mountain Vista St Unit MV Condo Las Vegas, NV | 2.0 | 1.0 | 828 | $945 | $1.14 | 43d | 1 | 1.18mi |
HOA detail
- Monthly dues
- $86 · $1,032/yr
Listing history 2 events
-
2026-05-04status Pending
-
2026-05-04$115,000 Active
ⓘ Source: listings_history table (triggers on properties + properties_extension) + one-shot
backfill from property_details.listing_events for pre-trigger history.
Climate risk First Street
- Flood 1/10 Low FEMA zone X (unshaded) · 0% chance over 30 yrs
- Wildfire 1/10 Low
- Heat 8/10 Severe 7 d/yr ≥108°F today · 16 d/yr by 30 yrs out
- Wind 1/10 Low
- Air quality 3/10 Moderate 3 unhealthy d/yr today · 4 by 30 yrs out
Nearby sold comps map
Loading sold comps map…
Walkable amenities ~0.75 mi
Loading nearby amenities…
Taxation est. · year 1
- Rental income
- $17,211
- − Mortgage interest
- −$6,442
- − Property taxes
- −$1,725
- − Insurance
- −$575
- − Repairs & maintenance
- −$1,377
- − Management
- −$1,377
- − HOA
- −$1,032
- − Depreciation
- −$3,345
- Taxable income
- $1,338
- Est. tax owed @ 24.0%
- −$321
- After-tax cash flow
- $2,707/yr
For passive investors: Depreciation is non-cash, so a rental often shows a tax loss while cash-flowing — sheltering income. Rental losses are passive: they offset passive income freely, and up to $25,000/yr can offset ordinary (W-2) income if you actively participate and your MAGI is under $100k (phasing out to $0 by $150k); unused losses carry forward. On sale, claimed depreciation is recaptured at up to 25%, and gains may owe capital-gains tax (a 1031 exchange can defer both). Figures are a year-1 estimate at your 24.0% rate — not tax advice; consult a CPA.
Schools (NCES district)
- District
- Clark County School District
- NCES district ID
- 3200060
- Math proficiency
- 21% ▼ -13.00%
- Reading proficiency
- 39% ▼ -8.00%
- Median HH income
- $53,611
- Composite
- 26.48/100
- National rank
- #7211
- State rank
- #11 of 17 in NV
Livability — Sunrise Manor
- Score
- 58/100
- State rank
- #83
- US rank
- #20692
Category grades
Schools grade is shown separately in the Schools card above.
Census & demographics
- Census place
- Sunrise Manor, NV
- County
- Clark County · 2,306,105 people
- City population
- 102,557
- Metro
- Las Vegas-Henderson-Paradise, NV
- Population (ZIP)
- 53,724
- Household income
- $63,846
- Rent vs Own
- Severe rent burden
- 2212.0
Population outlook (Clark County) Hauer SSP2
- Today (2025)
- 2,504,101 people
- By 2030
- 2,693,770 · +7.6%
- By 2040
- 3,061,208 · +22.2%
- By 2050
- 3,400,072 · +35.8%
- By 2075
- 4,139,522 · +65.3%
- By 2100
- 4,596,916 · +83.6%
Race, ethnicity, and origin ACS 2023
- Neighborhood character
- Highly diverse neighborhood (Simpson 0.73)
- Race & ethnicity
- Hispanic / Latino 40% White 29% Two or more races 17% Black 14% Asian 10% Native American 2%
- Hispanic origin (detail)
- Mexican 28% Cuban 3%
- Common ancestry
- Lithuanian 1% Romanian 1% Portuguese 1%
- Foreign-born
- 26% · Canada, South Korea, Vietnam
- Languages at home
- 61% English-only · Spanish 29% Tagalog/Filipino 6% Other Asian/Pacific 1%
Political lean MEDSL · Clark
- 2024 margin
- Toss-up / Even · D 50.4% · R 47.8% · Other 1.7%
- 2008→2024 swing
- -16.5pp toward R · 2008: 19.1pp · 2024: 2.6pp
- All cycles
- 2024: D+2.6 2020: D+9.3 2016: D+10.7 2012: D+14.5 2008: D+19.1
Not yet ingested
- Civics
- —
Market trends
- HPI YoY
- ▼ -243.52%
- Current HPI
- 274.1767
- Rent YoY
- ▼ -0.63%
- Metro
- Las Vegas-Henderson-Paradise, NV
- State GDP YoY
- ▲ 3.08%
- F500 in state
- 6
Industry mix (Fortune 500 HQ in NV)
| Industry | F500 HQs | Revenue |
|---|---|---|
| Hotels / Casinos | 3 | $36B |
|
||
Price history
2 events — show timeline
- 2026-05-04 Pending — GLVAR
- 2026-05-04 Listed $115,000 GLVAR
Property tax history
-2.5%/yrLatest (2025): $190 · +1.6% YoY. Source: county tax records.
Cash-flow waterfall
monthlySold comps — $/sqft
last 12 mo · ≤1 miLoading sold comps…