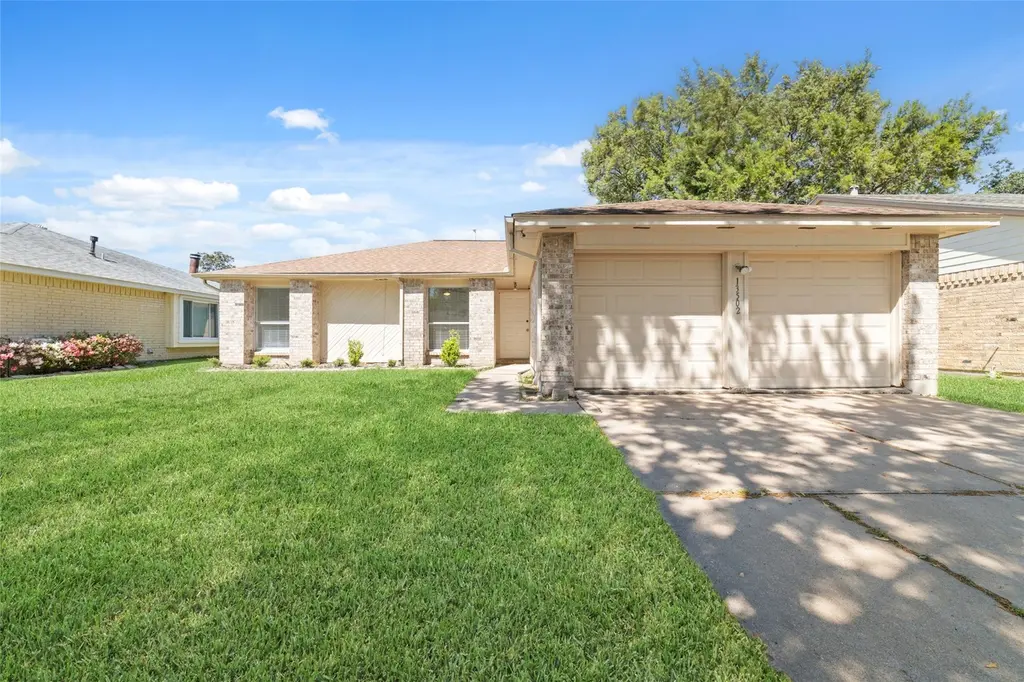
13502 Wells River Dr · Houston, TX
Flood risk 1/10 · Minimal
- FEMA flood zone
- X (unshaded)
- Chance of flooding over 30 yrs
- 0.0%
- Est. flood insurance / yr
- $507 – $1,088
Fire risk 3/10 · Minor
- Est. fire insurance / yr
- $1,222 – $2,270
Heat risk 9/10 · Severe
- Hot days now (above 110°F)
- 7 days/yr
- Hot days in 30 yrs
- 23 days/yr
Wind risk 9/10 · Severe
- Chance of severe wind over 30 yrs
- 99.0%
Air-quality risk 3/10 · Minor
- Unhealthy air days now
- 2 days/yr
- Unhealthy air days in 30 yrs
- 3 days/yr
Risk factors via First Street. Map © Google.
Why this score? — see what drove the D+ grade
The composite is a weighted blend of 9 inputs, each scored 0–100. Each bar is that input's sub-score; the figure is the points it added to the 100-point composite (weight × sub-score).
- ARV discount +12.8/15.0
- Cash flow +10.6/30.0
- Schools +4.4/10.0
- Appreciation +4.3/10.0
- 1% rule +3.9/10.0
- Livability +3.7/5.0
- DSCR +3.1/10.0
- Rent growth +2.6/5.0
- Condition / age +2.5/5.0
$210,000
🖨 Deal sheet (PDF) 📄 Offer letter ✓ Due diligence
Listing remarks MLS
Looking for a Fixer-Upper in a great location? Make this your dream home today! 3 bedrooms and 2 baths can be great for a starter home. Renovate the interior as per your liking. Wood Burning Fireplace to make you feel warm and fuzzy. High ceiling living area open to dining, makes entertaining easier.
Key facts
- Spacious living area
- Open layout
- 6,298 sq ft lot
Tags
Neighborhood map
What this means for you Summary
Snapshot
- This is a 3-bed/2.0-bath single-family listed at $210k.
Deal economics
- At list price, monthly cash flow is $-104 ($-1k/yr) — negative.
- To cash-flow at today's rent, offer at most $192k (8.8% below list).
- To meet the 1% rule (rent ≥ 1% of price), the offer needs to be $187k (11.2% below list).
- Recommended offer: $187k (11.2% below list) — sets the bar for 1% rule.
- Cap rate 5.7% vs local median 3.2% in Houston — top-decile yield for the area; either an underpriced asset or a hidden risk that comps aren't pricing in. Stress-test before assuming the spread holds.
Location & tenants
- Location reads 74/100 on livability (#184 in TX, #4,771 nationally) — a middle-class / working-renter tenant base. Strengths: amenities A+, cost of living A+, housing A+; Watch: crime F.
- Cypress-Fairbanks ISD (suburban): math 45% / reading 52% proficiency, ranked #161 of 826 in TX (top 20%) — families likely to look elsewhere, expect single-tenant / working-renter base with shorter leases.
- Zoned schools: Lee El (math 35% / reading 35%, grade F, #1,965 of 4,322 statewide, top 46%, 873 students, 78% FRL); Truitt Middle (math 34% / reading 41%, grade F, #736 of 1,662 statewide, top 45%, 1,419 students, 76% FRL); Cypress-Fairbanks J J A E P (12 students, 0% FRL).
- Zoned-school proficiency averages 36% at this address vs 48% district-wide (-12 pts) — the specific schools serving this property underperform the Cypress-Fairbanks ISD average; the district grade overstates school quality for this exact location.
- Market conditions: Rents flat; 177 active listings in the ZIP; 8 comparable units currently listed for rent nearby; rentals at typical pace (median 24d on market — plan ~3-4 weeks tenant-placement turnaround); solid renter incomes; 29,883 units permitted in Harris County in 2024 (8,621 in 5+ unit buildings).
Forward outlook
- Local home prices are declining (-1.5%/yr); year-one equity from $1k of loan paydown is wiped out by about $3k of value loss. Plan a longer hold.
- Harris County population projected at +47% by 2050 — long-run rental-demand tailwind backs the buy-and-hold thesis.
Negotiation context
- Only 13 days on market — expect competitive offers; lowballing is unlikely to land.
- 2 sale attempts since 4y ago with the ask held roughly flat each time — persistent listings suggest the price (not the market) is what's stuck; bring a comps-based counter.
- Current owner paid $55k; list at $210k implies a 282% gain — meaningful room to come down on a strong offer.
Risks & watch-outs
- Climate carrying-cost: severe wind risk, 99% chance of damaging wind over 30y; extreme-heat days projected 7→23/yr by 2055 (HVAC capex compounding) — expect insurance premiums to compound above CPI over the hold.
Questions for the listing agent
- What do current leases actually rent for vs. the listed asking? Can we see a recent rent roll and the last 12 months of T-12 income?
- What does the HOA fee cover, when was the last increase, and are there any pending special assessments or reserve-fund shortfalls?
- Is there a deadline driving the sale (1031 exchange, divorce, estate, relocation)? That informs how much negotiation room exists.
- Schools are D-rated, which usually means shorter tenancies and higher turnover. Who's the typical renter profile here, and what's been the actual vacancy rate?
- Crime grade is F in this area — have there been break-ins, vandalism, or insurance claims at this property in the last 3 years? What carrier currently insures it and at what premium?
- The area grade is low — what's the realistic commute time and amenity access for the typical tenant pool here? Any planned neighborhood developments (good or bad) we should know about?
- What's the average days-on-market for RENTAL listings here right now (not sales)? A rising rental-DOM trend means longer vacancies and softer asking-rent achievability than the comps imply.
- What's the recent tenant-quality profile in this submarket — average credit score on applications, eviction rate, late-payment / NSF rate, and stable-employment percentage? A property-management company in the area should have these aggregated.
- How much new for-sale + rental construction is in the pipeline within 1–3 miles? Heavy new supply typically softens prices + rents 12–24 months out; constrained supply supports both.
Investment metrics
- 1% rule
- 0.89% ✗
- Cap rate
- 5.70%
- Cash-on-cash
- -2.13%
- DSCR
- 0.91
- GRM
- 9.4
CMA / ARV
- ARV (on-the-fly)
- $238,000
- Comps found
- 12
Show comp detail 12 sales within ~0.75 mi
| Address | Dist | Beds/Ba | Sqft | Sold | Price | $/sf | Match |
|---|---|---|---|---|---|---|---|
| 13502 Wells River Dr | 0.00mi | 3/2.0 | 1,360 (0%) | 1mo | $210,000 | $154 | 99 |
| 6118 Alstead Dr | 0.11mi | 3/2.0 | 1,360 (0%) | 3mo | $175,000 | $129 | 93 |
| 13511 Lyndonville Dr | 0.03mi | 3/2.0 | 1,520 (+12%) | 5mo | $285,000 | $188 | 74 |
| 6247 Bryant Pond Dr | 0.18mi | 3/2.0 | 1,520 (+12%) | 4mo | $211,000 | $139 | 69 |
| 13331 Harpers Bridge Dr | 0.39mi | 3/2.0 | 1,440 (+6%) | 4mo | $259,900 | $180 | 68 |
| 13303 Klamath Falls Dr | 0.28mi | 3/2.0 | 1,284 (-6%) | 11mo | $239,777 | $187 | 68 |
| 13327 Harpers Bridge Dr | 0.39mi | 4/2.5 (+1) | 1,400 (+3%) | 4mo | $256,999 | $184 | 66 |
| 13519 Bridgepath Cv | 0.34mi | 3/2.0 | 1,412 (+4%) | 14mo | $235,000 | $166 | 66 |
| 13311 Klamath Falls Dr | 0.27mi | 3/2.0 | 1,284 (-6%) | 22mo | $224,900 | $175 | 60 |
| 13506 Bridgepath Cv | 0.30mi | 3/2.0 | 1,203 (-12%) | 12mo | $245,000 | $204 | 57 |
| 5714 Wynberry Dr | 0.49mi | 3/2.0 | 1,410 (+4%) | 19mo | $209,900 | $149 | 55 |
| 13315 Somersworth Dr | 0.21mi | 2/1.0 (-1) | 1,156 (-15%) | 16mo | $199,000 | $172 | 43 |
Match score weights: distance 35% · size 25% · config 20% · recency 20%. Top-matched comps best support the ARV.
Projected returns pro-forma
-1.47% appreciation · 0.25% rent growth · sell at horizon
- IRR
- -13.4%
- Equity multiple
- 0.46×
- Total profit
- $-31,785
- Equity at exit
- $45,999
- IRR
- -9.6%
- Equity multiple
- 0.27×
- Total profit
- $-42,656
- Equity at exit
- $44,408
Cash invested: $58,800 (down + closing). Projections, not guarantees.
Landlord ↔ Tenant lean methodology
- Overall (STATE)
- 87 Strongly Landlord-Friendly
- State Texas
- 87 Strongly Landlord-Friendly · R+5
- County
- — inherits STATE
- City
- — inherits STATE
ZIP-level market 77041
- Home prices YoY
- -0.6%
- Rents YoY
- 0.2%
- Active inventory
- 177
- Price-to-rent
- 9.4×
Monthly cashflow live
- Estimated rent
- $1,865 high interval (Pro) →
- Mortgage (P&I)
- −$1,101
- Tax from tax record
- −$358 /mo · $4,297/yr
- Insurance
- −$88
- HOA
- −$31
- Vacancy / Maint / Mgmt
- −$392
- Net cashflow
- $-104
Break-even live
Sensitivity live
| Price | -10% $15 | -5% $-45 | +0% $-104 | +5% $-164 | +10% $-223 |
|---|---|---|---|---|---|
| Rent | -10% $-252 | -5% $-178 | +0% $-104 | +5% $-31 | +10% $43 |
| Rate | -1.0pp $1 | -0.5pp $-51 | base $-104 | +0.5pp $-159 | +1.0pp $-214 |
UW: 25.0% down · 7.5% · 30yr · 1.5% tax · 5.0% vac · 8.0% maint · 8.0% mgmt
Financing live
Cash to close
- Down payment
- $52,500
- Closing costs
- $6,300
- Reserves months
- —
- Total cash needed
- —
Loan-product check · same deal, 3 products live
Conventional
25% down · 7.5% · 30yr
- Down + closing
- —
- Monthly P&I
- —
- Monthly cashflow
- —
- DSCR
- —
- Eligible?
- —
Personal DTI + credit; lowest rate.
DSCR
20% down · 8.5% · 30yr
- Down + closing
- —
- Monthly P&I
- —
- Monthly cashflow
- —
- DSCR
- —
- Eligible?
- —
No personal income docs; deal must DSCR.
Hard money
10% down · 12.0% · 12mo
- Down + closing
- —
- Monthly P&I
- —
- Monthly cashflow
- —
- DSCR
- —
- Eligible?
- —
Short-term bridge; refi at stabilization.
Rent comps 8 comps
| Address | Beds | Baths | Sqft | Rent | $/sqft | DOM | Units | Dist |
|---|---|---|---|---|---|---|---|---|
| 6103 Wolfboro Dr Houston, TX | 3.0 | 2.0 | 1440 | $1,745 | $1.21 | 26d | 1 | 0.20mi |
| 12410 W Little York Rd Houston, TX | 1.0–2.0 | 1.0–2.0 | 1032 | $1,779 | $1.72 | 1d | 15 | 1.26mi |
| 12416 W Little York Rd Houston, TX | 3.0 | 2.0 | 1542 | $1,849 | $1.20 | 21d | 1 | 1.29mi |
| 12416 W Little York Rd Houston, TX | 2.0 | 2.0 | 1235 | $1,489 | $1.21 | 19d | 1 | 1.29mi |
| 12416 W Little York Rd Houston, TX | 3.0 | 2.0 | 1542 | $1,849 | $1.20 | 20d | 1 | 1.29mi |
| 12416 W Little York Rd Houston, TX | 2.0 | 2.0 | 1235 | $1,489 | $1.21 | 23d | 1 | 1.29mi |
| 6102 Crakston St Houston, TX | 3.0 | 2.0 | 1862 | $1,850 | $0.99 | 45d | 1 | 1.39mi |
| 6607 Readsland Ln Houston, TX | 4.0 | 2.0 | 1832 | $2,500 | $1.36 | 45d | 1 | 1.50mi |
HOA detail
- Monthly dues
- $31 · $372/yr
Listing history 10 events
-
2026-04-07status Pending
-
2026-03-30status Pending
-
2026-03-24$210,000 Active
-
2022-05-16soldstatus
-
2022-05-09soldstatus Sold 301-char remark
Show marketing remark (301 chars)
Looking for a Fixer-Upper in a great location? Make this your dream home today! 3 bedrooms and 2 baths can be great for a starter home. Renovate the interior as per your liking. Wood Burning Fireplace to make you feel warm and fuzzy. High ceiling living area open to dining, makes entertaining easier.
-
2022-04-02status Pending 301-char remark
Show marketing remark (301 chars)
Looking for a Fixer-Upper in a great location? Make this your dream home today! 3 bedrooms and 2 baths can be great for a starter home. Renovate the interior as per your liking. Wood Burning Fireplace to make you feel warm and fuzzy. High ceiling living area open to dining, makes entertaining easier.
-
2022-03-23$180,000 Active 301-char remark
Show marketing remark (301 chars)
Looking for a Fixer-Upper in a great location? Make this your dream home today! 3 bedrooms and 2 baths can be great for a starter home. Renovate the interior as per your liking. Wood Burning Fireplace to make you feel warm and fuzzy. High ceiling living area open to dining, makes entertaining easier.
-
2003-01-03soldstatus
-
1996-08-27soldstatus $55,000
-
1989-11-01soldstatus $46,150
ⓘ Source: listings_history table (triggers on properties + properties_extension) + one-shot
backfill from property_details.listing_events for pre-trigger history.
Tax reassessment forecast TX · Resets to sale price
- Current annual tax
- $4,297 · $358/mo
- Projected year-2 tax
- $4,297 · $358/mo
- Expected delta
- $0/yr ($0/mo · 0.0%)
ⓘ Screening estimate from a state-policy table — verify with the county assessor before closing.
Climate risk First Street
- Flood 1/10 Low FEMA zone X (unshaded) · 0% chance over 30 yrs
- Wildfire 3/10 Moderate
- Heat 9/10 Extreme 7 d/yr ≥110°F today · 23 d/yr by 30 yrs out
- Wind 9/10 Extreme 99% chance of damaging wind over 30 yrs
- Air quality 3/10 Moderate 2 unhealthy d/yr today · 3 by 30 yrs out
Nearby sold comps map
Loading sold comps map…
Walkable amenities ~0.75 mi
Loading nearby amenities…
Taxation est. · year 1
- Rental income
- $22,382
- − Mortgage interest
- −$11,763
- − Property taxes
- −$4,297
- − Insurance
- −$1,050
- − Repairs & maintenance
- −$1,791
- − Management
- −$1,791
- − HOA
- −$372
- − Depreciation
- −$6,109
- Taxable loss
- −$4,790
- Est. tax savings @ 24.0%
- +$1,150
- After-tax cash flow
- $-102/yr
For passive investors: Depreciation is non-cash, so a rental often shows a tax loss while cash-flowing — sheltering income. Rental losses are passive: they offset passive income freely, and up to $25,000/yr can offset ordinary (W-2) income if you actively participate and your MAGI is under $100k (phasing out to $0 by $150k); unused losses carry forward. On sale, claimed depreciation is recaptured at up to 25%, and gains may owe capital-gains tax (a 1031 exchange can defer both). Figures are a year-1 estimate at your 24.0% rate — not tax advice; consult a CPA.
Schools (NCES district)
- District
- Cypress-Fairbanks ISD
- NCES district ID
- 4816110
- Math proficiency
- 45% ▼ -12.00%
- Reading proficiency
- 52% ▼ -2.00%
- Median HH income
- $72,025
- Composite
- 43.63/100
- National rank
- #2968
- State rank
- #161 of 826 in TX
Livability — Houston
- Score
- 74/100
- State rank
- #184
- US rank
- #4771
Category grades
Schools grade is shown separately in the Schools card above.
Census & demographics
- County
- Harris County · 4,702,590 people
- City population
- 3,226,434
- Metro
- Houston-The Woodlands-Sugar Land, TX
- Population (ZIP)
- 33,349
- Household income
- $77,083
- Rent vs Own
- Severe rent burden
- 537.0
Population outlook (Harris County) Hauer SSP2
- Today (2025)
- 5,571,493 people
- By 2030
- 6,089,821 · +9.3%
- By 2040
- 7,142,806 · +28.2%
- By 2050
- 8,185,864 · +46.9%
- By 2075
- 10,574,329 · +89.8%
- By 2100
- 12,109,958 · +117.4%
Race, ethnicity, and origin ACS 2023
- Neighborhood character
- Diverse neighborhood (Simpson 0.67)
- Race & ethnicity
- Hispanic / Latino 50% Two or more races 25% White 23% Asian 16% Black 9% Native American 3%
- Hispanic origin (detail)
- Mexican 36% Cuban 2% Salvadoran 1%
- Common ancestry
- Italian 1% Portuguese 1% Romanian 1%
- Foreign-born
- 38% · Canada, Vietnam, China
- Languages at home
- 45% English-only · Spanish 39% Vietnamese 8% Other Indo-European 3%
Political lean MEDSL · Harris
- 2024 margin
- Lean D (+5.5) · D 52.0% · R 46.4% · Other 1.6%
- 2008→2024 swing
- +3.9pp toward D · 2008: 1.6pp · 2024: 5.5pp
- All cycles
- 2024: D+5.5 2020: D+13.3 2016: D+12.4 2012: D+0.1 2008: D+1.6
Not yet ingested
- Civics
- —
Market trends
- HPI YoY
- ▼ -1.47%
- Current HPI
- 241.5096
- Rent YoY
- ▲ 0.25%
- Metro
- Houston-The Woodlands-Sugar Land, TX
- State GDP YoY
- ▲ 3.95%
- F500 in state
- 110
Industry mix (Fortune 500 HQ in TX)
| Industry | F500 HQs | Revenue |
|---|---|---|
| Energy | 16 | $1,198B |
|
||
| Technology | 5 | $198B |
|
||
| Engineering / Construction | 4 | $72B |
|
||
| Energy Services | 3 | $60B |
|
||
| Utilities | 3 | $41B |
|
||
| Healthcare | 2 | $330B |
|
||
Price history
+355.0% since first listed10 events — show timeline
- 2026-04-07 Pending — HARMLS
- 2026-03-30 Pending — HARMLS
- 2026-03-24 Listed $210,000 HARMLS
- 2022-05-16 Sold (Public Records) — Public Records
- 2022-05-09 Sold (MLS) — HARMLS
- 2022-04-02 Pending — HARMLS
- 2022-03-23 Listed $180,000 HARMLS
- 2003-01-03 Sold (Public Records) — Public Records
- 1996-08-27 Sold (Public Records) $55,000 Public Records
- 1989-11-01 Sold (Public Records) $46,150 Public Records
Property tax history
+2.2%/yrLatest (2025): $4,297 · -2.0% YoY. Source: county tax records.
Cash-flow waterfall
monthlySold comps — $/sqft
last 12 mo · ≤1 miLoading sold comps…