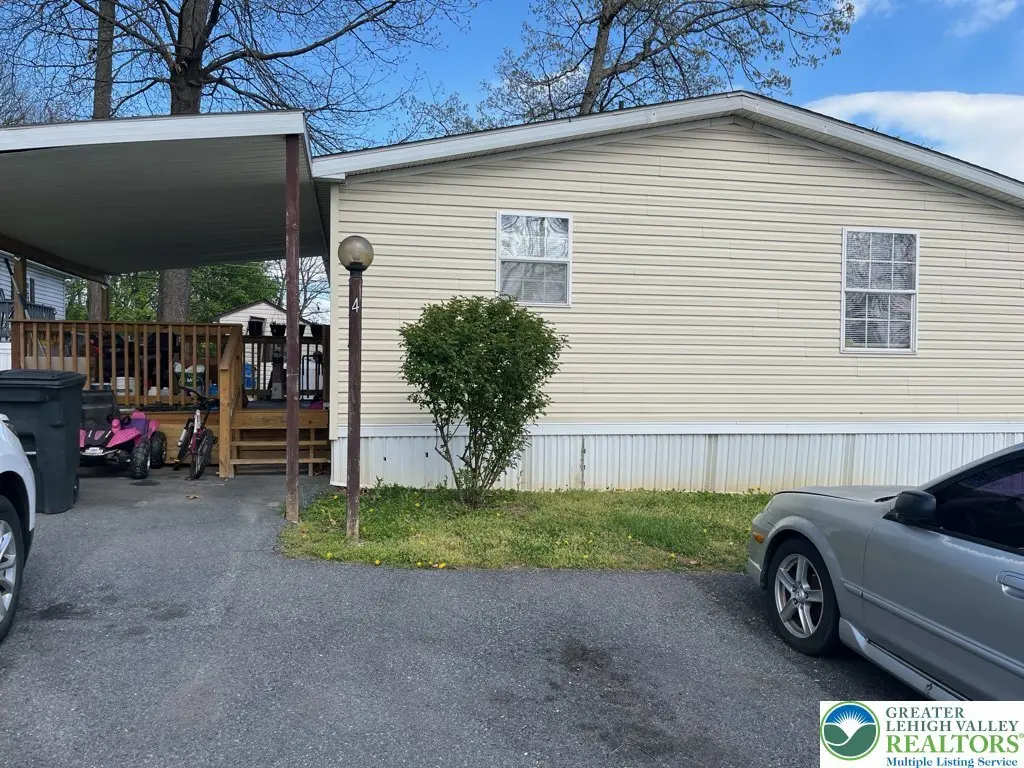
4 Briarwood Ct N · East Allen, PA
Flood risk 1/10 · Minimal
- FEMA flood zone
- X (unshaded)
- Chance of flooding over 30 yrs
- 0.0%
- Est. flood insurance / yr
- $507 – $1,088
Fire risk 1/10 · Minimal
- Est. fire insurance / yr
- $511 – $949
Heat risk 5/10 · Moderate
- Hot days now (above 99°F)
- 7 days/yr
- Hot days in 30 yrs
- 16 days/yr
Wind risk 4/10 · Minor
- Chance of severe wind over 30 yrs
- 17.0%
Air-quality risk 3/10 · Minor
- Unhealthy air days now
- 2 days/yr
- Unhealthy air days in 30 yrs
- 5 days/yr
Risk factors via First Street. Map © Google.
Why this score? — see what drove the F grade
The composite is a weighted blend of 9 inputs, each scored 0–100. Each bar is that input's sub-score; the figure is the points it added to the 100-point composite (weight × sub-score).
- 1% rule +10.0/10.0
- Cash flow +7.7/30.0
- Schools +4.4/10.0
- Rent growth +2.5/5.0
- Livability +2.5/5.0
- Condition / age +2.5/5.0
- DSCR +1.8/10.0
- ARV discount +0.0/15.0
- Appreciation +0.0/10.0
$85,000
🖨 Deal sheet 📄 Offer letter ✓ Due diligence
Listing remarks
Discover comfortable living in this charming 3 bedroom 2 bath manufactured home, nestled amidst a grassy lawn and mature trees. A welcoming, partially covered deck with sturdy wooden railings offers an ideal space for outdoor relaxation and entertaining. Step inside to a thoughtfully designed interior featuring durable wood-look flooring throughout the home, including the spacious living areas and cozy bedrooms. The living room boasts a refreshing ceiling fan and vaulted ceilings, creating an open and airy atmosphere. The well-equipped eat-in kitchen showcases white cabinetry, some stainless steel appliances including a dishwasher, microwave and refrigerator. The master bedroom offers a spa
Key facts
- Wood look flooring
- Well maintained lawn
- Private parking
Tags
Property features AI
Finance
- Other: Above grade finished area: 1,120
- HOA & community: Association fee: $998 monthly; Property has a land lease
Exterior
- Parking: Off-street parking; Parking pad
- Utilities: 200+ amp electrical service with circuit breakers; Community/coop sewer; Community/coop water
- Home design: Single-story; Asphalt/fiberglass roof; Aluminum and vinyl siding
- Construction: Aluminum siding; Vinyl siding; Asphalt/fiberglass roof
- Exterior features: Deck; Propane tank (leased); Mobile home on property; Residential zoning
Interior
- Kitchen: Dishwasher; Gas cooktop; Microwave; Refrigerator
- Bedrooms: Total rooms: 6
- Flooring: Hardwood; Tile
- Bathrooms: 2 full bathrooms
- Heating & cooling: Forced air heating (gas and propane); Central air; Ceiling fans
- Interior features: Eat-in kitchen; Vaulted ceilings; Walk-in closet(s)
- Laundry & utility: Electric water heater
Neighborhood map
What this means for you Summary
Snapshot
- This is a 3-bed/2.0-bath manufactured listed at $85k.
Deal economics
- At list price, monthly cash flow is $-97 ($-1k/yr) — negative.
- To cash-flow at today's rent, offer at most $68k (20.1% below list).
- Meets the 1% rule at list price ($2k rent vs $85k).
- Recommended offer: $68k (20.1% below list) — sets the bar for cash-flow.
Location & tenants
- Location reads: area grade F — affects rentability + tenant quality, not the cash-flow math above.
- Northampton Area SD (suburban): math 47% / reading 54% proficiency, ranked #153 of 539 in PA (top 28%) — acceptable for families but not a draw, mixed tenant base, ~2y average lease.
- Market conditions: 62 active listings in the ZIP; 6 comparable units currently listed for rent nearby; rentals leasing fast (median 14d on market — plan ~1-2 weeks tenant-placement turnaround); 567 units permitted in Northampton County in 2024 (151 in 5+ unit buildings).
Forward outlook
- Local home prices are declining (-3.0%/yr); year-one equity from $588 of loan paydown is wiped out by about $3k of value loss. Plan a longer hold.
Negotiation context
- It's been on market 30 days — a 2% lower offer ($84k) is reasonable based on typical stale-listing flexibility.
- 2 sale attempts since 24y ago with the ask held roughly flat each time — persistent listings suggest the price (not the market) is what's stuck; bring a comps-based counter.
Risks & watch-outs
- Watch-outs: HOA is 55% of rent.
- Climate carrying-cost: extreme-heat days projected 7→16/yr by 2055 (HVAC capex compounding) — expect insurance premiums to compound above CPI over the hold.
Questions for the listing agent
- What do current leases actually rent for vs. the listed asking? Can we see a recent rent roll and the last 12 months of T-12 income?
- What does the HOA fee cover, when was the last increase, and are there any pending special assessments or reserve-fund shortfalls?
- Is there a deadline driving the sale (1031 exchange, divorce, estate, relocation)? That informs how much negotiation room exists.
- The area grade is low — what's the realistic commute time and amenity access for the typical tenant pool here? Any planned neighborhood developments (good or bad) we should know about?
- What's the average days-on-market for RENTAL listings here right now (not sales)? A rising rental-DOM trend means longer vacancies and softer asking-rent achievability than the comps imply.
- What's the recent tenant-quality profile in this submarket — average credit score on applications, eviction rate, late-payment / NSF rate, and stable-employment percentage? A property-management company in the area should have these aggregated.
- How much new for-sale + rental construction is in the pipeline within 1–3 miles? Heavy new supply typically softens prices + rents 12–24 months out; constrained supply supports both.
Investment metrics
- 1% rule
- 2.15% ✓
- Cap rate
- 4.93%
- Cash-on-cash
- -4.87%
- DSCR
- 0.78
- GRM
- 3.9
CMA / ARV
- ARV (on-the-fly)
- $61,600
- Comps found
- 6
Show comp detail 6 sales within ~0.75 mi
| Address | Dist | Beds/Ba | Sqft | Sold | Price | $/sf | Match |
|---|---|---|---|---|---|---|---|
| 190 Greenbriar Dr S | 0.45mi | 2/2.0 (-1) | 1,116 (-0%) | 7mo | $75,000 | $67 | 68 |
| 285 Greenbriar Dr | 0.15mi | 2/2.0 (-1) | 980 (-12%) | 2mo | $23,000 | $23 | 66 |
| 223 S Greenbriar Dr | 0.39mi | 2/1.0 (-1) | 1,000 (-11%) | 6mo | $54,900 | $55 | 50 |
| 228 Greenbriar Dr | 0.36mi | 3/2.0 | 1,253 (+12%) | 19mo | $58,000 | $46 | 47 |
| 117 Elder Ct | 0.50mi | 3/2.0 | 1,008 (-10%) | 21mo | $58,000 | $58 | 42 |
| 124 Greenbriar Dr N | 0.50mi | 2/1.0 (-1) | 1,288 (+15%) | 14mo | $65,400 | $51 | 31 |
Match score weights: distance 35% · size 25% · config 20% · recency 20%. Top-matched comps best support the ARV.
Projected returns pro-forma
-3.0% appreciation · 3.0% rent growth · sell at horizon
- IRR
- -23.5%
- Equity multiple
- 0.19×
- Total profit
- $-19,310
- Equity at exit
- $12,674
- IRR
- -16.0%
- Equity multiple
- 0.07×
- Total profit
- $-22,238
- Equity at exit
- $7,349
Cash invested: $23,800 (down + closing). Projections, not guarantees.
Landlord ↔ Tenant lean methodology
- Overall (STATE)
- 62 Landlord-Friendly
- State Pennsylvania
- 62 Landlord-Friendly · EVEN
- County
- — inherits STATE
- City
- — inherits STATE
ZIP-level market 18014
- Active inventory
- 62
- Price-to-rent
- 3.9×
Monthly cashflow live
- Estimated rent
- $1,831 high interval (Pro) →
- Mortgage (P&I)
- −$446
- Tax from tax record
- −$64 /mo · $766/yr
- Insurance
- −$35
- HOA
- −$998
- Vacancy / Maint / Mgmt
- −$384
- Net cashflow
- $-97
Break-even live
UW: 25.0% down · 7.5% · 30yr · 1.5% tax · 5.0% vac · 8.0% maint · 8.0% mgmt
Financing live
Cash to close
- Down payment
- $21,250
- Closing costs
- $2,550
- Reserves months
- —
- Total cash needed
- —
Loan-product check · same deal, 3 products live
Conventional
25% down · 7.5% · 30yr
- Down + closing
- —
- Monthly P&I
- —
- Monthly cashflow
- —
- DSCR
- —
- Eligible?
- —
Personal DTI + credit; lowest rate.
DSCR
20% down · 8.5% · 30yr
- Down + closing
- —
- Monthly P&I
- —
- Monthly cashflow
- —
- DSCR
- —
- Eligible?
- —
No personal income docs; deal must DSCR.
Hard money
10% down · 12.0% · 12mo
- Down + closing
- —
- Monthly P&I
- —
- Monthly cashflow
- —
- DSCR
- —
- Eligible?
- —
Short-term bridge; refi at stabilization.
Rent comps 6 comps
| Address | Beds | Baths | Sqft | Rent | $/sqft | DOM | Units | Dist |
|---|---|---|---|---|---|---|---|---|
| 216 Penn St #8 Bath, PA | 2.0 | 1.0 | 1000 | $1,750 | $1.75 | 2d | 1 | 0.71mi |
| 112 S Chestnut St Bath, PA | 2.0 | 1.0 | 800 | $1,750 | $2.19 | 43d | 1 | 0.92mi |
| 150 N Walnut St Apt A Bath, PA | 2.0 | 1.0 | 1000 | $1,295 | $1.29 | 43d | 1 | 0.98mi |
| 252 N Walnut St #208 Bath, PA | 2.0 | 1.5 | 1100 | $1,850 | $1.68 | 2d | 1 | 1.14mi |
| 282 N Walnut St Bath, PA | 1.0–2.0 | 1.0–2.0 | 1025 | $2,250 | $2.20 | 2d | 8 | 1.20mi |
| 284 N Walnut St Unit 284-107 Bath, PA | 2.0 | 2.0 | 1175 | $2,250 | $1.91 | 13d | 1 | 1.27mi |
HOA detail
- Monthly dues
- $998 · $11,976/yr
Listing history 18 events
-
2026-06-18days on market $85,000 Active 30 DOM
-
2026-06-17days on market $85,000 Active 29 DOM
-
2026-06-16days on market $85,000 Active 28 DOM
-
2026-06-15days on market $85,000 Active 27 DOM
-
2026-06-14days on market $85,000 Active 25 DOM
-
2026-06-10days on market $85,000 Active 22 DOM
-
2026-06-09days on market $85,000 Active 21 DOM
-
2026-06-08days on market $85,000 Active 20 DOM
-
2026-06-07days on market $85,000 Active 19 DOM
-
2026-06-05days on market $85,000 Active 16 DOM
-
2026-06-03days on market $85,000 Active 15 DOM
-
2026-06-02days on market $85,000 Active 14 DOM
-
2026-06-01days on market $85,000 Active 13 DOM
-
2026-05-31days on market $85,000 Active 12 DOM
-
2026-05-31days on market $85,000 Active 11 DOM
-
2026-05-19$85,000 Active
-
2002-11-24historical
-
2002-02-27$45,000
ⓘ Source: listings_history table (triggers on properties + properties_extension) + one-shot
backfill from property_details.listing_events for pre-trigger history.
Tax reassessment forecast PA · Partial reset (capped growth)
- Current annual tax
- $766 · $64/mo
- Projected year-2 tax
- $1,054 · $88/mo
- Expected delta
- +$289/yr (+$24/mo · 37.7%)
ⓘ Screening estimate from a state-policy table — verify with the county assessor before closing.
Climate risk First Street
- Flood 1/10 Low FEMA zone X (unshaded) · 0% chance over 30 yrs
- Wildfire 1/10 Low
- Heat 5/10 Major 7 d/yr ≥99°F today · 16 d/yr by 30 yrs out
- Wind 4/10 Moderate 17% chance of damaging wind over 30 yrs
- Air quality 3/10 Moderate 2 unhealthy d/yr today · 5 by 30 yrs out
Nearby sold comps map
Loading sold comps map…
Walkable amenities ~0.75 mi
Loading nearby amenities…
Taxation est. · year 1
- Rental income
- $21,971
- − Mortgage interest
- −$4,761
- − Property taxes
- −$766
- − Insurance
- −$425
- − Repairs & maintenance
- −$1,758
- − Management
- −$1,758
- − HOA
- −$11,976
- − Depreciation
- −$2,473
- Taxable loss
- −$1,946
- Est. tax savings @ 24.0%
- +$467
- After-tax cash flow
- $-692/yr
For passive investors: Depreciation is non-cash, so a rental often shows a tax loss while cash-flowing — sheltering income. Rental losses are passive: they offset passive income freely, and up to $25,000/yr can offset ordinary (W-2) income if you actively participate and your MAGI is under $100k (phasing out to $0 by $150k); unused losses carry forward. On sale, claimed depreciation is recaptured at up to 25%, and gains may owe capital-gains tax (a 1031 exchange can defer both). Figures are a year-1 estimate at your 24.0% rate — not tax advice; consult a CPA.
Schools (NCES district)
- District
- Northampton Area SD
- NCES district ID
- 4217370
- Math proficiency
- 47% ▼ -1.00%
- Reading proficiency
- 54% ▼ -13.00%
- Median HH income
- $62,326
- Composite
- 44.35/100
- National rank
- #2822
- State rank
- #153 of 539 in PA
Livability — East Allen
No livability data for this city. (Only ~50 U.S. cities are tracked.)
Census & demographics
- Population (ZIP)
- 12,474
Population outlook (Northampton County) Hauer SSP2
- Today (2025)
- 312,227 people
- By 2030
- 314,769 · +0.8%
- By 2040
- 316,914 · +1.5%
- By 2050
- 318,037 · +1.9%
- By 2075
- 334,003 · +7.0%
- By 2100
- 344,696 · +10.4%
Race, ethnicity, and origin ACS 2023
- Neighborhood character
- Predominantly White (88%)
- Race & ethnicity
- White 88% Hispanic / Latino 6% Two or more races 4% Black 3%
- Hispanic origin (detail)
- Puerto Rican 3%
- Common ancestry
- Romanian 4% Polish 3% Danish 3%
- Foreign-born
- 2% · Canada
- Languages at home
- 95% English-only · Spanish 3% Other Indo-European 1%
Political lean MEDSL · Northampton
- 2024 margin
- Toss-up / Even · D 48.6% · R 50.4%
- 2008→2024 swing
- -14.1pp toward R · 2008: 12.3pp · 2024: -1.8pp
- All cycles
- 2024: R+1.8 2020: D+0.7 2016: R+3.8 2012: D+4.6 2008: D+12.3
Not yet ingested
- Civics
- —
Market trends
- HPI YoY
- ▼ -145.54%
- Current HPI
- 212.4688
- Rent YoY
- —
- Metro
- —
- State GDP YoY
- ▲ 1.68%
- F500 in state
- 34
Industry mix (Fortune 500 HQ in PA)
| Industry | F500 HQs | Revenue |
|---|---|---|
| Healthcare | 2 | $309B |
|
||
| Insurance | 2 | $27B |
|
||
| Telecommunications / Media | 1 | $124B |
|
||
| Industrial Distribution | 1 | $22B |
|
||
| Financial Services | 1 | $20B |
|
||
| Chemicals / Materials | 1 | $18B |
|
||
Price history
+88.9% since first listed3 events — show timeline
- 2026-05-19 Listed $85,000 GLVRMLS
- 2002-11-24 Listing Removed — GLVRMLS
- 2002-02-27 Listed $45,000 GLVRMLS
Property tax history
+1.3%/yrLatest (2026): $766 · +3.1% YoY. Source: county tax records.
Cash-flow waterfall
monthlySold comps — $/sqft
last 12 mo · ≤1 miLoading sold comps…