4404 Monarch St · Amarillo, TX
Flood risk No data
- FEMA flood zone
- —
- Chance of flooding over 30 yrs
- —
- Est. flood insurance / yr
- —
Fire risk No data
- Est. fire insurance / yr
- —
Heat risk No data
- Hot days now (above threshold)
- —
- Hot days in 30 yrs
- —
Wind risk No data
- Chance of severe wind over 30 yrs
- —
Air-quality risk No data
- Unhealthy air days now
- —
- Unhealthy air days in 30 yrs
- —
Risk factors via First Street. Map © Google.
Why this score? — see what drove the D- grade
The composite is a weighted blend of 9 inputs, each scored 0–100. Each bar is that input's sub-score; the figure is the points it added to the 100-point composite (weight × sub-score).
- Cash flow +11.3/30.0
- ARV discount +7.5/15.0
- Schools +5.0/10.0
- Rent growth +3.9/5.0
- 1% rule +3.3/10.0
- DSCR +3.3/10.0
- Livability +3.3/5.0
- Condition / age +1.0/5.0
- Appreciation +0.0/10.0
$272,500
🖨 Deal sheet (PDF) 📄 Offer letter ✓ Due diligence
Listing remarks MLS
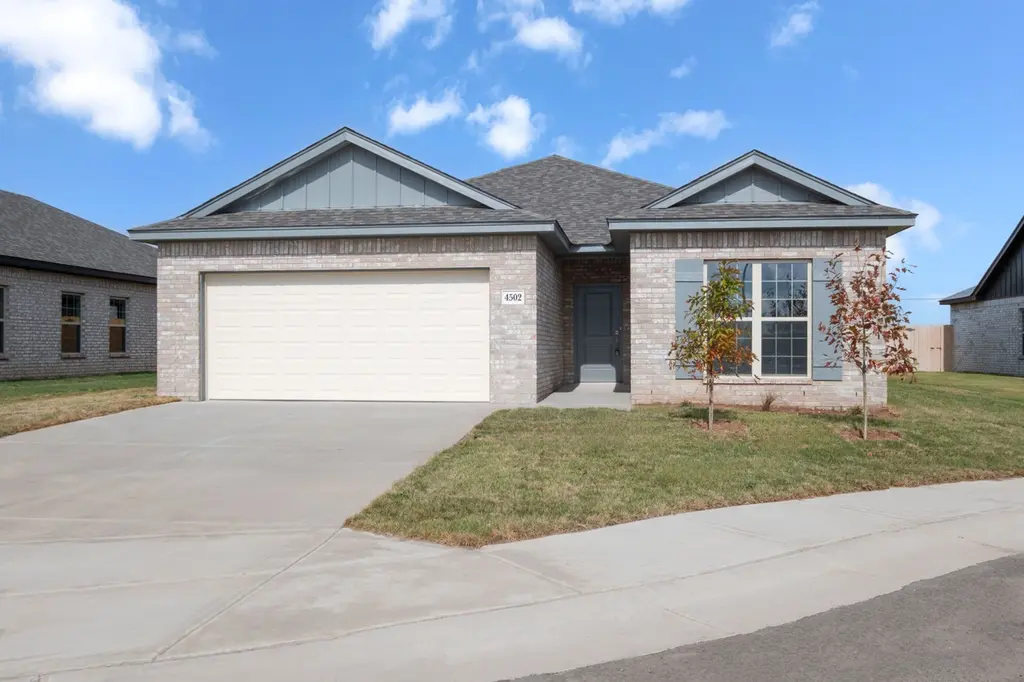
Welcome to the Massachusetts floorplan, a beautifully designed, 3-bedroom new construction home, where spacious living meets everyday comfort. This open-concept floor plan features a generous living and dining area that flows seamlessly into a well-appointed kitchen, complete with granite countertops, custom cabinetry, and bar seating-ideal for entertaining or casual family meals. The isolated primary suite offers a private retreat, featuring a large walk-in closet and a stylish primary bath with dual vanities and a sleek standing shower. Two additional bedrooms provide flexibility for guests, family, or a home office. Step outside to enjoy a large covered back patio that overlooks a spacious backyard-perfect for outdoor dining, relaxing evenings, or weekend gatherings. Built with quality in mind, this home includes spray foam insulation, full sod and irrigation in both front and backyards, granite countertops throughout, and thoughtfully selected finishes that enhance both style and efficiency. The Massachusetts floor plan offers the space you need and the comfort you deserve-all in a place you'll be proud to call home. • $15,000 in Seller-Paid Closing Costs! (When using our preferred lender, Eden Walker with AMC) • Only $1,000 Earnest Money to lock in your home. Note: Photos are for reference. Actual brick, granite, colors, and orientation may vary by homesite.
Key facts
- Custom cabinetry
- Granite countertops
- Bar seating
Tags
Property features AI
Finance
- HOA & community: Homeowners association with $40 annual fee
Exterior
- Parking: Attached 2-car garage with garage door opener
- Utilities: Public water; Public sewer
- Home design: Single family residence; One level; New construction
- Construction: Brick and brick veneer with frame construction; Spray foam insulation; Slab foundation
- Exterior features: Wood fencing; Composition roof; No pool; No additional structures
Interior
- Kitchen: Range; Dishwasher; Microwave; Disposal; Electric water heater
- Bathrooms: 2 full bathrooms
- Heating & cooling: Heat pump heating; Electric heating; Electric cooling
- Interior features: Pantry
Neighborhood map
What this means for you Summary
Snapshot
- This is a 3-bed/2.0-bath single-family listed at $272k. Condition is rated poor.
Deal economics
- At list price, monthly cash flow is $-102 ($-1k/yr) — negative.
- To cash-flow at today's rent, offer at most $258k (5.4% below list).
- To meet the 1% rule (rent ≥ 1% of price), the offer needs to be $226k (17.1% below list).
- Recommended offer: $226k (17.1% below list) — sets the bar for 1% rule.
Location & tenants
- Location reads 66/100 on livability (#624 in TX) — a middle-class / working-renter tenant base. Strengths: cost of living A+, housing A+; Watch: amenities C-, crime F, commute F.
- Canyon ISD (town): math 60% / reading 54% proficiency, ranked #78 of 826 in TX (top 9%) — acceptable for families but not a draw, mixed tenant base, ~2y average lease.
- Zoned schools: Sundown Lane El (math 52% / reading 47%, grade D, #865 of 4,322 statewide, top 21%, 341 students, 52% FRL); Pinnacle Int (math 53% / reading 41%, grade D+, #424 of 1,662 statewide, top 27%, 539 students, 42% FRL); Randall H S (math 43% / reading 64%, grade C-, #428 of 1,632 statewide, top 27%, 1,148 students, 35% FRL).
- Market conditions: Rents rising fast (+5.5%/yr); 278 active listings in the ZIP; 2 comparable units currently listed for rent nearby; solid renter incomes; 45 units permitted in Randall County in 2024 (0 in 5+ unit buildings).
- This rent runs 31% of the median local income ($88k/yr) — at the standard rent-burdened threshold; future hikes will face affordability resistance.
Forward outlook
- Local home prices are declining (-3.0%/yr); year-one equity from $2k of loan paydown is wiped out by about $8k of value loss. Plan a longer hold.
- Randall County population projected at +36% by 2050 — long-run rental-demand tailwind backs the buy-and-hold thesis.
Negotiation context
- Only 3 days on market — expect competitive offers; lowballing is unlikely to land.
- 3 sale attempts with the ask held roughly flat each time — persistent listings suggest the price (not the market) is what's stuck; bring a comps-based counter.
Questions for the listing agent
- What do current leases actually rent for vs. the listed asking? Can we see a recent rent roll and the last 12 months of T-12 income?
- Have any recent inspections been done? Can we get a copy of the seller's disclosures and any deferred-maintenance estimates?
- What does the HOA fee cover, when was the last increase, and are there any pending special assessments or reserve-fund shortfalls?
- Is there a deadline driving the sale (1031 exchange, divorce, estate, relocation)? That informs how much negotiation room exists.
- Schools are D-rated, which usually means shorter tenancies and higher turnover. Who's the typical renter profile here, and what's been the actual vacancy rate?
- Crime grade is F in this area — have there been break-ins, vandalism, or insurance claims at this property in the last 3 years? What carrier currently insures it and at what premium?
- The area grade is low — what's the realistic commute time and amenity access for the typical tenant pool here? Any planned neighborhood developments (good or bad) we should know about?
- What's the average days-on-market for RENTAL listings here right now (not sales)? A rising rental-DOM trend means longer vacancies and softer asking-rent achievability than the comps imply.
- What's the recent tenant-quality profile in this submarket — average credit score on applications, eviction rate, late-payment / NSF rate, and stable-employment percentage? A property-management company in the area should have these aggregated.
- How much new for-sale + rental construction is in the pipeline within 1–3 miles? Heavy new supply typically softens prices + rents 12–24 months out; constrained supply supports both.
Investment metrics
- 1% rule
- 0.83% ✗
- Cap rate
- 5.85%
- Cash-on-cash
- -1.60%
- DSCR
- 0.93
- GRM
- 10.1
CMA / ARV
No comps found within radius.
Projected returns pro-forma
-3.0% appreciation · 5.52% rent growth · sell at horizon
- IRR
- -16.1%
- Equity multiple
- 0.41×
- Total profit
- $-44,721
- Equity at exit
- $40,631
- IRR
- -3.9%
- Equity multiple
- 0.71×
- Total profit
- $-21,758
- Equity at exit
- $23,561
Cash invested: $76,300 (down + closing). Projections, not guarantees.
Landlord ↔ Tenant lean methodology
- Overall (STATE)
- 87 Strongly Landlord-Friendly
- State Texas
- 87 Strongly Landlord-Friendly · R+5
- County
- — inherits STATE
- City
- — inherits STATE
ZIP-level market 79118
- Rents YoY
- 5.5%
- Active inventory
- 278
- Price-to-rent
- 10.1×
Monthly cashflow live
- Estimated rent
- $2,259 medium interval (Pro) →
- Mortgage (P&I)
- −$1,429
- Tax est. 1.5%
- −$341 /mo · $4,088/yr
- Insurance
- −$114
- HOA
- −$3
- Vacancy / Maint / Mgmt
- −$474
- Net cashflow
- $-102
Break-even live
Sensitivity live
| Price | -10% $87 | -5% $-7 | +0% $-102 | +5% $-196 | +10% $-290 |
|---|---|---|---|---|---|
| Rent | -10% $-280 | -5% $-191 | +0% $-102 | +5% $-12 | +10% $77 |
| Rate | -1.0pp $36 | -0.5pp $-32 | base $-102 | +0.5pp $-172 | +1.0pp $-244 |
UW: 25.0% down · 7.5% · 30yr · 1.5% tax · 5.0% vac · 8.0% maint · 8.0% mgmt
Financing live
Cash to close
- Down payment
- $68,125
- Closing costs
- $8,175
- Reserves months
- —
- Total cash needed
- —
Loan-product check · same deal, 3 products live
Conventional
25% down · 7.5% · 30yr
- Down + closing
- —
- Monthly P&I
- —
- Monthly cashflow
- —
- DSCR
- —
- Eligible?
- —
Personal DTI + credit; lowest rate.
DSCR
20% down · 8.5% · 30yr
- Down + closing
- —
- Monthly P&I
- —
- Monthly cashflow
- —
- DSCR
- —
- Eligible?
- —
No personal income docs; deal must DSCR.
Hard money
10% down · 12.0% · 12mo
- Down + closing
- —
- Monthly P&I
- —
- Monthly cashflow
- —
- DSCR
- —
- Eligible?
- —
Short-term bridge; refi at stabilization.
Rent comps 2 comps
| Address | Beds | Baths | Sqft | Rent | $/sqft | DOM | Units | Dist |
|---|---|---|---|---|---|---|---|---|
| 4400 Sunset St Amarillo, TX | 3.0 | 2.0 | 1400 | $2,125 | $1.52 | 45d | 1 | 0.08mi |
| 10602 Stone Meadow Dr Amarillo, TX | 3.0 | 2.0 | 1575 | $2,200 | $1.40 | 45d | 1 | 0.28mi |
HOA detail
- Monthly dues
- $3 · $36/yr
Listing history 20 events
-
2026-06-22days on market $272,500 Active 3 DOM
-
2026-06-18days on market $272,500 Active 1 DOM
-
2026-06-18days on market $272,500 Active 34 DOM
-
2026-06-17days on market $272,500 Active 33 DOM
-
2026-06-16days on market $272,500 Active 32 DOM
-
2026-06-15days on market $272,500 Active 31 DOM
-
2026-06-14days on market $272,500 Active 29 DOM
-
2026-06-13days on market $272,500 Active 28 DOM
-
2026-06-10days on market $272,500 Active 26 DOM
-
2026-06-09days on market $272,500 Active 25 DOM
-
2026-06-08days on market $272,500 Active 24 DOM
-
2026-06-07days on market $272,500 Active 23 DOM
-
2026-06-05days on market $272,500 Active 20 DOM
-
2026-06-03days on market $272,500 Active 28 DOM
-
2026-06-02days on market $272,500 Active 27 DOM
-
2026-06-01days on market $272,500 Active 26 DOM
-
2026-05-31days on market $272,500 Active 25 DOM
-
2026-05-30days on market $272,500 Active 24 DOM
-
2026-05-15$272,500 Active 1401-char remark
Show marketing remark (1395 chars)
Welcome to the Massachusetts floorplan, a beautifully designed, 3-bedroom new construction home, where spacious living meets everyday comfort. This open-concept floor plan features a generous living and dining area that flows seamlessly into a well-appointed kitchen, complete with granite countertops, custom cabinetry, and bar seating-ideal for entertaining or casual family meals. The isolated primary suite offers a private retreat, featuring a large walk-in closet and a stylish primary bath with dual vanities and a sleek standing shower. Two additional bedrooms provide flexibility for guests, family, or a home office. Step outside to enjoy a large covered back patio that overlooks a spacious backyard-perfect for outdoor dining, relaxing evenings, or weekend gatherings. Built with quality in mind, this home includes spray foam insulation, full sod and irrigation in both front and backyards, granite countertops throughout, and thoughtfully selected finishes that enhance both style and efficiency. The Massachusetts floor plan offers the space you need and the comfort you deserve-all in a place you'll be proud to call home. • $15,000 in Seller-Paid Closing Costs! (When using our preferred lender, Eden Walker with AMC) • Only $1,000 Earnest Money to lock in your home. Note: Photos are for reference. Actual brick, granite, colors, and orientation may vary by homesite.
-
2026-05-06$272,500 Active 768-char remark
ⓘ Source: listings_history table (triggers on properties + properties_extension) + one-shot
backfill from property_details.listing_events for pre-trigger history.
Nearby sold comps map
Loading sold comps map…
Walkable amenities ~0.75 mi
Loading nearby amenities…
Taxation est. · year 1
- Rental income
- $27,107
- − Mortgage interest
- −$15,264
- − Property taxes
- −$4,088
- − Insurance
- −$1,362
- − Repairs & maintenance
- −$2,169
- − Management
- −$2,169
- − HOA
- −$36
- − Depreciation
- −$7,927
- Taxable loss
- −$5,907
- Est. tax savings @ 24.0%
- +$1,418
- After-tax cash flow
- $198/yr
For passive investors: Depreciation is non-cash, so a rental often shows a tax loss while cash-flowing — sheltering income. Rental losses are passive: they offset passive income freely, and up to $25,000/yr can offset ordinary (W-2) income if you actively participate and your MAGI is under $100k (phasing out to $0 by $150k); unused losses carry forward. On sale, claimed depreciation is recaptured at up to 25%, and gains may owe capital-gains tax (a 1031 exchange can defer both). Figures are a year-1 estimate at your 24.0% rate — not tax advice; consult a CPA.
Condition & rehab AI · 2 photos
This property requires extensive repairs and updates, including new flooring, siding, and landscaping, to become move-in ready and significantly increase its value.
Repairs flagged
- Major Flooring — Severe wear and staining
- Major Siding — Significant damage and missing shingles
- Major Landscaping — Neglected and overgrown
- Major Fencing — Missing
Value-add opportunities
- Resale New flooring — Fresh flooring enhances curb appeal and interior aesthetics
- Resale New siding and roof — Fresh exterior materials improve curb appeal and structural integrity
- Both Landscaping and fencing — Enhances curb appeal and property value
- Resale Interior updates — Fresh paint and minor updates improve interior aesthetics
Renovation cost estimate screening
| Repair item | Severity | Est. cost |
|---|---|---|
| Flooring · Severe wear and staining | Major | $15,000–50,000 |
| Siding · Significant damage and missing shingles | Major | $15,000–50,000 |
| Landscaping · Neglected and overgrown | Major | $15,000–50,000 |
| Fencing · Missing | Major | $15,000–50,000 |
| Total estimated repair cost · 4 items | $60,000–200,000 |
Value-add ROI direction
- Resale New flooring — Fresh flooring enhances curb appeal and interior aesthetics ↑
- Resale New siding and roof — Fresh exterior materials improve curb appeal and structural integrity ↑
- Both Landscaping and fencing — Enhances curb appeal and property value ↑
- Resale Interior updates — Fresh paint and minor updates improve interior aesthetics ↑
ⓘ Cost ranges are severity-bucket heuristics (US national rule-of-thumb). Get contractor quotes + a written scope before underwriting a rehab budget.
Schools (NCES district)
- District
- Canyon ISD
- NCES district ID
- 4812810
- Math proficiency
- 60% ▼ -1.00%
- Reading proficiency
- 54% ▼ -1.00%
- Median HH income
- $65,177
- Composite
- 50.07/100
- National rank
- #1912
- State rank
- #78 of 826 in TX
Livability — Amarillo
- Score
- 66/100
- State rank
- #624
- US rank
- #11876
Category grades
Schools grade is shown separately in the Schools card above.
Census & demographics
- Census place
- Amarillo, TX
- County
- Randall County · 137,351 people
- City population
- 185,802
- Metro
- Amarillo, TX
- Population (ZIP)
- 28,107
- Household income
- $87,810
- Rent vs Own
- Severe rent burden
- 367.0
Population outlook (Randall County) Hauer SSP2
- Today (2025)
- 152,140 people
- By 2030
- 163,107 · +7.2%
- By 2040
- 184,999 · +21.6%
- By 2050
- 206,948 · +36.0%
- By 2075
- 260,204 · +71.0%
- By 2100
- 294,980 · +93.9%
Race, ethnicity, and origin ACS 2023
- Neighborhood character
- Majority White (57%)
- Race & ethnicity
- White 57% Hispanic / Latino 35% Two or more races 18% Black 2% Asian 2% Native American 1%
- Hispanic origin (detail)
- Mexican 31%
- Common ancestry
- Lithuanian 2% Italian 2% Slovak 2%
- Foreign-born
- 6% · Canada, Vietnam
- Languages at home
- 84% English-only · Spanish 14% Vietnamese 1% French/Haitian/Cajun 1%
Political lean MEDSL · Randall
- 2024 margin
- Solid R (+60.4) · D 19.4% · R 79.8%
- 2008→2024 swing
- +2.3pp toward D · 2008: -62.7pp · 2024: -60.4pp
- All cycles
- 2024: R+60.4 2020: R+58.8 2016: R+65.1 2012: R+68.2 2008: R+62.7
Not yet ingested
- Civics
- —
Market trends
- HPI YoY
- ▼ -111.59%
- Current HPI
- 162.5206
- Rent YoY
- ▲ 5.52%
- Metro
- Amarillo, TX
- State GDP YoY
- ▲ 3.95%
- F500 in state
- 110
Industry mix (Fortune 500 HQ in TX)
| Industry | F500 HQs | Revenue |
|---|---|---|
| Energy | 16 | $1,198B |
|
||
| Technology | 5 | $198B |
|
||
| Engineering / Construction | 4 | $72B |
|
||
| Energy Services | 3 | $60B |
|
||
| Utilities | 3 | $41B |
|
||
| Healthcare | 2 | $330B |
|
||
Price history
+0.0% since first listed3 events — show timeline
- 2026-06-17 Listed $272,500 AARMLS
- 2026-05-15 Listed $272,500 Zillow
- 2026-05-06 Listed $272,500 AARMLS
Cash-flow waterfall
monthlySold comps — $/sqft
last 12 mo · ≤1 miLoading sold comps…