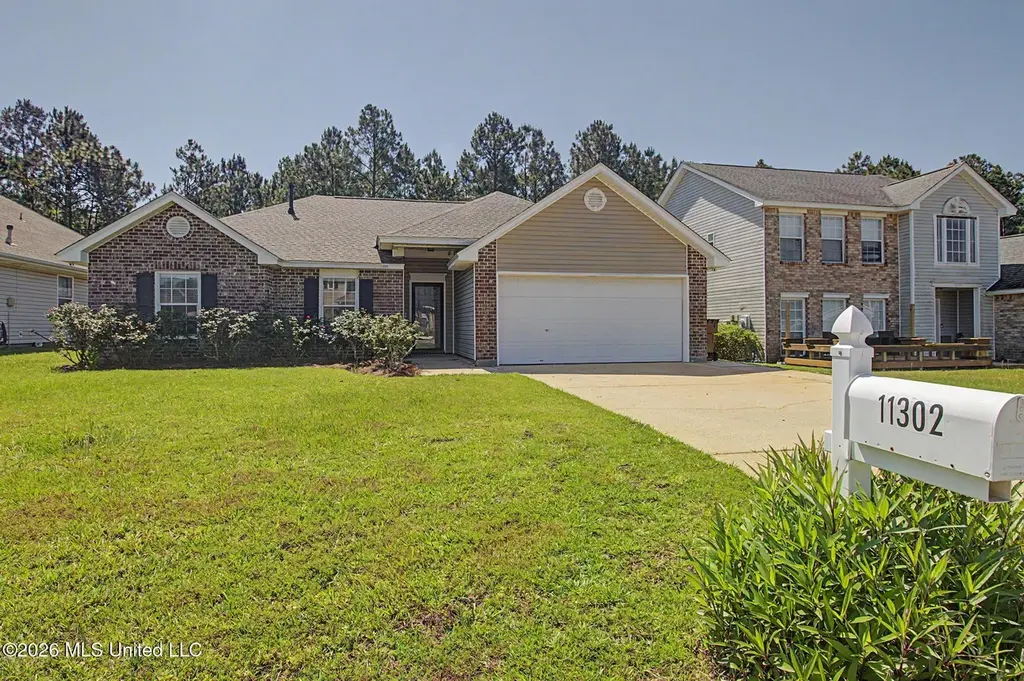
11302 River Bend Dr · Gulfport, MS
Flood risk 1/10 · Minimal
- FEMA flood zone
- X (unshaded)
- Chance of flooding over 30 yrs
- 0.0%
- Est. flood insurance / yr
- $507 – $1,088
Fire risk 5/10 · Moderate
- Est. fire insurance / yr
- $1,241 – $2,305
Heat risk 10/10 · Severe
- Hot days now (above 108°F)
- 7 days/yr
- Hot days in 30 yrs
- 23 days/yr
Wind risk 9/10 · Severe
- Chance of severe wind over 30 yrs
- 99.0%
Air-quality risk 1/10 · Minimal
- Unhealthy air days now
- 0 days/yr
- Unhealthy air days in 30 yrs
- 0 days/yr
Risk factors via First Street. Map © Google.
Why this score? — see what drove the C- grade
The composite is a weighted blend of 9 inputs, each scored 0–100. Each bar is that input's sub-score; the figure is the points it added to the 100-point composite (weight × sub-score).
- Cash flow +17.6/30.0
- ARV discount +10.7/15.0
- DSCR +5.5/10.0
- Rent growth +4.2/5.0
- Schools +4.2/10.0
- 1% rule +3.7/10.0
- Livability +3.7/5.0
- Condition / age +2.5/5.0
- Appreciation +0.0/10.0
$225,000
🖨 Deal sheet 📄 Offer letter ✓ Due diligence
Listing remarks
Welcome to this charming and beautifully maintained 3-bedroom, 2-bath home located just outside the city limits in the county, offering the perfect blend of peaceful living and convenient access to the Seabee Base, shopping, dining, schools, and more. From the moment you arrive, you'll appreciate the attractive curb appeal featuring a lovely front garden accented with blooming rose bushes and a welcoming exterior. Inside, the home offers a desirable split-bedroom floor plan with a spacious primary suite complete with two closets and a large bathroom featuring a relaxing garden tub, separate shower, and plenty of room to unwind. The bright and airy living room showcases vaulted cathedral cei
Key facts
- Blooming rose bushes
- Front garden
- Two closets
Tags
Property features AI
Exterior
- Parking: 2-car garage; Garage door opener; Garage faces front; Concrete driveway
- Utilities: Public water; Public sewer; Cable available; See remarks regarding utilities
- Home design: Single family residence; One-level (lowrise 1–2 floors); Updated/remodeled; Estimated living area about 1,600; City lot
- Construction: Brick veneer construction; Architectural shingle roof; Slab foundation; Year built (source: assessor)
- Exterior features: Back yard fencing; Shed(s); See remarks
Interior
- Kitchen: Dishwasher; Disposal; Free-standing gas range; Microwave
- Flooring: Carpet; Ceramic tile; Vinyl
- Bathrooms: 2 full bathrooms
- Heating & cooling: Central heating; Central air; Ceiling fans
- Interior features: Blinds; Security system
- Laundry & utility: In-unit laundry
Neighborhood map
What this means for you Summary
Snapshot
- This is a 3-bed/1.0-bath single-family listed at $225k.
Deal economics
- At list price, monthly cash flow is $178 ($2k/yr) — positive.
- The deal already cash-flows at list — no discount required.
- To meet the 1% rule (rent ≥ 1% of price), the offer needs to be $195k (13.2% below list).
- Recommended offer: $195k (13.2% below list) — sets the bar for 1% rule.
- Cap rate 7.2% vs local median 4.9% in Gulfport — top-decile yield for the area; either an underpriced asset or a hidden risk that comps aren't pricing in. Stress-test before assuming the spread holds.
Location & tenants
- Location reads 73/100 on livability (#15 in MS) — a middle-class / working-renter tenant base. Strengths: cost of living A+, housing A+, health & safety A+; Watch: schools D, amenities F, commute F.
- Harrison County School District (rural): math 52% / reading 46% proficiency, ranked #14 of 130 in MS (top 11%) — families likely to look elsewhere, expect single-tenant / working-renter base with shorter leases; 62% free/reduced lunch — lower-income household profile, screen leases tightly.
- Market conditions: Rents rising fast (+7.0%/yr); 763 active listings in the ZIP; 11 comparable units currently listed for rent nearby; rentals leasing fast (median 14d on market — plan ~1-2 weeks tenant-placement turnaround); 2,194 units permitted in Harrison County in 2024 (0 in 5+ unit buildings).
- This rent runs 37% of the median local income ($63k/yr) — at the standard rent-burdened threshold; future hikes will face affordability resistance.
Forward outlook
- Local home prices are declining (-3.0%/yr); year-one equity from $2k of loan paydown is wiped out by about $7k of value loss. Plan a longer hold.
- Harrison County population projected at +27% by 2050 — long-run rental-demand tailwind backs the buy-and-hold thesis.
Negotiation context
- It's been on market 34 days — a 3% lower offer ($218k) is reasonable based on typical stale-listing flexibility.
- 2 sale attempts since 20y ago with the ask held roughly flat each time — persistent listings suggest the price (not the market) is what's stuck; bring a comps-based counter.
Risks & watch-outs
- Climate carrying-cost: severe wind risk, 99% chance of damaging wind over 30y; moderate wildfire risk; extreme-heat days projected 7→23/yr by 2055 (HVAC capex compounding) — expect insurance premiums to compound above CPI over the hold.
Questions for the listing agent
- It's been on market 34 days. Have you received any prior offers? Is the seller open to a 13% concession, seller financing, or rate buy-down credit?
- Is there a deadline driving the sale (1031 exchange, divorce, estate, relocation)? That informs how much negotiation room exists.
- Schools are D-rated, which usually means shorter tenancies and higher turnover. Who's the typical renter profile here, and what's been the actual vacancy rate?
- What's the average days-on-market for RENTAL listings here right now (not sales)? A rising rental-DOM trend means longer vacancies and softer asking-rent achievability than the comps imply.
- What's the recent tenant-quality profile in this submarket — average credit score on applications, eviction rate, late-payment / NSF rate, and stable-employment percentage? A property-management company in the area should have these aggregated.
- How much new for-sale + rental construction is in the pipeline within 1–3 miles? Heavy new supply typically softens prices + rents 12–24 months out; constrained supply supports both.
Investment metrics
- 1% rule
- 0.87% ✗
- Cap rate
- 7.24%
- Cash-on-cash
- 3.39%
- DSCR
- 1.15
- GRM
- 9.6
CMA / ARV
- ARV (median comp)
- $242,458
- List price
- $225,000
- Delta
- -7.20%
- Verdict
- FAIR
- Comps
- 20 within 1.0 mi
Show comp detail 12 sales within ~0.75 mi
| Address | Dist | Beds/Ba | Sqft | Sold | Price | $/sf | Match |
|---|---|---|---|---|---|---|---|
| 11282 River Bend Dr | 0.03mi | 3/2.0 | 1,600 (+0%) | 2mo | $229,000 | $143 | 92 |
| 18062 Lake Vista Dr | 0.07mi | 3/2.0 | 1,600 (+0%) | 1mo | $225,000 | $141 | 92 |
| 18017 Green Leaves Dr | 0.13mi | 3/2.0 | 1,624 (+2%) | 7mo | $235,000 | $145 | 82 |
| 18024 Evergreen Dr | 0.20mi | 3/2.0 | 1,495 (-6%) | 6mo | $234,360 | $157 | 71 |
| 11418 Oak Aly | 0.25mi | 3/2.0 | 1,517 (-5%) | 9mo | $243,560 | $161 | 68 |
| 11396 Oak Aly | 0.22mi | 3/2.0 | 1,495 (-6%) | 9mo | $229,990 | $154 | 68 |
| 11416 Oak Aly | 0.25mi | 3/2.0 | 1,495 (-6%) | 8mo | $232,390 | $155 | 67 |
| 18095 Lakeshore Dr | 0.31mi | 3/2.0 | 1,710 (+7%) | 8mo | $270,700 | $158 | 63 |
| 18087 Lakeshore Dr | 0.31mi | 3/2.0 | 1,375 (-14%) | 7mo | $230,315 | $168 | 53 |
| 11574 Azalea Trce | 0.73mi | 3/2.0 | 1,514 (-5%) | 4mo | $230,000 | $152 | 49 |
| 11491 Caroline Ct | 0.56mi | 3/2.0 | 1,394 (-13%) | 1mo | $225,000 | $161 | 48 |
| 10474 New Hope Rd | 0.72mi | 3/2.0 | 1,788 (+12%) | 4mo | $299,000 | $167 | 39 |
Match score weights: distance 35% · size 25% · config 20% · recency 20%. Top-matched comps best support the ARV.
Projected returns pro-forma
-3.0% appreciation · 6.99% rent growth · sell at horizon
- IRR
- -7.1%
- Equity multiple
- 0.73×
- Total profit
- $-17,056
- Equity at exit
- $33,548
- IRR
- 6.5%
- Equity multiple
- 1.57×
- Total profit
- $35,725
- Equity at exit
- $19,454
Cash invested: $63,000 (down + closing). Projections, not guarantees.
Landlord ↔ Tenant lean methodology
- Overall (STATE)
- 90 Strongly Landlord-Friendly
- State Mississippi
- 90 Strongly Landlord-Friendly · R+11
- County
- — inherits STATE
- City
- — inherits STATE
ZIP-level market 39503
- Home prices YoY
- -21.5%
- Rents YoY
- 7.0%
- Active inventory
- 763
- Price-to-rent
- 9.6×
Monthly cashflow live
- Estimated rent
- $1,953 high interval (Pro) →
- Mortgage (P&I)
- −$1,180
- Tax from tax record
- −$91 /mo · $1,095/yr
- Insurance
- −$94
- HOA
- −$0
- Vacancy / Maint / Mgmt
- −$410
- Net cashflow
- $178
Break-even live
UW: 25.0% down · 7.5% · 30yr · 1.5% tax · 5.0% vac · 8.0% maint · 8.0% mgmt
Financing live
Cash to close
- Down payment
- $56,250
- Closing costs
- $6,750
- Reserves months
- —
- Total cash needed
- —
Loan-product check · same deal, 3 products live
Conventional
25% down · 7.5% · 30yr
- Down + closing
- —
- Monthly P&I
- —
- Monthly cashflow
- —
- DSCR
- —
- Eligible?
- —
Personal DTI + credit; lowest rate.
DSCR
20% down · 8.5% · 30yr
- Down + closing
- —
- Monthly P&I
- —
- Monthly cashflow
- —
- DSCR
- —
- Eligible?
- —
No personal income docs; deal must DSCR.
Hard money
10% down · 12.0% · 12mo
- Down + closing
- —
- Monthly P&I
- —
- Monthly cashflow
- —
- DSCR
- —
- Eligible?
- —
Short-term bridge; refi at stabilization.
Rent comps 11 comps
| Address | Beds | Baths | Sqft | Rent | $/sqft | DOM | Units | Dist |
|---|---|---|---|---|---|---|---|---|
| 18052 Green Leaves Dr Gulfport, MS | 3.0 | 2.0 | 1485 | $1,800 | $1.21 | 21d | 1 | 0.13mi |
| 11415 Oak Alley Dr Gulfport, MS | 3.0 | 2.0 | 1495 | $1,975 | $1.32 | 13d | 1 | 0.27mi |
| 11571 Caroline Ct Gulfport, MS | 3.0 | 2.0 | 1950 | $2,000 | $1.03 | 43d | 1 | 0.66mi |
| 11604 Caroline Ct Gulfport, MS | 3.0 | 2.0 | 1660 | $1,850 | $1.11 | 44d | 1 | 0.69mi |
| 10388 Sweet Bay Dr Gulfport, MS | 3.0 | 2.0 | 1463 | $1,800 | $1.23 | 13d | 1 | 1.10mi |
| 10667 Wren Grv Gulfport, MS | 4.0 | 3.0 | 2076 | $2,850 | $1.37 | 43d | 1 | 1.20mi |
| 17986 Restoration Cir Gulfport, MS | 3.0 | 2.5 | 1730 | $2,100 | $1.21 | 13d | 1 | 1.20mi |
| 10536 Sweet Bay Dr Gulfport, MS | 4.0 | 2.0 | 1961 | $2,349 | $1.20 | 13d | 1 | 1.30mi |
| 18186 Southern Magnolia Cv Gulfport, MS | 4.0 | 2.0 | 2054 | $2,300 | $1.12 | 13d | 1 | 1.32mi |
| 18137 Canal Junction Dr Gulfport, MS | 3.0 | 2.0 | 1413 | $1,750 | $1.24 | 43d | 1 | 1.32mi |
| 11601 Oaklane Dr Gulfport, MS | 3.0 | 2.0 | 1568 | $1,525 | $0.97 | 13d | 1 | 1.49mi |
Listing history 17 events
-
2026-06-18days on market $225,000 Active 34 DOM
-
2026-06-17days on market $225,000 Active 33 DOM
-
2026-06-16days on market $225,000 Active 32 DOM
-
2026-06-15days on market $225,000 Active 31 DOM
-
2026-06-14days on market $225,000 Active 29 DOM
-
2026-06-13days on market $225,000 Active 28 DOM
-
2026-06-10pricedays on market $225,000 Active 26 DOM
-
2026-06-09days on market $227,500 Active 25 DOM
-
2026-06-08days on market $227,500 Active 24 DOM
-
2026-06-07days on market $227,500 Active 23 DOM
-
2026-06-02days on market $227,500 Active 18 DOM
-
2026-06-01days on market $227,500 Active 17 DOM
-
2026-05-31days on market $227,500 Active 16 DOM
-
2026-05-30days on market $227,500 Active 15 DOM
-
2026-05-15$227,500 Active 1503-char remark
-
2006-07-26soldstatus
-
2006-06-27$152,800
ⓘ Source: listings_history table (triggers on properties + properties_extension) + one-shot
backfill from property_details.listing_events for pre-trigger history.
Tax reassessment forecast MS · Resets to sale price
- Current annual tax
- $1,095 · $91/mo
- Projected year-2 tax
- $1,778 · $148/mo
- Expected delta
- +$682/yr (+$57/mo · 62.3%)
ⓘ Screening estimate from a state-policy table — verify with the county assessor before closing.
Climate risk First Street
- Flood 1/10 Low FEMA zone X (unshaded) · 0% chance over 30 yrs
- Wildfire 5/10 Major
- Heat 10/10 Extreme 7 d/yr ≥108°F today · 23 d/yr by 30 yrs out
- Wind 9/10 Extreme 99% chance of damaging wind over 30 yrs
- Air quality 1/10 Low 0 unhealthy d/yr today · 0 by 30 yrs out
Nearby sold comps map
Loading sold comps map…
Walkable amenities ~0.75 mi
Loading nearby amenities…
Taxation est. · year 1
- Rental income
- $23,437
- − Mortgage interest
- −$12,603
- − Property taxes
- −$1,095
- − Insurance
- −$1,125
- − Repairs & maintenance
- −$1,875
- − Management
- −$1,875
- − Depreciation
- −$6,545
- Taxable loss
- −$1,682
- Est. tax savings @ 24.0%
- +$404
- After-tax cash flow
- $2,540/yr
For passive investors: Depreciation is non-cash, so a rental often shows a tax loss while cash-flowing — sheltering income. Rental losses are passive: they offset passive income freely, and up to $25,000/yr can offset ordinary (W-2) income if you actively participate and your MAGI is under $100k (phasing out to $0 by $150k); unused losses carry forward. On sale, claimed depreciation is recaptured at up to 25%, and gains may owe capital-gains tax (a 1031 exchange can defer both). Figures are a year-1 estimate at your 24.0% rate — not tax advice; consult a CPA.
Schools (NCES district)
- District
- Harrison County School District
- NCES district ID
- 2801770
- Math proficiency
- 52% ▼ -4.00%
- Reading proficiency
- 46% ▼ -4.00%
- Median HH income
- $46,504
- Composite
- 41.66/100
- National rank
- #3419
- State rank
- #14 of 130 in MS
Livability — Gulfport
- Score
- 73/100
- State rank
- #15
- US rank
- #5010
Category grades
Schools grade is shown separately in the Schools card above.
Census & demographics
- County
- Harrison County · 178,171 people
- City population
- 96,188
- Metro
- Gulfport-Biloxi, MS
- Population (ZIP)
- 55,059
- Household income
- $62,641
- Rent vs Own
- Severe rent burden
- 1686.0
Population outlook (Harrison County) Hauer SSP2
- Today (2025)
- 228,444 people
- By 2030
- 241,942 · +5.9%
- By 2040
- 267,531 · +17.1%
- By 2050
- 291,062 · +27.4%
- By 2075
- 346,711 · +51.8%
- By 2100
- 378,165 · +65.5%
Race, ethnicity, and origin ACS 2023
- Neighborhood character
- Diverse neighborhood (Simpson 0.58)
- Race & ethnicity
- White 58% Black 27% Two or more races 9% Hispanic / Latino 6% Asian 2%
- Hispanic origin (detail)
- Mexican 2% Puerto Rican 1%
- Common ancestry
- Lithuanian 5% Slovak 1% Portuguese 1%
- Foreign-born
- 3% · Canada
- Languages at home
- 95% English-only · Spanish 3%
Political lean MEDSL · Harrison
- 2024 margin
- Strong R (+28.9) · D 35.0% · R 63.9% · Other 1.1%
- 2008→2024 swing
- -2.9pp toward R · 2008: -26.0pp · 2024: -28.9pp
- All cycles
- 2024: R+28.9 2020: R+25.2 2016: R+30.7 2012: R+26.6 2008: R+26.0
Not yet ingested
- Civics
- —
Market trends
- HPI YoY
- ▼ -51.39%
- Current HPI
- 187.285
- Rent YoY
- ▲ 6.99%
- Metro
- Gulfport-Biloxi, MS
- State GDP YoY
- —
- F500 in state
- 0
Price history
+47.3% since first listed4 events — show timeline
- 2026-06-09 Price Changed $225,000 MLSU
- 2026-05-15 Listed $227,500 MLSU
- 2006-07-26 Sold (MLS) — MLSU
- 2006-06-27 Listed $152,800 MLSU
Property tax history
+1.5%/yrLatest (2025): $1,095 · +15.2% YoY. Source: county tax records.
Cash-flow waterfall
monthlySold comps — $/sqft
last 12 mo · ≤1 miLoading sold comps…