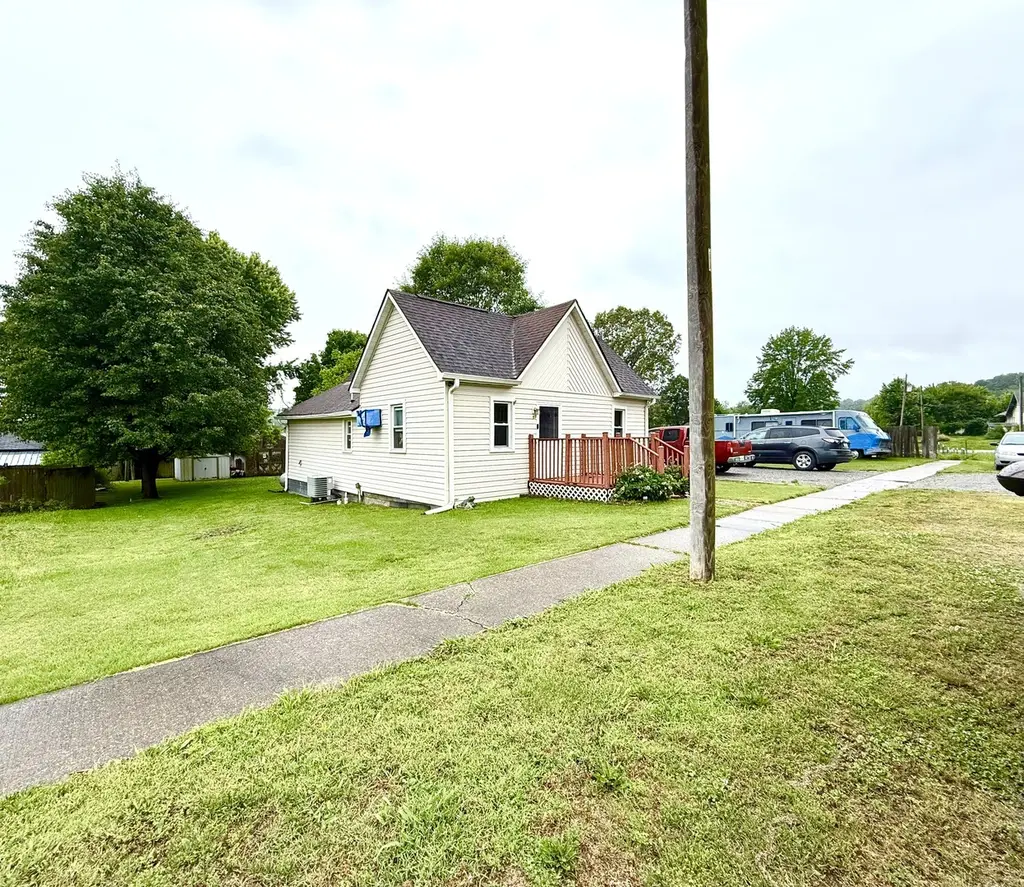
55 Ellen St · Cypress, IL
Flood risk 1/10 · Minimal
- FEMA flood zone
- —
- Chance of flooding over 30 yrs
- 0.0%
- Est. flood insurance / yr
- —
Fire risk 3/10 · Minor
- Est. fire insurance / yr
- $804 – $1,492
Heat risk 6/10 · Moderate
- Hot days now (above 107°F)
- 7 days/yr
- Hot days in 30 yrs
- 22 days/yr
Wind risk 3/10 · Minor
- Chance of severe wind over 30 yrs
- 4.0%
Air-quality risk 1/10 · Minimal
- Unhealthy air days now
- 0 days/yr
- Unhealthy air days in 30 yrs
- 0 days/yr
Risk factors via First Street. Map © Google.
Why this score? — see what drove the B grade
The composite is a weighted blend of 9 inputs, each scored 0–100. Each bar is that input's sub-score; the figure is the points it added to the 100-point composite (weight × sub-score).
- Cash flow +30.0/30.0
- 1% rule +10.0/10.0
- DSCR +10.0/10.0
- ARV discount +7.5/15.0
- Appreciation +5.0/10.0
- Livability +2.6/5.0
- Rent growth +2.5/5.0
- Schools +2.4/10.0
- Condition / age +2.2/5.0
$55,000
🖨 Deal sheet (PDF) 📄 Offer letter ✓ Due diligence
Listing remarks
Why rent when you can own? This charming 2-bedroom, 1-bath home offers an affordable opportunity to make homeownership a reality! Situated on a generously sized lot, this property features a screened-in back porch perfect for relaxing and a convenient storage shed for extra space. This home is worth a look. Schedule your showing today!
Key facts
- Generously sized lot
- Storage shed
- 0.33 acre lot
Tags
Neighborhood map
What this means for you Summary
Snapshot
- This is a 2-bed/1.0-bath single-family listed at $55k. Condition is rated fair.
Deal economics
- At list price, monthly cash flow is $318 ($4k/yr) — positive.
- The deal already cash-flows at list — no discount required.
- Meets the 1% rule at list price ($883 rent vs $55k).
- Recommended offer: $53k (3.0% below list) — sets the bar for market timing.
Location & tenants
- Location reads 52/100 on livability (#1,305 in IL) — a working-class tenant base; expect higher turnover. Strengths: cost of living A+, housing B+; Watch: crime F, amenities F, commute F.
- Vienna Hsd 133 (rural): math 15% / reading 35% proficiency, ranked #630 of 919 in IL (top 69%) — low school quality limits family demand, transient renter base, plan for 1-2y turnover.
- Zoned schools: Cypress Elem School (math 22% / reading 17%, grade F, #1,054 of 2,056 statewide, top 54%, 105 students, 0% FRL); Vienna High School (math 12% / reading 27%, grade F, #397 of 693 statewide, top 61%, 322 students, 0% FRL).
- Market conditions: 2 active listings in the ZIP.
Forward outlook
- In year one you build about $2k of equity ($380 loan paydown + $2k appreciation (3.0% local appreciation)).
- Johnson County population projected at +4% by 2050 — modest demand growth; plan on rents tracking national, not racing it.
- At projected returns (3.0% appreciation + 3.0% rent growth), your $15k cash investment doubles in ~3 years — after that, you're playing with house money.
Negotiation context
- It's been on market 31 days — a 3% lower offer ($53k) is reasonable based on typical stale-listing flexibility.
Risks & watch-outs
- Climate carrying-cost: extreme-heat days projected 7→22/yr by 2055 (HVAC capex compounding) — expect insurance premiums to compound above CPI over the hold.
Questions for the listing agent
- It's been on market 31 days. Have you received any prior offers? Is the seller open to a 3% concession, seller financing, or rate buy-down credit?
- Have any recent inspections been done? Can we get a copy of the seller's disclosures and any deferred-maintenance estimates?
- Is there a deadline driving the sale (1031 exchange, divorce, estate, relocation)? That informs how much negotiation room exists.
- Schools are F-rated, which usually means shorter tenancies and higher turnover. Who's the typical renter profile here, and what's been the actual vacancy rate?
- Crime grade is F in this area — have there been break-ins, vandalism, or insurance claims at this property in the last 3 years? What carrier currently insures it and at what premium?
- What's the average days-on-market for RENTAL listings here right now (not sales)? A rising rental-DOM trend means longer vacancies and softer asking-rent achievability than the comps imply.
- What's the recent tenant-quality profile in this submarket — average credit score on applications, eviction rate, late-payment / NSF rate, and stable-employment percentage? A property-management company in the area should have these aggregated.
- How much new for-sale + rental construction is in the pipeline within 1–3 miles? Heavy new supply typically softens prices + rents 12–24 months out; constrained supply supports both.
Investment metrics
- 1% rule
- 1.61% ✓
- Cap rate
- 13.22%
- Cash-on-cash
- 24.75%
- DSCR
- 2.10
- GRM
- 5.2
CMA / ARV
No comps found within radius.
Projected returns pro-forma
3.0% appreciation · 3.0% rent growth · sell at horizon
- IRR
- 30.8%
- Equity multiple
- 2.74×
- Total profit
- $26,869
- Equity at exit
- $24,730
- IRR
- 31.2%
- Equity multiple
- 5.37×
- Total profit
- $67,326
- Equity at exit
- $38,112
Cash invested: $15,400 (down + closing). Projections, not guarantees.
Landlord ↔ Tenant lean methodology
- Overall (STATE)
- 43 Moderately Tenant-Leaning
- State Illinois
- 43 Moderately Tenant-Leaning · D+7
- County
- — inherits STATE
- City
- — inherits STATE
ZIP-level market 62923
- Active inventory
- 2
- Price-to-rent
- 5.2×
Monthly cashflow live
- Estimated rent
- $883 medium interval (Pro) →
- Mortgage (P&I)
- −$288
- Tax est. 1.5%
- −$69 /mo · $825/yr
- Insurance
- −$23
- HOA
- −$0
- Vacancy / Maint / Mgmt
- −$185
- Net cashflow
- $318
Break-even live
Sensitivity live
| Price | -10% $356 | -5% $337 | +0% $318 | +5% $299 | +10% $280 |
|---|---|---|---|---|---|
| Rent | -10% $248 | -5% $283 | +0% $318 | +5% $353 | +10% $387 |
| Rate | -1.0pp $345 | -0.5pp $332 | base $318 | +0.5pp $303 | +1.0pp $289 |
UW: 25.0% down · 7.5% · 30yr · 1.5% tax · 5.0% vac · 8.0% maint · 8.0% mgmt
Financing live
Cash to close
- Down payment
- $13,750
- Closing costs
- $1,650
- Reserves months
- —
- Total cash needed
- —
Loan-product check · same deal, 3 products live
Conventional
25% down · 7.5% · 30yr
- Down + closing
- —
- Monthly P&I
- —
- Monthly cashflow
- —
- DSCR
- —
- Eligible?
- —
Personal DTI + credit; lowest rate.
DSCR
20% down · 8.5% · 30yr
- Down + closing
- —
- Monthly P&I
- —
- Monthly cashflow
- —
- DSCR
- —
- Eligible?
- —
No personal income docs; deal must DSCR.
Hard money
10% down · 12.0% · 12mo
- Down + closing
- —
- Monthly P&I
- —
- Monthly cashflow
- —
- DSCR
- —
- Eligible?
- —
Short-term bridge; refi at stabilization.
Listing history 17 events
-
2026-06-21days on market $55,000 Active 31 DOM
-
2026-06-21days on market $55,000 Active 30 DOM
-
2026-06-18days on market $55,000 Active 28 DOM
-
2026-06-17days on market $55,000 Active 27 DOM
-
2026-06-16days on market $55,000 Active 26 DOM
-
2026-06-15days on market $55,000 Active 25 DOM
-
2026-06-13days on market $55,000 Active 23 DOM
-
2026-06-12days on market $55,000 Active 22 DOM
-
2026-06-09days on market $55,000 Active 19 DOM
-
2026-06-08days on market $55,000 Active 18 DOM
-
2026-06-07days on market $55,000 Active 17 DOM
-
2026-06-04days on market $55,000 Active 13 DOM
-
2026-06-02days on market $55,000 Active 12 DOM
-
2026-06-01days on market $55,000 Active 11 DOM
-
2026-05-31days on market $55,000 Active 10 DOM
-
2026-05-31days on market $55,000 Active 9 DOM
-
2026-05-21$55,000 Active
ⓘ Source: listings_history table (triggers on properties + properties_extension) + one-shot
backfill from property_details.listing_events for pre-trigger history.
Climate risk First Street
- Flood 1/10 Low 0% chance over 30 yrs
- Wildfire 3/10 Moderate
- Heat 6/10 Major 7 d/yr ≥107°F today · 22 d/yr by 30 yrs out
- Wind 3/10 Moderate 4% chance of damaging wind over 30 yrs
- Air quality 1/10 Low 0 unhealthy d/yr today · 0 by 30 yrs out
Nearby sold comps map
Loading sold comps map…
Walkable amenities ~0.75 mi
Loading nearby amenities…
Taxation est. · year 1
- Rental income
- $10,598
- − Mortgage interest
- −$3,081
- − Property taxes
- −$825
- − Insurance
- −$275
- − Repairs & maintenance
- −$848
- − Management
- −$848
- − Depreciation
- −$1,600
- Taxable income
- $3,122
- Est. tax owed @ 24.0%
- −$749
- After-tax cash flow
- $3,062/yr
For passive investors: Depreciation is non-cash, so a rental often shows a tax loss while cash-flowing — sheltering income. Rental losses are passive: they offset passive income freely, and up to $25,000/yr can offset ordinary (W-2) income if you actively participate and your MAGI is under $100k (phasing out to $0 by $150k); unused losses carry forward. On sale, claimed depreciation is recaptured at up to 25%, and gains may owe capital-gains tax (a 1031 exchange can defer both). Figures are a year-1 estimate at your 24.0% rate — not tax advice; consult a CPA.
Condition & rehab AI · 13 photos
This home requires moderate repairs and updates to improve its condition and value. Fresh paint, new flooring, and updated appliances would significantly enhance its appeal.
Repairs flagged
- Moderate Siding — Weathered and needs repainting
- Moderate Paint — Worn paint on interior walls
- Minor Kitchen appliances — Dated appliances
Value-add opportunities
- Both Paint interior walls — Fresh paint enhances curb appeal and interior aesthetics
- Both Replace carpeted floors — Hardwood or tile flooring would increase both resale and rental value
- Both Update kitchen appliances — Modern appliances would attract more buyers/renters
Renovation cost estimate screening
| Repair item | Severity | Est. cost |
|---|---|---|
| Siding · Weathered and needs repainting | Moderate | $3,000–15,000 |
| Paint · Worn paint on interior walls | Moderate | $3,000–15,000 |
| Kitchen appliances · Dated appliances | Minor | $500–3,000 |
| Total estimated repair cost · 3 items | $6,500–33,000 |
Value-add ROI direction
- Both Paint interior walls — Fresh paint enhances curb appeal and interior aesthetics ↑
- Both Replace carpeted floors — Hardwood or tile flooring would increase both resale and rental value ↑
- Both Update kitchen appliances — Modern appliances would attract more buyers/renters ↑
ⓘ Cost ranges are severity-bucket heuristics (US national rule-of-thumb). Get contractor quotes + a written scope before underwriting a rehab budget.
Schools (NCES district)
- District
- Vienna Hsd 133
- NCES district ID
- 1740290
- Math proficiency
- 15% ▲ 5.00%
- Reading proficiency
- 35% ▬ 0.00%
- Median HH income
- $40,197
- Composite
- 24.12/100
- National rank
- #13157
- State rank
- #630 of 919 in IL
Livability — Cypress
- Score
- 52/100
- State rank
- #1305
- US rank
- #24765
Category grades
Schools grade is shown separately in the Schools card above.
Census & demographics
- Census place
- Cypress, IL
- Population (ZIP)
- 393
Population outlook (Johnson County) Hauer SSP2
- Today (2025)
- 13,355 people
- By 2030
- 13,579 · +1.7%
- By 2040
- 13,849 · +3.7%
- By 2050
- 13,880 · +3.9%
- By 2075
- 13,759 · +3.0%
- By 2100
- 11,536 · -13.6%
Race, ethnicity, and origin ACS 2023
- Neighborhood character
- Predominantly White (97%)
- Race & ethnicity
- White 97% Two or more races 3%
- Common ancestry
- Lithuanian 3% German 1%
- Languages at home
- 99% English-only · Spanish 1%
Political lean MEDSL · Johnson
- 2024 margin
- Solid R (+58.3) · D 20.3% · R 78.6% · Other 1.1%
- 2008→2024 swing
- -23.7pp toward R · 2008: -34.6pp · 2024: -58.3pp
- All cycles
- 2024: R+58.3 2020: R+58.6 2016: R+58.3 2012: R+42.1 2008: R+34.6
Not yet ingested
- Civics
- —
Market trends
- HPI YoY
- —
- Current HPI
- —
- Rent YoY
- —
- Metro
- —
- State GDP YoY
- ▲ 1.59%
- F500 in state
- 60
Industry mix (Fortune 500 HQ in IL)
| Industry | F500 HQs | Revenue |
|---|---|---|
| Insurance | 4 | $201B |
|
||
| Consumer Goods | 4 | $87B |
|
||
| Industrial Machinery | 3 | $64B |
|
||
| Healthcare | 2 | $55B |
|
||
| Retail / Pharmacy | 1 | $148B |
|
||
| Agriculture / Food | 1 | $86B |
|
||
Price history
1 event — show timeline
- 2026-05-21 Listed $55,000 MRED as Distributed by MLS Grid
Cash-flow waterfall
monthlySold comps — $/sqft
last 12 mo · ≤1 miLoading sold comps…