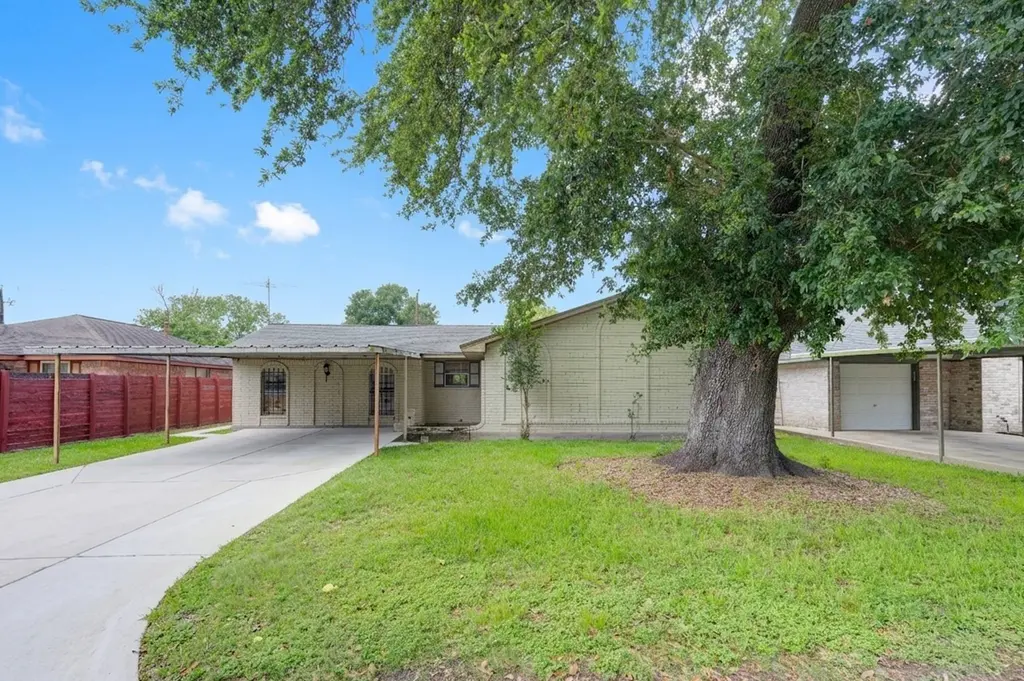
526 Hidden Valley Dr · Houston, TX
Flood risk 8/10 · Major
- FEMA flood zone
- AE
- Chance of flooding over 30 yrs
- 0.99%
- Est. flood insurance / yr
- $1,737 – $8,500
Fire risk 1/10 · Minimal
- Est. fire insurance / yr
- $1,222 – $2,270
Heat risk 9/10 · Severe
- Hot days now (above 109°F)
- 7 days/yr
- Hot days in 30 yrs
- 24 days/yr
Wind risk 9/10 · Severe
- Chance of severe wind over 30 yrs
- 99.0%
Air-quality risk 3/10 · Minor
- Unhealthy air days now
- 3 days/yr
- Unhealthy air days in 30 yrs
- 4 days/yr
Risk factors via First Street. Map © Google.
Why this score? — see what drove the C+ grade
The composite is a weighted blend of 9 inputs, each scored 0–100. Each bar is that input's sub-score; the figure is the points it added to the 100-point composite (weight × sub-score).
- Cash flow +22.3/30.0
- ARV discount +15.0/15.0
- DSCR +7.2/10.0
- 1% rule +6.7/10.0
- Livability +3.7/5.0
- Rent growth +2.5/5.0
- Condition / age +2.5/5.0
- Schools +1.5/10.0
- Appreciation +0.0/10.0
$159,000
🖨 Deal sheet (PDF) 📄 Offer letter ✓ Due diligence
Listing remarks
Welcome to 526 Hidden Valley Drive, a 3-bedroom, 1.5-bath home with a pool offering a great opportunity for investors, flippers, landlords, or buyers looking to renovate and add their own touch. This property has already been cleaned out and is ready for its next phase. Property is being sold as-is. Serious buyers only — schedule a showing and submit your best offer!
Key facts
- 6,821 sq ft lot
- 2 parking spots
- Pool
Property features AI
Finance
- Financial info: Lease not considered
Exterior
- Parking: Attached carport; 2-space carport
- Utilities: Public water; Public sewer
- Home design: Residential property; Built in 1965; Slab foundation
- Construction: Brick construction; Composition roof
- Exterior features: Private in-ground pool; Subdivision lot
Interior
- Bedrooms: Primary bedroom on the first floor (approx. 11 x 14); Bedroom on the first floor (approx. 11 x 14); Bedroom on the first floor (approx. 10 x 12)
- Bathrooms: 1 full bathroom; 1 half bathroom
- Heating & cooling: Central heating (gas); Central electric air conditioning
- Interior features: 3 total rooms
Neighborhood map
What this means for you Summary
Snapshot
- This is a 3-bed/1.5-bath single-family listed at $159k.
Deal economics
- At list price, monthly cash flow is $-163 ($-2k/yr) — negative.
- To cash-flow at today's rent, offer at most $130k (18.2% below list).
- Meets the 1% rule at list price ($2k rent vs $159k).
- Recommended offer: $130k (18.2% below list) — sets the bar for cash-flow.
- Cap rate 8.3% vs local median 3.2% in Houston — top-decile yield for the area; either an underpriced asset or a hidden risk that comps aren't pricing in. Stress-test before assuming the spread holds.
Location & tenants
- Location reads 74/100 on livability (#184 in TX, #4,771 nationally) — a middle-class / working-renter tenant base. Strengths: amenities A+, cost of living A+, housing A+; Watch: crime F.
- Aldine ISD (suburban): math 16% / reading 21% proficiency, ranked #790 of 826 in TX (top 96%) — low school quality limits family demand, transient renter base, plan for 1-2y turnover; 79% free/reduced lunch — lower-income household profile, screen leases tightly.
- Zoned schools: Carter Academy (math 11% / reading 26%, grade F, #3,759 of 4,322 statewide, top 88%, 714 students, 91% FRL); Grantham Academy (math 17% / reading 23%, grade F, #1,428 of 1,662 statewide, top 87%, 1,162 students, 94% FRL); Aldine H S (math 15% / reading 20%, grade F, #1,451 of 1,632 statewide, top 89%, 2,663 students, 94% FRL).
- Market conditions: 40 active listings in the ZIP; 21 comparable units currently listed for rent nearby; rentals at typical pace (median 26d on market — plan ~3-4 weeks tenant-placement turnaround); 43% of comp listings sitting > 30 days — soft ceiling on asking rent; 29,883 units permitted in Harris County in 2024 (8,621 in 5+ unit buildings).
Forward outlook
- Local home prices are declining (-3.0%/yr); year-one equity from $1k of loan paydown is wiped out by about $5k of value loss. Plan a longer hold.
- Harris County population projected at +47% by 2050 — long-run rental-demand tailwind backs the buy-and-hold thesis.
Negotiation context
- Only 12 days on market — expect competitive offers; lowballing is unlikely to land.
- 3 sale attempts since 2y ago with the ask held roughly flat each time — persistent listings suggest the price (not the market) is what's stuck; bring a comps-based counter.
Risks & watch-outs
- Watch-outs: flood insurance adds $427/mo.
- Climate carrying-cost: in FEMA flood zone AE (mandatory federal flood insurance); severe wind risk, 99% chance of damaging wind over 30y; extreme-heat days projected 7→24/yr by 2055 (HVAC capex compounding) — expect insurance premiums to compound above CPI over the hold.
Questions for the listing agent
- What do current leases actually rent for vs. the listed asking? Can we see a recent rent roll and the last 12 months of T-12 income?
- Built in 1965 — when were the roof, HVAC, electrical panel, plumbing, and water heater last replaced?
- What's the actual annual flood-insurance premium (NFIP or private), and is the property in a SFHA with mandatory coverage?
- Is there a deadline driving the sale (1031 exchange, divorce, estate, relocation)? That informs how much negotiation room exists.
- Schools are D-rated, which usually means shorter tenancies and higher turnover. Who's the typical renter profile here, and what's been the actual vacancy rate?
- Crime grade is F in this area — have there been break-ins, vandalism, or insurance claims at this property in the last 3 years? What carrier currently insures it and at what premium?
- What's the average days-on-market for RENTAL listings here right now (not sales)? A rising rental-DOM trend means longer vacancies and softer asking-rent achievability than the comps imply.
- What's the recent tenant-quality profile in this submarket — average credit score on applications, eviction rate, late-payment / NSF rate, and stable-employment percentage? A property-management company in the area should have these aggregated.
- How much new for-sale + rental construction is in the pipeline within 1–3 miles? Heavy new supply typically softens prices + rents 12–24 months out; constrained supply supports both.
Investment metrics
- 1% rule
- 1.17% ✓
- Cap rate
- 8.28%
- Cash-on-cash
- 7.09%
- DSCR
- 1.32
- GRM
- 7.1
CMA / ARV
- ARV (median comp)
- $193,270
- List price
- $159,000
- Delta
- -17.73%
- Verdict
- UNDERPRICED
- Comps
- 20 within 1.0 mi
Show comp detail 12 sales within ~0.75 mi
| Address | Dist | Beds/Ba | Sqft | Sold | Price | $/sf | Match |
|---|---|---|---|---|---|---|---|
| 526 Hidden Valley Dr | 0.00mi | 3/1.5 | 1,436 (0%) | 1mo | $159,000 | $111 | 99 |
| 619 Rainy River Dr | 0.22mi | 3/2.0 | 1,374 (-4%) | 2mo | $200,000 | $146 | 79 |
| 634 Twinbrooke Dr | 0.25mi | 3/2.0 | 1,288 (-10%) | 2mo | $200,000 | $155 | 68 |
| 8706 Meadowview Dr | 0.66mi | 3/2.0 | 1,452 (+1%) | 4mo | $249,999 | $172 | 62 |
| 130 Airway Dr | 0.75mi | 3/2.0 | 1,428 (-1%) | 1mo | $239,000 | $167 | 62 |
| 9202 Sunnywood Dr | 0.47mi | 3/2.0 | 1,608 (+12%) | 1mo | $180,000 | $112 | 56 |
| 903 Peach Spring Dr | 0.63mi | 3/1.5 | 1,311 (-9%) | 1mo | $200,000 | $153 | 55 |
| 9006 Winding River Dr | 0.68mi | 4/2.0 (+1) | 1,515 (+6%) | 5mo | $269,900 | $178 | 48 |
| 9002 Bunny Run Dr | 0.74mi | 3/2.0 | 1,544 (+8%) | 4mo | $170,000 | $110 | 47 |
| 910 Beaver Bend Rd | 0.61mi | 3/2.0 | 1,650 (+15%) | 2mo | $265,000 | $161 | 43 |
| 815 Frazer Ln | 0.66mi | 4/2.0 (+1) | 1,550 (+8%) | 8mo | $199,900 | $129 | 42 |
| 9022 Lazy River Ln | 0.62mi | 4/2.0 (+1) | 1,648 (+15%) | 2mo | $255,000 | $155 | 37 |
Match score weights: distance 35% · size 25% · config 20% · recency 20%. Top-matched comps best support the ARV.
Projected returns pro-forma
-3.0% appreciation · 3.0% rent growth · sell at horizon
- IRR
- -23.4%
- Equity multiple
- 0.20×
- Total profit
- $-35,816
- Equity at exit
- $23,707
- IRR
- -17.4%
- Equity multiple
- 0.03×
- Total profit
- $-43,134
- Equity at exit
- $13,747
Cash invested: $44,520 (down + closing). Projections, not guarantees.
Landlord ↔ Tenant lean methodology
- Overall (STATE)
- 87 Strongly Landlord-Friendly
- State Texas
- 87 Strongly Landlord-Friendly · R+5
- County
- — inherits STATE
- City
- — inherits STATE
ZIP-level market 77037
- Home prices YoY
- -16.0%
- Active inventory
- 40
- Price-to-rent
- 7.1×
Monthly cashflow live
- Estimated rent
- $1,866 high interval (Pro) →
- Mortgage (P&I)
- −$834
- Tax from tax record
- −$311 /mo · $3,729/yr
- Insurance
- −$66
- Flood insurance flood zone
- −$427 /mo · $5,118/yr
- HOA
- −$0
- Vacancy / Maint / Mgmt
- −$392
- Net cashflow
- $-163
Break-even live
Sensitivity live
| Price | -10% $-73 | -5% $-118 | +0% $-163 | +5% $-208 | +10% $-253 |
|---|---|---|---|---|---|
| Rent | -10% $-311 | -5% $-237 | +0% $-163 | +5% $-90 | +10% $-16 |
| Rate | -1.0pp $-83 | -0.5pp $-123 | base $-163 | +0.5pp $-205 | +1.0pp $-247 |
UW: 25.0% down · 7.5% · 30yr · 1.5% tax · 5.0% vac · 8.0% maint · 8.0% mgmt
Financing live
Cash to close
- Down payment
- $39,750
- Closing costs
- $4,770
- Reserves months
- —
- Total cash needed
- —
Loan-product check · same deal, 3 products live
Conventional
25% down · 7.5% · 30yr
- Down + closing
- —
- Monthly P&I
- —
- Monthly cashflow
- —
- DSCR
- —
- Eligible?
- —
Personal DTI + credit; lowest rate.
DSCR
20% down · 8.5% · 30yr
- Down + closing
- —
- Monthly P&I
- —
- Monthly cashflow
- —
- DSCR
- —
- Eligible?
- —
No personal income docs; deal must DSCR.
Hard money
10% down · 12.0% · 12mo
- Down + closing
- —
- Monthly P&I
- —
- Monthly cashflow
- —
- DSCR
- —
- Eligible?
- —
Short-term bridge; refi at stabilization.
Rent comps 21 comps
| Address | Beds | Baths | Sqft | Rent | $/sqft | DOM | Units | Dist |
|---|---|---|---|---|---|---|---|---|
| 206 Beaver Bend Rd Houston, TX | 4.0 | 1.5 | 1470 | $1,920 | $1.31 | 14d | 1 | 0.39mi |
| 9002 Bunny Run Dr Houston, TX | 3.0 | 2.0 | 1544 | $1,950 | $1.26 | 26d | 1 | 0.72mi |
| 1438 Peach Spring Dr Houston, TX | 4.0 | 1.5 | 1288 | $1,599 | $1.24 | 3d | 1 | 1.13mi |
| 9750 Deer Trail Dr Houston, TX | 2.0 | 2.0 | 1000 | $1,800 | $1.80 | 26d | 1 | 1.23mi |
| 9750 Deer Trail Dr Houston, TX | 3.0 | 2.0 | 1050 | $2,200 | $2.10 | 45d | 1 | 1.23mi |
| 411 E Carby Rd Houston, TX | 4.0 | 1.5 | 1806 | $1,649 | $0.91 | 24d | 1 | 1.33mi |
| 8406 De Priest St Unit A Houston, TX | 3.0 | 2.5 | 1600 | $1,695 | $1.06 | 45d | 1 | 1.40mi |
| 8404 De Priest St Unit A Houston, TX | 3.0 | 2.5 | 1600 | $1,900 | $1.19 | 45d | 1 | 1.40mi |
| 1330 Blue Bell Rd Houston, TX | 2.0–3.0 | 1.0–2.0 | 1418 | $1,790 | $1.26 | 1d | 7 | 1.40mi |
| 8312 De Priest St Unit B Houston, TX | 3.0 | 3.5 | 1500 | $1,900 | $1.27 | 22d | 1 | 1.42mi |
| 8312 De Priest St Unit A Houston, TX | 3.0 | 2.5 | 1500 | $1,900 | $1.27 | 22d | 1 | 1.42mi |
| 8310 De Priest St Unit B Houston, TX | 3.0 | 2.5 | 1500 | $1,900 | $1.27 | 22d | 1 | 1.43mi |
| 8306 De Priest St Unit A Houston, TX | 3.0 | 2.5 | 1500 | $1,900 | $1.27 | 22d | 1 | 1.44mi |
| 8304 De Priest St Unit B Houston, TX | 3.0 | 2.5 | 1600 | $1,900 | $1.19 | 24d | 1 | 1.44mi |
| 8118 De Priest St Unit B Houston, TX | 3.0 | 2.5 | 1500 | $1,900 | $1.27 | 45d | 1 | 1.46mi |
| 8122 De Priest St Unit A Houston, TX | 3.0 | 3.5 | 1500 | $1,900 | $1.27 | 45d | 1 | 1.46mi |
| 8120 De Priest St Unit B Houston, TX | 3.0 | 2.5 | 1500 | $1,900 | $1.27 | 45d | 1 | 1.46mi |
| 8120 De Priest St Unit A Houston, TX | 3.0 | 2.5 | 1500 | $1,750 | $1.17 | 45d | 1 | 1.46mi |
| 8112 De Priest St Unit B Houston, TX | 3.0 | 2.5 | 1500 | $1,750 | $1.17 | 1d | 1 | 1.49mi |
| 8110 De Priest St Unit A Houston, TX | 3.0 | 2.5 | 1500 | $1,900 | $1.27 | 45d | 1 | 1.50mi |
| 8108 De Priest St Unit B Houston, TX | 3.0 | 2.5 | 1500 | $1,900 | $1.27 | 45d | 1 | 1.50mi |
Listing history 11 events
-
2026-05-07$159,000 Active 375-char remark
-
2026-04-24soldstatus
-
2024-06-19historical
-
2024-06-10price $174,900
-
2024-06-09status Active
-
2024-06-07price $173,500
-
2024-06-07historical
-
2024-05-24$174,900 Active
-
2024-05-07soldstatus
-
2008-01-08soldstatus
-
1988-01-02soldstatus
ⓘ Source: listings_history table (triggers on properties + properties_extension) + one-shot
backfill from property_details.listing_events for pre-trigger history.
Tax reassessment forecast TX · Resets to sale price
- Current annual tax
- $3,729 · $311/mo
- Projected year-2 tax
- $3,729 · $311/mo
- Expected delta
- $0/yr ($0/mo · 0.0%)
ⓘ Screening estimate from a state-policy table — verify with the county assessor before closing.
Climate risk First Street
- Flood 8/10 Severe FEMA zone AE · 99% chance over 30 yrs
- Wildfire 1/10 Low
- Heat 9/10 Extreme 7 d/yr ≥109°F today · 24 d/yr by 30 yrs out
- Wind 9/10 Extreme 99% chance of damaging wind over 30 yrs
- Air quality 3/10 Moderate 3 unhealthy d/yr today · 4 by 30 yrs out
Nearby sold comps map
Loading sold comps map…
Walkable amenities ~0.75 mi
Loading nearby amenities…
Taxation est. · year 1
- Rental income
- $22,388
- − Mortgage interest
- −$8,906
- − Property taxes
- −$3,729
- − Insurance
- −$5,914
- − Repairs & maintenance
- −$1,791
- − Management
- −$1,791
- − Depreciation
- −$4,625
- Taxable loss
- −$4,368
- Est. tax savings @ 24.0%
- +$1,048
- After-tax cash flow
- $-913/yr
For passive investors: Depreciation is non-cash, so a rental often shows a tax loss while cash-flowing — sheltering income. Rental losses are passive: they offset passive income freely, and up to $25,000/yr can offset ordinary (W-2) income if you actively participate and your MAGI is under $100k (phasing out to $0 by $150k); unused losses carry forward. On sale, claimed depreciation is recaptured at up to 25%, and gains may owe capital-gains tax (a 1031 exchange can defer both). Figures are a year-1 estimate at your 24.0% rate — not tax advice; consult a CPA.
Schools (NCES district)
- District
- Aldine ISD
- NCES district ID
- 4807710
- Math proficiency
- 16% ▼ -23.00%
- Reading proficiency
- 21% ▼ -11.00%
- Median HH income
- $37,081
- Composite
- 15.42/100
- National rank
- #9317
- State rank
- #790 of 826 in TX
Livability — Houston
- Score
- 74/100
- State rank
- #184
- US rank
- #4771
Category grades
Schools grade is shown separately in the Schools card above.
Census & demographics
- City population
- 3,226,434
- Population (ZIP)
- 17,806
Population outlook (Harris County) Hauer SSP2
- Today (2025)
- 5,571,493 people
- By 2030
- 6,089,821 · +9.3%
- By 2040
- 7,142,806 · +28.2%
- By 2050
- 8,185,864 · +46.9%
- By 2075
- 10,574,329 · +89.8%
- By 2100
- 12,109,958 · +117.4%
Race, ethnicity, and origin ACS 2023
- Neighborhood character
- Predominantly Hispanic (90%)
- Race & ethnicity
- Hispanic / Latino 90% Two or more races 15% White 7% Black 2%
- Hispanic origin (detail)
- Mexican 75%
- Foreign-born
- 40% · Canada
- Languages at home
- 20% English-only · Spanish 80%
Political lean MEDSL · Harris
- 2024 margin
- Lean D (+5.5) · D 52.0% · R 46.4% · Other 1.6%
- 2008→2024 swing
- +3.9pp toward D · 2008: 1.6pp · 2024: 5.5pp
- All cycles
- 2024: D+5.5 2020: D+13.3 2016: D+12.4 2012: D+0.1 2008: D+1.6
Not yet ingested
- Civics
- —
Market trends
- HPI YoY
- ▼ -53.77%
- Current HPI
- 281.8846
- Rent YoY
- —
- Metro
- —
- State GDP YoY
- ▲ 3.95%
- F500 in state
- 110
Industry mix (Fortune 500 HQ in TX)
| Industry | F500 HQs | Revenue |
|---|---|---|
| Energy | 16 | $1,198B |
|
||
| Technology | 5 | $198B |
|
||
| Engineering / Construction | 4 | $72B |
|
||
| Energy Services | 3 | $60B |
|
||
| Utilities | 3 | $41B |
|
||
| Healthcare | 2 | $330B |
|
||
Price history
-9.1% since first listed14 events — show timeline
- 2026-05-29 Sold (Public Records) — Public Records
- 2026-05-28 Sold (MLS) — HARMLS
- 2026-05-19 Pending — HARMLS
- 2026-05-07 Listed $159,000 HARMLS
- 2026-04-24 Sold (Public Records) — Public Records
- 2024-06-19 Listing Removed — HARMLS
- 2024-06-10 Price Changed $174,900 HARMLS
- 2024-06-09 Relisted — HARMLS
- 2024-06-07 Price Changed $173,500 HARMLS
- 2024-06-07 Listing Removed — HARMLS
- 2024-05-24 Listed $174,900 HARMLS
- 2024-05-07 Sold (Public Records) — Public Records
- 2008-01-08 Sold (Public Records) — Public Records
- 1988-01-02 Sold (Public Records) — Public Records
Property tax history
+3.0%/yrLatest (2025): $3,729 · +13.7% YoY. Source: county tax records.
Cash-flow waterfall
monthlySold comps — $/sqft
last 12 mo · ≤1 miLoading sold comps…