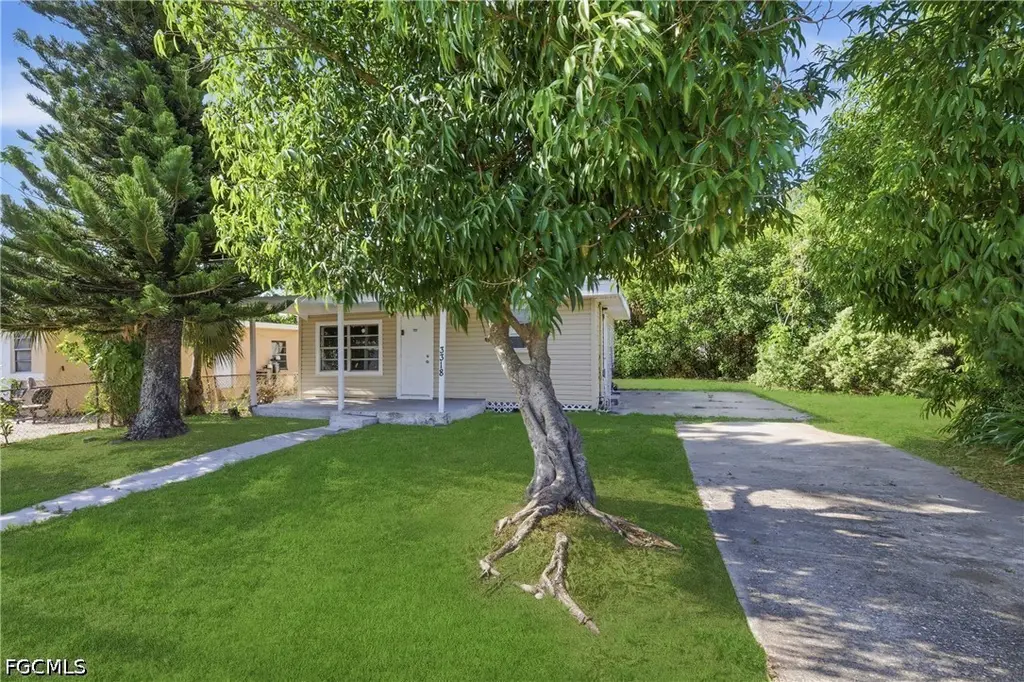
3318 Thomas St · Fort Myers, FL
Flood risk 4/10 · Minor
- FEMA flood zone
- X (unshaded)
- Chance of flooding over 30 yrs
- 0.22%
- Est. flood insurance / yr
- $507 – $1,088
Fire risk 2/10 · Minimal
- Est. fire insurance / yr
- $947 – $1,759
Heat risk 10/10 · Severe
- Hot days now (above 107°F)
- 7 days/yr
- Hot days in 30 yrs
- 30 days/yr
Wind risk 10/10 · Severe
- Chance of severe wind over 30 yrs
- 99.0%
Air-quality risk 2/10 · Minimal
- Unhealthy air days now
- 1 days/yr
- Unhealthy air days in 30 yrs
- 1 days/yr
Risk factors via First Street. Map © Google.
Why this score? — see what drove the D grade
The composite is a weighted blend of 9 inputs, each scored 0–100. Each bar is that input's sub-score; the figure is the points it added to the 100-point composite (weight × sub-score).
- Cash flow +15.3/30.0
- ARV discount +7.5/15.0
- DSCR +4.7/10.0
- Livability +4.3/5.0
- Schools +4.1/10.0
- 1% rule +3.9/10.0
- Condition / age +2.5/5.0
- Rent growth +1.4/5.0
- Appreciation +0.0/10.0
$158,900
🖨 Deal sheet (PDF) 📄 Offer letter ✓ Due diligence
Listing remarks MLS
* * Photos from prior to tenant occupancy * * Nearly new from top to bottom, Florida style home offers new roof, all new electrical, all new plumbing, new kitchen, new bathroom, new AC units, new flooring. .. .Starting to get the idea?! This two bedroom home just needs a new owner. Tenant in place at $1400 a month with a lease expiring 2/28/2023
Key facts
- Front porch
- Centrally located
- Backyard
Tags
Property features AI
Finance
- Financial info: Pets allowed
- HOA & community: No association fee
Exterior
- Parking: Driveway; Paved parking
- Security: Smoke detectors
- Utilities: Cable available; High-speed internet available; Public water; Public sewer
- Home design: Single-story; Faces north; Resale property
- Construction: Vinyl siding; Wood frame construction; Rolled/hot mop roof; Built on foundation (wood frame listed)
- Exterior features: Open patio and porch; Patio; Porch; Rectangular lot; South exposure; Publicly maintained road
Interior
- Kitchen: Freezer; Refrigerator; Self-cleaning oven
- Bedrooms: Bedroom on main level
- Flooring: Laminate
- Bathrooms: 1 full bathroom
- Heating & cooling: Window unit heating; Window unit cooling
- Interior features: Single-hung windows; Unfurnished; Tub with shower; Bedroom on main level; Family room
- Laundry & utility: Washer hookup; Dryer hookup
Neighborhood map
What this means for you Summary
Snapshot
- This is a 2-bed/1.0-bath single-family listed at $159k.
Deal economics
- At list price, monthly cash flow is $59 ($703/yr) — positive.
- The deal already cash-flows at list — no discount required.
- To meet the 1% rule (rent ≥ 1% of price), the offer needs to be $142k (10.5% below list).
- Recommended offer: $142k (10.5% below list) — sets the bar for 1% rule.
- Cap rate 6.7% vs local median 3.3% in Fort Myers — top-decile yield for the area; either an underpriced asset or a hidden risk that comps aren't pricing in. Stress-test before assuming the spread holds.
Location & tenants
- Location reads 86/100 on livability (#14 in FL, #383 nationally) — a professional / high-income tenant draw. Strengths: amenities A+, commute A+, housing A+.
- Lee (suburban): math 47% / reading 50% proficiency, ranked #42 of 73 in FL (top 58%) — families likely to look elsewhere, expect single-tenant / working-renter base with shorter leases.
- Zoned schools: Heights Elementary School (math 74% / reading 67%, grade A-, #333 of 2,144 statewide, top 16%, 1,109 students, 38% FRL); Lexington Middle School (math 55% / reading 54%, grade B-, #183 of 571 statewide, top 34%, 1,138 students, 44% FRL); South Fort Myers High School (math 23% / reading 30%, grade F, #489 of 667 statewide, top 74%, 1,917 students, 50% FRL).
- Market conditions: Rents falling (-4.3%/yr); 271 active listings in the ZIP; 32 comparable units currently listed for rent nearby; rentals at typical pace (median 26d on market — plan ~3-4 weeks tenant-placement turnaround); 15,411 units permitted in Lee County in 2024 (4,686 in 5+ unit buildings).
- This rent runs 32% of the median local income ($53k/yr) — at the standard rent-burdened threshold; future hikes will face affordability resistance.
Forward outlook
- Local home prices are declining (-3.0%/yr); year-one equity from $1k of loan paydown is wiped out by about $5k of value loss. Plan a longer hold.
- Lee County population projected at +44% by 2050 — long-run rental-demand tailwind backs the buy-and-hold thesis.
Negotiation context
- It's been on market 35 days — a 3% lower offer ($154k) is reasonable based on typical stale-listing flexibility.
- 11 sale attempts since 10y ago; this cycle's ask is 10493% above the opening price — seller raised mid-cycle; expect resistance to lowballs.
Risks & watch-outs
- Climate carrying-cost: severe wind risk, 99% chance of damaging wind over 30y; extreme-heat days projected 7→30/yr by 2055 (HVAC capex compounding) — expect insurance premiums to compound above CPI over the hold.
Questions for the listing agent
- It's been on market 35 days. Have you received any prior offers? Is the seller open to a 11% concession, seller financing, or rate buy-down credit?
- Built in 1961 — when were the roof, HVAC, electrical panel, plumbing, and water heater last replaced?
- Is there a deadline driving the sale (1031 exchange, divorce, estate, relocation)? That informs how much negotiation room exists.
- The area grade is low — what's the realistic commute time and amenity access for the typical tenant pool here? Any planned neighborhood developments (good or bad) we should know about?
- What's the average days-on-market for RENTAL listings here right now (not sales)? A rising rental-DOM trend means longer vacancies and softer asking-rent achievability than the comps imply.
- What's the recent tenant-quality profile in this submarket — average credit score on applications, eviction rate, late-payment / NSF rate, and stable-employment percentage? A property-management company in the area should have these aggregated.
- How much new for-sale + rental construction is in the pipeline within 1–3 miles? Heavy new supply typically softens prices + rents 12–24 months out; constrained supply supports both.
Investment metrics
- 1% rule
- 0.89% ✗
- Cap rate
- 6.74%
- Cash-on-cash
- 1.58%
- DSCR
- 1.07
- GRM
- 9.3
CMA / ARV
- ARV (on-the-fly)
- $84,864
- Comps found
- 1
Show comp detail 1 sale within ~0.75 mi
| Address | Dist | Beds/Ba | Sqft | Sold | Price | $/sf | Match |
|---|---|---|---|---|---|---|---|
| 3131 Market St | 0.27mi | 2/1.0 | 696 (+12%) | 3mo | $95,000 | $136 | 66 |
Match score weights: distance 35% · size 25% · config 20% · recency 20%. Top-matched comps best support the ARV.
Projected returns pro-forma
-3.0% appreciation · 0.0% rent growth · sell at horizon
- IRR
- -17.1%
- Equity multiple
- 0.41×
- Total profit
- $-26,186
- Equity at exit
- $23,693
- IRR
- -15.7%
- Equity multiple
- 0.23×
- Total profit
- $-34,102
- Equity at exit
- $13,739
Cash invested: $44,492 (down + closing). Projections, not guarantees.
Landlord ↔ Tenant lean methodology
- Overall (STATE)
- 87 Strongly Landlord-Friendly
- State Florida
- 87 Strongly Landlord-Friendly · R+3
- County
- — inherits STATE
- City
- — inherits STATE
ZIP-level market 33916
- Home prices YoY
- -28.2%
- Rents YoY
- -4.3%
- Active inventory
- 271
- Price-to-rent
- 9.3×
Monthly cashflow live
- Estimated rent
- $1,422 high interval (Pro) →
- Mortgage (P&I)
- −$833
- Tax from tax record
- −$165 /mo · $1,984/yr
- Insurance
- −$66
- HOA
- −$0
- Vacancy / Maint / Mgmt
- −$299
- Net cashflow
- $59
Break-even live
Sensitivity live
| Price | -10% $148 | -5% $104 | +0% $59 | +5% $14 | +10% $-31 |
|---|---|---|---|---|---|
| Rent | -10% $-54 | -5% $2 | +0% $59 | +5% $115 | +10% $171 |
| Rate | -1.0pp $139 | -0.5pp $99 | base $59 | +0.5pp $17 | +1.0pp $-25 |
UW: 25.0% down · 7.5% · 30yr · 1.5% tax · 5.0% vac · 8.0% maint · 8.0% mgmt
Financing live
Cash to close
- Down payment
- $39,725
- Closing costs
- $4,767
- Reserves months
- —
- Total cash needed
- —
Loan-product check · same deal, 3 products live
Conventional
25% down · 7.5% · 30yr
- Down + closing
- —
- Monthly P&I
- —
- Monthly cashflow
- —
- DSCR
- —
- Eligible?
- —
Personal DTI + credit; lowest rate.
DSCR
20% down · 8.5% · 30yr
- Down + closing
- —
- Monthly P&I
- —
- Monthly cashflow
- —
- DSCR
- —
- Eligible?
- —
No personal income docs; deal must DSCR.
Hard money
10% down · 12.0% · 12mo
- Down + closing
- —
- Monthly P&I
- —
- Monthly cashflow
- —
- DSCR
- —
- Eligible?
- —
Short-term bridge; refi at stabilization.
Rent comps 32 comps
| Address | Beds | Baths | Sqft | Rent | $/sqft | DOM | Units | Dist |
|---|---|---|---|---|---|---|---|---|
| 4051 Regata Way Fort Myers, FL | 1.0–3.0 | 1.0–2.0 | 987 | $1,678 | $1.70 | 4d | 34 | 0.14mi |
| 3608 Sammy Watkins Ave #2 Fort Myers, FL | 2.0 | 1.0 | 650 | $1,200 | $1.85 | 20d | 1 | 0.35mi |
| 3608 Sammy Watkins Ave Fort Myers, FL | 2.0 | 1.0 | 650 | $1,200 | $1.85 | 25d | 1 | 0.35mi |
| 3042 Douglas Ave Fort Myers, FL | 2.0 | 1.0 | 640 | $1,150 | $1.80 | 4d | 1 | 0.39mi |
| 3042 Douglas Ave Fort Myers, FL | 2.0 | 1.0 | 640 | $1,150 | $1.80 | 15d | 1 | 0.39mi |
| 2170 Davis Ct Fort Myers, FL | 1.0 | 1.0 | 481 | $995 | $2.07 | 25d | 1 | 0.47mi |
| 2930 Thomas St Fort Myers, FL | 2.0 | 1.0 | 550 | $1,600 | $2.91 | 17d | 1 | 0.53mi |
| 3041 2nd St Apt 2 Fort Myers, FL | 2.0 | 1.0 | 621 | $995 | $1.60 | 25d | 1 | 0.83mi |
| 3033 2nd St Unit 1 Fort Myers, FL | 2.0 | 1.0 | 582 | $1,350 | $2.32 | 25d | 1 | 0.84mi |
| 2657 Lafayette St Fort Myers, FL | 2.0 | 1.0 | 696 | $1,650 | $2.37 | 25d | 1 | 0.87mi |
| 2651 Lafayette St Unit 2651 Fort Myers, FL | 2.0 | 1.0 | 650 | $1,300 | $2.00 | 25d | 1 | 0.87mi |
| 221 Maria St Unit 225 Fort Myers, FL | 2.0 | 1.0 | 720 | $1,095 | $1.52 | 25d | 1 | 1.14mi |
| 227 Maria St Fort Myers, FL | 2.0 | 1.0 | 720 | $1,095 | $1.52 | 25d | 1 | 1.15mi |
| 2505 Royal Palm Ave Fort Myers, FL | 2.0 | 1.0 | 750 | $1,475 | $1.97 | 25d | 1 | 1.17mi |
| 2315 Central Ave Fort Myers, FL | 2.0 | 1.0–1.5 | 635 | $1,650 | $2.60 | 25d | 1 | 1.18mi |
| 2575 Second St Fort Myers, FL | 2.0 | 1.0 | 750 | $1,488 | $1.98 | 3d | 3 | 1.22mi |
| 2610 Providence St Unit 10 Fort Myers, FL | 2.0 | 1.0 | 750 | $1,495 | $1.99 | 23d | 1 | 1.24mi |
| 2452 Stella St Unit 204 Fort Myers, FL | 2.0 | 1.0 | 675 | $1,250 | $1.85 | 25d | 1 | 1.27mi |
| 2452 Stella St Unit 105 Fort Myers, FL | 2.0 | 1.0 | 676 | $1,000 | $1.48 | 13d | 1 | 1.27mi |
| 2825 Palm Beach Blvd Fort Myers, FL | 1.0–3.0 | 1.5–2.5 | 990 | $1,900 | $1.92 | 12d | 7 | 1.28mi |
| 2590 First St #203 Fort Myers, FL | 1.0 | 1.0 | 473 | $1,550 | $3.28 | 15d | 1 | 1.30mi |
| 2590 First St #203 Fort Myers, FL | 1.0 | 1.0 | 473 | $1,550 | $3.28 | 25d | 1 | 1.30mi |
| 3920 Mina Cir Fort Myers, FL | 1.0–3.0 | 1.0–2.0 | 992 | $2,034 | $2.05 | 5d | 39 | 1.31mi |
| 4220 Coasterra DR Fort Myers, FL | 1.0–3.0 | 1.0–2.5 | 1072 | $2,080 | $1.94 | 5d | 10 | 1.31mi |
| 2771 Royal Palm Ave Fort Myers, FL | 1.0 | 1.0 | 700 | $1,125 | $1.61 | 25d | 1 | 1.32mi |
| 2554 First St Fort Myers, FL | 1.0 | 1.0 | 750 | $1,250 | $1.67 | 17d | 2 | 1.35mi |
| 2544 First St #104 Fort Myers, FL | 1.0 | 1.0 | 583 | $1,350 | $2.32 | 25d | 1 | 1.35mi |
| 2330 Union St Fort Myers, FL | 3.0 | 1.0–2.0 | 951 | $3,182 | $3.34 | 5d | 27 | 1.44mi |
| 2480 First St Fort Myers, FL | 2.0 | 1.0–2.0 | 984 | $2,499 | $2.54 | 4d | 26 | 1.45mi |
| 3175 Royalston Ave #105 Fort Myers, FL | 1.0 | 1.0 | 476 | $1,059 | $2.22 | 25d | 1 | 1.45mi |
| 3155 Royalston Ave #201 Fort Myers, FL | 1.0 | 1.0 | 476 | $1,059 | $2.22 | 25d | 1 | 1.45mi |
| 2950 Royal Palm Ave Fort Myers, FL | 2.0 | 1.0 | 732 | $1,522 | $2.08 | 25d | 1 | 1.46mi |
Listing history 46 events
-
2026-06-22days on market $158,900 Active 35 DOM
-
2026-06-17days on market $158,900 Active 31 DOM
-
2026-06-16days on market $158,900 Active 30 DOM
-
2026-06-15days on market $158,900 Active 29 DOM
-
2026-06-13days on market $158,900 Active 27 DOM
-
2026-06-10days on market $158,900 Active 24 DOM
-
2026-06-09days on market $158,900 Active 23 DOM
-
2026-06-08days on market $158,900 Active 22 DOM
-
2026-06-07days on market $158,900 Active 21 DOM
-
2026-06-03days on market $158,900 Active 17 DOM
-
2026-06-02days on market $158,900 Active 16 DOM
-
2026-06-01days on market $158,900 Active 15 DOM
-
2026-05-31days on market $158,900 Active 14 DOM
-
2026-05-16$1,500
-
2026-05-07$158,900 Active
-
2026-04-20historical $1,500
-
2026-01-06price $1,500
-
2025-11-20$1,600
-
2024-12-16historical $1,400
-
2024-12-09$1,400
-
2022-08-09price $1,600
-
2022-08-02soldstatus $150,000
-
2022-08-01soldstatus $150,000 Closed 351-char remark
Show marketing remark (351 chars)
* * Photos from prior to tenant occupancy * * Nearly new from top to bottom, Florida style home offers new roof, all new electrical, all new plumbing, new kitchen, new bathroom, new AC units, new flooring. .. .Starting to get the idea?! This two bedroom home just needs a new owner. Tenant in place at $1400 a month with a lease expiring 2/28/2023
-
2022-06-23status Pending 351-char remark
Show marketing remark (351 chars)
* * Photos from prior to tenant occupancy * * Nearly new from top to bottom, Florida style home offers new roof, all new electrical, all new plumbing, new kitchen, new bathroom, new AC units, new flooring. .. .Starting to get the idea?! This two bedroom home just needs a new owner. Tenant in place at $1400 a month with a lease expiring 2/28/2023
-
2022-06-21$150,000 Active 351-char remark
Show marketing remark (351 chars)
* * Photos from prior to tenant occupancy * * Nearly new from top to bottom, Florida style home offers new roof, all new electrical, all new plumbing, new kitchen, new bathroom, new AC units, new flooring. .. .Starting to get the idea?! This two bedroom home just needs a new owner. Tenant in place at $1400 a month with a lease expiring 2/28/2023
-
2021-02-08historical
-
2021-02-05status Active
-
2021-01-25status Pending
-
2020-11-23price $89,500
-
2020-09-16price $89,900
-
2020-09-02status Active
-
2020-09-01status Pending
-
2020-08-31$93,900 Active
-
2019-01-29historical
-
2019-01-28$39,900
-
2017-08-24historical
-
2017-08-17$39,900 Active
-
2016-07-31historical
-
2016-07-12price $43,900
-
2016-05-06$44,900 Active
-
2015-03-02price $15,000
-
2012-06-15soldstatus $16,500
-
2005-10-21soldstatus $65,000
-
2001-08-06soldstatus $45,000
-
2001-08-03soldstatus $45,000
-
1981-01-01soldstatus $5,800
ⓘ Source: listings_history table (triggers on properties + properties_extension) + one-shot
backfill from property_details.listing_events for pre-trigger history.
Tax reassessment forecast FL · Resets to sale price
- Current annual tax
- $1,984 · $165/mo
- Projected year-2 tax
- $1,984 · $165/mo
- Expected delta
- $0/yr ($0/mo · -0.0%)
ⓘ Screening estimate from a state-policy table — verify with the county assessor before closing.
Climate risk First Street
- Flood 4/10 Moderate FEMA zone X (unshaded) · 22% chance over 30 yrs
- Wildfire 2/10 Low
- Heat 10/10 Extreme 7 d/yr ≥107°F today · 30 d/yr by 30 yrs out
- Wind 10/10 Extreme 99% chance of damaging wind over 30 yrs
- Air quality 2/10 Low 1 unhealthy d/yr today · 1 by 30 yrs out
Nearby sold comps map
Loading sold comps map…
Walkable amenities ~0.75 mi
Loading nearby amenities…
Taxation est. · year 1
- Rental income
- $17,064
- − Mortgage interest
- −$8,901
- − Property taxes
- −$1,984
- − Insurance
- −$794
- − Repairs & maintenance
- −$1,365
- − Management
- −$1,365
- − Depreciation
- −$4,623
- Taxable loss
- −$1,968
- Est. tax savings @ 24.0%
- +$472
- After-tax cash flow
- $1,175/yr
For passive investors: Depreciation is non-cash, so a rental often shows a tax loss while cash-flowing — sheltering income. Rental losses are passive: they offset passive income freely, and up to $25,000/yr can offset ordinary (W-2) income if you actively participate and your MAGI is under $100k (phasing out to $0 by $150k); unused losses carry forward. On sale, claimed depreciation is recaptured at up to 25%, and gains may owe capital-gains tax (a 1031 exchange can defer both). Figures are a year-1 estimate at your 24.0% rate — not tax advice; consult a CPA.
Schools (NCES district)
- District
- Lee
- NCES district ID
- 1201080
- Math proficiency
- 47% ▼ -11.00%
- Reading proficiency
- 50% ▼ -4.00%
- Median HH income
- $49,518
- Composite
- 41.49/100
- National rank
- #3458
- State rank
- #42 of 73 in FL
Livability — Fort Myers
- Score
- 86/100
- State rank
- #14
- US rank
- #383
Category grades
Schools grade is shown separately in the Schools card above.
Census & demographics
- Census place
- Fort Myers, FL
- County
- Lee County · 788,662 people
- City population
- 278,598
- Metro
- Cape Coral-Fort Myers, FL
- Population (ZIP)
- 27,943
- Household income
- $52,586
- Rent vs Own
- Severe rent burden
- 2324.0
Population outlook (Lee County) Hauer SSP2
- Today (2025)
- 871,946 people
- By 2030
- 955,468 · +9.6%
- By 2040
- 1,113,587 · +27.7%
- By 2050
- 1,256,891 · +44.1%
- By 2075
- 1,560,270 · +78.9%
- By 2100
- 1,726,848 · +98.0%
Race, ethnicity, and origin ACS 2023
- Neighborhood character
- Highly diverse neighborhood (Simpson 0.71)
- Race & ethnicity
- Black 34% Hispanic / Latino 30% White 28% Two or more races 21% Asian 2%
- Hispanic origin (detail)
- Mexican 5% Puerto Rican 6% Cuban 7% Dominican 1%
- Common ancestry
- Estonian 3% Hispanic 1% Romanian 1%
- Foreign-born
- 22% · Canada, Vietnam, China
- Languages at home
- 69% English-only · Spanish 24% Other Indo-European 4% French/Haitian/Cajun 1%
Political lean MEDSL · Lee
- 2024 margin
- Strong R (+28.4) · D 35.5% · R 63.9%
- 2008→2024 swing
- -18.0pp toward R · 2008: -10.4pp · 2024: -28.4pp
- All cycles
- 2024: R+28.4 2020: R+19.2 2016: R+20.4 2012: R+16.6 2008: R+10.4
Not yet ingested
- Civics
- —
Market trends
- HPI YoY
- ▼ -95.73%
- Current HPI
- 243.2657
- Rent YoY
- ▼ -4.30%
- Metro
- Cape Coral-Fort Myers, FL
- State GDP YoY
- ▲ 3.28%
- F500 in state
- 36
Industry mix (Fortune 500 HQ in FL)
| Industry | F500 HQs | Revenue |
|---|---|---|
| Industrial Technology | 2 | $29B |
|
||
| Insurance | 2 | $17B |
|
||
| Retail | 1 | $60B |
|
||
| Technology Distribution | 1 | $58B |
|
||
| Homebuilding | 1 | $35B |
|
||
| Technology Manufacturing | 1 | $35B |
|
||
Price history
-74.1% since first listed33 events — show timeline
- 2026-05-16 Listed for Rent $1,500 TURBOTENANT
- 2026-05-07 Listed $158,900 FORTMLS
- 2026-04-20 Rental Removed $1,500 TURBOTENANT
- 2026-01-06 Price Changed $1,500 TURBOTENANT
- 2025-11-20 Listed for Rent $1,600 TURBOTENANT
- 2024-12-16 Rental Removed $1,400 TURBOTENANT
- 2024-12-09 Listed for Rent $1,400 TURBOTENANT
- 2022-08-09 Price Changed $1,600 RENT.
- 2022-08-02 Sold (Public Records) $150,000 Public Records
- 2022-08-01 Sold (MLS) $150,000 FORTMLS
- 2022-06-23 Pending — FORTMLS
- 2022-06-21 Listed $150,000 FORTMLS
- 2021-02-08 Listing Removed — FORTMLS
- 2021-02-05 Relisted — FORTMLS
- 2021-01-25 Pending — FORTMLS
- 2020-11-23 Price Changed $89,500 FORTMLS
- 2020-09-16 Price Changed $89,900 FORTMLS
- 2020-09-02 Relisted — FORTMLS
- 2020-09-01 Pending — FORTMLS
- 2020-08-31 Listed $93,900 FORTMLS
- 2019-01-29 Listing Removed — FORTMLS
- 2019-01-28 Listed $39,900 FORTMLS
- 2017-08-24 Listing Removed — FORTMLS
- 2017-08-17 Listed $39,900 FORTMLS
- 2016-07-31 Listing Removed — FORTMLS
- 2016-07-12 Price Changed $43,900 FORTMLS
- 2016-05-06 Listed $44,900 FORTMLS
- 2015-03-02 Price Changed $15,000 FORTMLS
- 2012-06-15 Sold (MLS) $16,500 FORTMLS
- 2005-10-21 Sold (Public Records) $65,000 Public Records
- 2001-08-06 Sold (Public Records) $45,000 Public Records
- 2001-08-03 Sold (MLS) $45,000 FORTMLS
- 1981-01-01 Sold (Public Records) $5,800 Public Records
Property tax history
+11.9%/yrLatest (2025): $1,984 · +8.8% YoY. Source: county tax records.
Cash-flow waterfall
monthlySold comps — $/sqft
last 12 mo · ≤1 miLoading sold comps…