 14-Plex
3047 David Ave · San Jose, CA
Flood risk 1/10 · Minimal
- FEMA flood zone
- D
- Chance of flooding over 30 yrs
- 0.0%
- Est. flood insurance / yr
- $544 – $1,084
Fire risk 1/10 · Minimal
- Est. fire insurance / yr
- $659 – $1,223
Heat risk 4/10 · Minor
- Hot days now (above 94°F)
- 7 days/yr
- Hot days in 30 yrs
- 14 days/yr
Wind risk 1/10 · Minimal
- Chance of severe wind over 30 yrs
- —
Air-quality risk 9/10 · Severe
- Unhealthy air days now
- 17 days/yr
- Unhealthy air days in 30 yrs
- 17 days/yr
Risk factors via First Street. Map © Google.
Why this score? — see what drove the C grade
The composite is a weighted blend of 9 inputs, each scored 0–100. Each bar is that input's sub-score; the figure is the points it added to the 100-point composite (weight × sub-score).
- Cash flow +20.9/30.0
- ARV discount +7.5/15.0
- DSCR +6.7/10.0
- 1% rule +5.2/10.0
- Schools +5.1/10.0
- Livability +3.9/5.0
- Rent growth +3.2/5.0
- Condition / age +2.5/5.0
- Appreciation +0.0/10.0
$3,620,000
🖨 Deal sheet 📄 Offer letter ✓ Due diligence
Multi-family units
County records classify this as Multi-Family (5+ Unit). Listing-text estimate: 14 units. confirmed
5+ unit building — per-unit beds/baths from public records are typically unavailable; the breakdown below (if shown) is an estimate from the listing text.
Listing remarks MLS
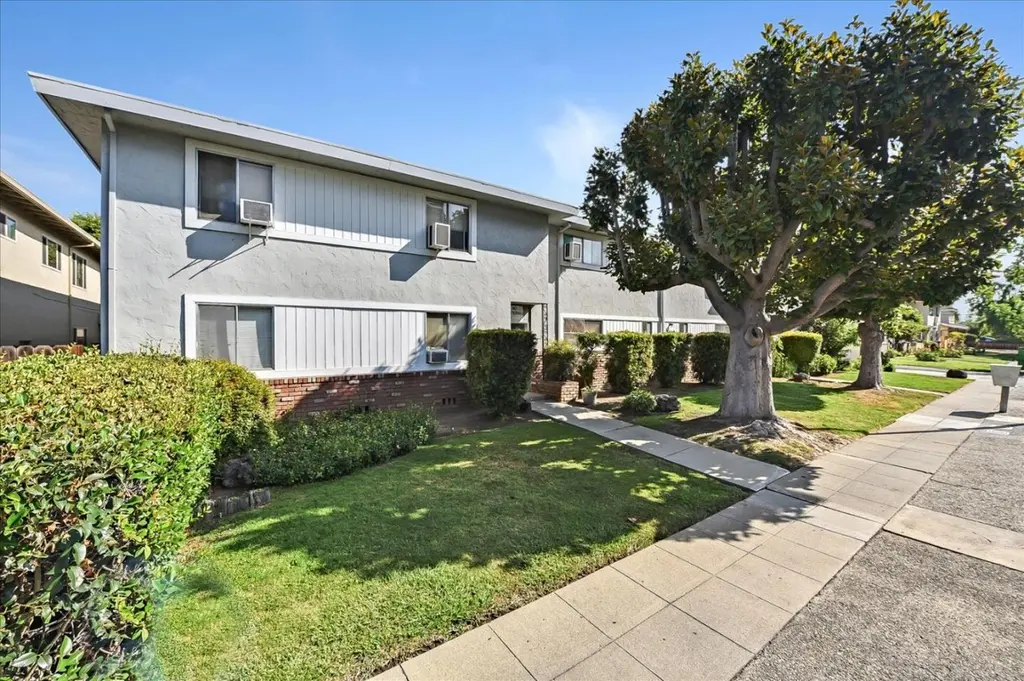
3047 David Avenue, a 14-unit multifamily property in San Jose, California. Built in 1958, the property sits on a 13,200 square foot parcel and includes approximately 8,076 square feet of rentable space.The unit mix consists of ten one-bedroom/one-bath units and four two-bedroom/one-bath units, offering an efficient layout that appeals to a wide tenant base. The garden-style design allows for easy management and has historically supported strong occupancy. The property is ideally located between Historic Downtown Campbell and Santana Row, with convenient access to dining, retail, and entertainment. It is also within 35 miles of major tech employers, including Adobe, eBay, PayPal, Zoom, Western Digital, and Nutanix. The location also offers excellent connectivity via Highways 280, 880, and 17, further supporting strong tenant demand.
Key facts
- Garden style design
- 0.3 acre lot
- 4 parking spots
Tags
Property features AI
Finance
- Other: Property Primary ID: 425330; Lot size approximately 0.3 acres; Listed as incorporated
- Financial info: 14 units in the complex; Annual rental income reported: $276,321; Annual gross income reported: $278,841; Gross scheduled income: $278,841; Gross rent multiplier: 13.27; Other income: $2,520; Total expenses: $112,525; Other expenses: $600; Landscaping expense: $1,650; Trash expense: $3,838; Utility expenses: $18,353; Tenant-paid utilities: electric and gas
Exterior
- Parking: Assigned spaces; Carport parking; At least 4 parking spaces available; Carport capacity listed as 10 (minimum)
- Utilities: Public water; Sewer (public); Individual electric meters; Individual gas meters; Separate electric and separate gas meters
- Home design: One building; Zoned RM
- Construction: Wood frame construction; Concrete perimeter foundation
- Exterior features: Composition/Shingle roof; Tenant pays electric and gas utilities
Interior
- Bedrooms: Ten 1-bedroom units; Four 2-bedroom units
- Bathrooms: One full bath in 1-bedroom units; One full bath in 2-bedroom units
- Heating & cooling: Wall furnace heating; Window/Wall cooling units
- Interior features: Wall furnaces for heating; Window/wall cooling units
Neighborhood map
What this means for you Summary
Snapshot
- This is a 10×1bd/1ba + 4×2bd/1ba units multifamily listed at $3.62M.
Deal economics
- At list price, monthly cash flow is $5k ($61k/yr) — positive. Per door: $361/mo.
- The deal already cash-flows at list — no discount required.
- Meets the 1% rule at list price ($37k rent vs $3.62M).
- Recommended offer: $3.40M (6.0% below list) — sets the bar for market timing.
- Cap rate 8.0% vs local median 1.6% in San Jose — top-decile yield for the area; either an underpriced asset or a hidden risk that comps aren't pricing in. Stress-test before assuming the spread holds.
Location & tenants
- Location reads 78/100 on livability (#68 in CA, #2,559 nationally) — a middle-class / working-renter tenant base. Strengths: amenities A+, commute A+, employment A+; Watch: crime F, cost of living F.
- Campbell Union (suburban): math 51% / reading 58% proficiency, ranked #293 of 1,400 in CA (top 21%) — acceptable for families but not a draw, mixed tenant base, ~2y average lease.
- Zoned schools: Campbell School of Innovation (781 students, 22% FRL, charter).
- Market conditions: Rents rising (+2.9%/yr); 65 active listings in the ZIP; high-income renter base; 3,838 units permitted in Santa Clara County in 2024 (1,886 in 5+ unit buildings).
- At $37,093/mo this rent would consume 339% of the median local household income ($131k/yr) (locally 1774% of renters already pay >50% of income on rent) — very limited rent-growth headroom before tenants either downsize or default.
Forward outlook
- Local home prices are declining (-3.0%/yr); year-one equity from $25k of loan paydown is wiped out by about $109k of value loss. Plan a longer hold.
- Santa Clara County population projected at +24% by 2050 — long-run rental-demand tailwind backs the buy-and-hold thesis.
Negotiation context
- It's been on market 66 days — a 6% lower offer ($3.40M) is reasonable based on typical stale-listing flexibility.
- 2 sale attempts with the ask held roughly flat each time — persistent listings suggest the price (not the market) is what's stuck; bring a comps-based counter.
- Current owner paid $643k; list at $3.62M implies a 463% gain — meaningful room to come down on a strong offer.
Risks & watch-outs
- Watch-outs: built in 1958 — expect roof / HVAC / electrical / plumbing capex.
Questions for the listing agent
- It's been on market 66 days. Have you received any prior offers? Is the seller open to a 6% concession, seller financing, or rate buy-down credit?
- Can we see the unit-by-unit rent roll, current vacancy, and any below-market leases? What's the average tenancy length?
- What capital expenditures (roof, boiler, parking lot, exteriors) have been made in the last 5 years, and what's planned in the next 2?
- Built in 1958 — when were the roof, HVAC, electrical panel, plumbing, and water heater last replaced?
- Why hasn't it sold? Are there any deal-killer items the seller is aware of (foundation, flood, title, zoning, code violations)?
- Is there a deadline driving the sale (1031 exchange, divorce, estate, relocation)? That informs how much negotiation room exists.
- Crime grade is F in this area — have there been break-ins, vandalism, or insurance claims at this property in the last 3 years? What carrier currently insures it and at what premium?
- What's the average days-on-market for RENTAL listings here right now (not sales)? A rising rental-DOM trend means longer vacancies and softer asking-rent achievability than the comps imply.
- What's the recent tenant-quality profile in this submarket — average credit score on applications, eviction rate, late-payment / NSF rate, and stable-employment percentage? A property-management company in the area should have these aggregated.
- How much new apartment / multifamily construction is in the pipeline within 1–3 miles? Heavy new supply (>2% of stock underway) typically softens rents 12–24 months out; light construction supports rent growth.
Investment metrics
- 1% rule
- 1.02% ✓
- Cap rate
- 7.97%
- Cash-on-cash
- 5.98%
- DSCR
- 1.27
- GRM
- 8.1
CMA / ARV
No comps found within radius.
Projected returns pro-forma
-3.0% appreciation · 2.88% rent growth · sell at horizon
- IRR
- -7.2%
- Equity multiple
- 0.73×
- Total profit
- $-269,048
- Equity at exit
- $539,754
- IRR
- 2.3%
- Equity multiple
- 1.16×
- Total profit
- $162,303
- Equity at exit
- $312,991
Cash invested: $1,013,600 (down + closing). Projections, not guarantees.
Landlord ↔ Tenant lean methodology
- Overall (CITY)
- 0 Strongly Tenant-Friendly
- State California
- 18 Strongly Tenant-Friendly · D+13
- County
- — inherits STATE
- City San Jose
- 0 Strongly Tenant-Friendly · D+24
ZIP-level market 95128
- Rents YoY
- 2.9%
- Active inventory
- 65
- Price-to-rent
- 117.4×
Monthly cashflow live
- Estimated rent
- $37,093 high interval (Pro) →
- Mortgage (P&I)
- −$18,984
- Tax from tax record
- −$3,757 /mo · $45,082/yr
- Insurance
- −$1,508
- HOA
- −$0
- Vacancy / Maint / Mgmt
- −$7,790
- Net cashflow
- $5,055
Break-even live
14-unit breakdown (identical units grouped — click to expand)
| Units | Beds | Baths | Est. rent |
|---|---|---|---|
| 10× units | 1 | 1 | $25,700 |
| #1 | 1 | 1 | $2,570 |
| #2 | 1 | 1 | $2,570 |
| #3 | 1 | 1 | $2,570 |
| #4 | 1 | 1 | $2,570 |
| #5 | 1 | 1 | $2,570 |
| #6 | 1 | 1 | $2,570 |
| #7 | 1 | 1 | $2,570 |
| #8 | 1 | 1 | $2,570 |
| #9 | 1 | 1 | $2,570 |
| #10 | 1 | 1 | $2,570 |
| 4× units | 2 | 1 | $11,396 |
| #11 | 2 | 1 | $2,849 |
| #12 | 2 | 1 | $2,849 |
| #13 | 2 | 1 | $2,849 |
| #14 | 2 | 1 | $2,849 |
| Total (14 units) | $37,093 | ||
UW: 25.0% down · 7.5% · 30yr · 1.5% tax · 5.0% vac · 8.0% maint · 8.0% mgmt
Financing live
Cash to close
- Down payment
- $905,000
- Closing costs
- $108,600
- Reserves months
- —
- Total cash needed
- —
Loan-product check · same deal, 3 products live
Conventional
25% down · 7.5% · 30yr
- Down + closing
- —
- Monthly P&I
- —
- Monthly cashflow
- —
- DSCR
- —
- Eligible?
- —
Personal DTI + credit; lowest rate.
DSCR
20% down · 8.5% · 30yr
- Down + closing
- —
- Monthly P&I
- —
- Monthly cashflow
- —
- DSCR
- —
- Eligible?
- —
No personal income docs; deal must DSCR.
Hard money
10% down · 12.0% · 12mo
- Down + closing
- —
- Monthly P&I
- —
- Monthly cashflow
- —
- DSCR
- —
- Eligible?
- —
Short-term bridge; refi at stabilization.
Listing history 19 events
-
2026-06-18days on market $3,620,000 Active 66 DOM
-
2026-06-17days on market $3,620,000 Active 65 DOM
-
2026-06-16days on market $3,620,000 Active 64 DOM
-
2026-06-15days on market $3,620,000 Active 63 DOM
-
2026-06-13days on market $3,620,000 Active 61 DOM
-
2026-06-13pricedays on market $3,620,000 Active 60 DOM
-
2026-06-09days on market $3,700,000 Active 57 DOM
-
2026-06-08days on market $3,700,000 Active 56 DOM
-
2026-06-07days on market $3,700,000 Active 55 DOM
-
2026-06-05days on market $3,700,000 Active 52 DOM
-
2026-06-03days on market $3,700,000 Active 51 DOM
-
2026-06-02days on market $3,700,000 Active 50 DOM
-
2026-06-01days on market $3,700,000 Active 49 DOM
-
2026-05-31days on market $3,700,000 Active 48 DOM
-
2026-04-13historical
Show marketing remark (843 chars)
3047 David Avenue, a 14-unit multifamily property in San Jose, California. Built in 1958, the property sits on a 13,200 square foot parcel and includes approximately 8,076 square feet of rentable space.The unit mix consists of ten one-bedroom/one-bath units and four two-bedroom/one-bath units, offering an efficient layout that appeals to a wide tenant base. The garden-style design allows for easy management and has historically supported strong occupancy. The property is ideally located between Historic Downtown Campbell and Santana Row, with convenient access to dining, retail, and entertainment. It is also within 35 miles of major tech employers, including Adobe, eBay, PayPal, Zoom, Western Digital, and Nutanix. The location also offers excellent connectivity via Highways 280, 880, and 17, further supporting strong tenant demand.
-
2026-04-13$3,700,000 Active 843-char remark
Show marketing remark (843 chars)
3047 David Avenue, a 14-unit multifamily property in San Jose, California. Built in 1958, the property sits on a 13,200 square foot parcel and includes approximately 8,076 square feet of rentable space.The unit mix consists of ten one-bedroom/one-bath units and four two-bedroom/one-bath units, offering an efficient layout that appeals to a wide tenant base. The garden-style design allows for easy management and has historically supported strong occupancy. The property is ideally located between Historic Downtown Campbell and Santana Row, with convenient access to dining, retail, and entertainment. It is also within 35 miles of major tech employers, including Adobe, eBay, PayPal, Zoom, Western Digital, and Nutanix. The location also offers excellent connectivity via Highways 280, 880, and 17, further supporting strong tenant demand.
-
2001-05-24soldstatus $643,000
-
1989-01-20soldstatus $835,000
ⓘ Source: listings_history table (triggers on properties + properties_extension) + one-shot
backfill from property_details.listing_events for pre-trigger history.
Tax reassessment forecast CA · Resets to sale price
- Current annual tax
- $45,082 · $3,757/mo
- Projected year-2 tax
- $45,082 · $3,757/mo
- Expected delta
- $0/yr ($0/mo · 0.0%)
ⓘ Screening estimate from a state-policy table — verify with the county assessor before closing.
Climate risk First Street
- Flood 1/10 Low FEMA zone D · 0% chance over 30 yrs
- Wildfire 1/10 Low
- Heat 4/10 Moderate 7 d/yr ≥94°F today · 14 d/yr by 30 yrs out
- Wind 1/10 Low
- Air quality 9/10 Extreme 17 unhealthy d/yr today · 17 by 30 yrs out
Nearby sold comps map
Loading sold comps map…
Walkable amenities ~0.75 mi
Loading nearby amenities…
Taxation est. · year 1
- Rental income
- $445,116
- − Mortgage interest
- −$202,776
- − Property taxes
- −$45,082
- − Insurance
- −$18,100
- − Repairs & maintenance
- −$35,609
- − Management
- −$35,609
- − Depreciation
- −$105,309
- Taxable income
- $2,630
- Est. tax owed @ 24.0%
- −$631
- After-tax cash flow
- $60,025/yr
For passive investors: Depreciation is non-cash, so a rental often shows a tax loss while cash-flowing — sheltering income. Rental losses are passive: they offset passive income freely, and up to $25,000/yr can offset ordinary (W-2) income if you actively participate and your MAGI is under $100k (phasing out to $0 by $150k); unused losses carry forward. On sale, claimed depreciation is recaptured at up to 25%, and gains may owe capital-gains tax (a 1031 exchange can defer both). Figures are a year-1 estimate at your 24.0% rate — not tax advice; consult a CPA.
Schools (NCES district)
- District
- Campbell Union
- NCES district ID
- 0607200
- Math proficiency
- 51% ▲ 2.00%
- Reading proficiency
- 58% ▲ 3.00%
- Median HH income
- $81,299
- Composite
- 51.32/100
- National rank
- #3717
- State rank
- #293 of 1400 in CA
Livability — San Jose
- Score
- 78/100
- State rank
- #68
- US rank
- #2559
Category grades
Schools grade is shown separately in the Schools card above.
Census & demographics
- Census place
- San Jose, CA
- County
- Santa Clara County · 1,806,974 people
- City population
- 954,479
- Metro
- San Jose-Sunnyvale-Santa Clara, CA
- Population (ZIP)
- 33,165
- Household income
- $131,152
- Rent vs Own
- Severe rent burden
- 1774.0
Population outlook (Santa Clara County) Hauer SSP2
- Today (2025)
- 2,179,074 people
- By 2030
- 2,301,297 · +5.6%
- By 2040
- 2,528,195 · +16.0%
- By 2050
- 2,712,135 · +24.5%
- By 2075
- 2,998,701 · +37.6%
- By 2100
- 2,931,429 · +34.5%
Race, ethnicity, and origin ACS 2023
- Neighborhood character
- Highly diverse neighborhood (Simpson 0.71)
- Race & ethnicity
- White 38% Hispanic / Latino 30% Asian 22% Two or more races 14% Black 3% Native American 1%
- Hispanic origin (detail)
- Mexican 25%
- Common ancestry
- Italian 2% Lithuanian 2% Romanian 2%
- Foreign-born
- 34% · Canada, China, Vietnam
- Languages at home
- 53% English-only · Spanish 22% Other Indo-European 6% Chinese 5%
Political lean MEDSL · Santa Clara
- 2024 margin
- Solid D (+40.0) · D 68.1% · R 28.1% · Other 3.8%
- 2008→2024 swing
- -0.9pp no change · 2008: 40.9pp · 2024: 40.0pp
- All cycles
- 2024: D+40.0 2020: D+47.4 2016: D+52.5 2012: D+42.1 2008: D+40.9
Not yet ingested
- Civics
- —
Market trends
- HPI YoY
- ▼ -1116.22%
- Current HPI
- 381.4337
- Rent YoY
- ▲ 2.88%
- Metro
- San Jose-Sunnyvale-Santa Clara, CA
- State GDP YoY
- ▲ 3.21%
- F500 in state
- 116
Industry mix (Fortune 500 HQ in CA)
| Industry | F500 HQs | Revenue |
|---|---|---|
| Technology | 27 | $1,492B |
|
||
| Financial Services | 3 | $174B |
|
||
| Retail | 3 | $44B |
|
||
| Insurance | 3 | $26B |
|
||
| Media / Entertainment | 2 | $115B |
|
||
| Pharmaceuticals / Biotech | 2 | $62B |
|
||
Price history
+343.1% since first listed5 events — show timeline
- 2026-04-13 Listing Removed — bridgeMLS, Bay East AOR, or Contra Costa AOR
- 2026-04-13 Listed $3,700,000 MLSListings
- 2026-04-13 Listed $3,700,000 bridgeMLS, Bay East AOR, or Contra Costa AOR
- 2001-05-24 Sold (Public Records) $643,000 Public Records
- 1989-01-20 Sold (Public Records) $835,000 Public Records
Property tax history
+5.0%/yrLatest (2025): $45,082 · +3.3% YoY. Source: county tax records.
Cash-flow waterfall
monthlySold comps — $/sqft
last 12 mo · ≤1 miLoading sold comps…