4117 U.s. 4 · Fort Ann, NY
Flood risk 1/10 · Minimal
- FEMA flood zone
- X
- Chance of flooding over 30 yrs
- 0.0%
- Est. flood insurance / yr
- $473 – $860
Fire risk 1/10 · Minimal
- Est. fire insurance / yr
- $691 – $1,283
Heat risk 3/10 · Minor
- Hot days now (above 95°F)
- 7 days/yr
- Hot days in 30 yrs
- 16 days/yr
Wind risk 2/10 · Minimal
- Chance of severe wind over 30 yrs
- 3.0%
Air-quality risk 2/10 · Minimal
- Unhealthy air days now
- 0 days/yr
- Unhealthy air days in 30 yrs
- 1 days/yr
Risk factors via First Street. Map © Google.
Why this score? — see what drove the B+ grade
The composite is a weighted blend of 9 inputs, each scored 0–100. Each bar is that input's sub-score; the figure is the points it added to the 100-point composite (weight × sub-score).
- Cash flow +30.0/30.0
- 1% rule +10.0/10.0
- DSCR +10.0/10.0
- Appreciation +10.0/10.0
- ARV discount +7.5/15.0
- Schools +3.7/10.0
- Livability +3.3/5.0
- Rent growth +2.5/5.0
- Condition / age +1.0/5.0
$75,500
🖨 Deal sheet 📄 Offer letter ✓ Due diligence
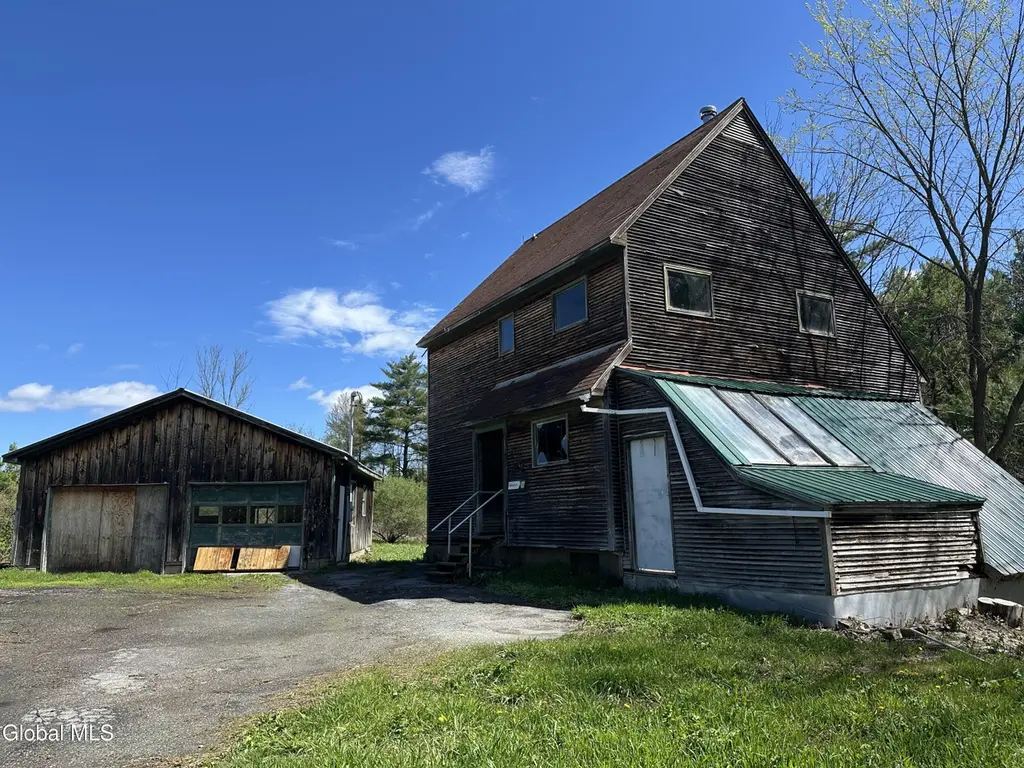
Listing remarks
This rural secluded Fannie Mae Homepath property sits on almost 5 acres with a long driveway which features 3 spacious bedrooms, 1.5 bathrooms, laundry room, galley kitchen, bonus room, full walk-up attic, rear deck, large 2 car detached garage and much more!! EZ 2C anytime!!
Key facts
- Galley kitchen
- Almost 5 acres
- Long driveway
Tags
Property features AI
Exterior
- Parking: Detached garage; Driveway parking; Stone parking surface; Total parking for 12 vehicles; 2-car garage
- Utilities: 150 Amp electric service; Septic tank sewer
- Home design: Single-family residence; Property listed as fixer condition
- Construction: Built with drywall and wood siding; Block foundation; Metal and asphalt roofing
- Exterior features: Deck; Porch; Other on-site garage structures
Interior
- Kitchen: Kitchen on the first level
- Bedrooms: Three bedrooms on the second level
- Flooring: Wood flooring
- Bathrooms: One full bathroom on the second level; One half bathroom on the first level
- Interior features: Total of 8 rooms; Full, unfinished basement; Secluded lot setting
- Laundry & utility: Main-level laundry room
Neighborhood map
What this means for you Summary
Snapshot
- This is a 3-bed/1.5-bath single-family listed at $76k. Condition is rated poor.
Deal economics
- At list price, monthly cash flow is $650 ($8k/yr) — positive.
- The deal already cash-flows at list — no discount required.
- Meets the 1% rule at list price ($1k rent vs $76k).
Location & tenants
- Location reads 66/100 on livability (#645 in NY) — a middle-class / working-renter tenant base. Strengths: housing A+, employment A, cost of living A; Watch: crime F, amenities F, commute F.
- Hudson Falls Central School District (suburban): math 39% / reading 47% proficiency, ranked #486 of 590 in NY (top 82%) — families likely to look elsewhere, expect single-tenant / working-renter base with shorter leases.
- Zoned schools: Hudson Falls High School (math 87% / reading 77%, grade A, #452 of 1,100 statewide, top 44%, 694 students, 38% FRL) — zoned schools at 38% FRL track the district average.
- Zoned-school proficiency averages 82% at this address vs 43% district-wide (+39 pts) — the actual schools serving this property are materially stronger than the Hudson Falls Central School District average implies; a family-tenant draw the district grade alone would hide.
- Market conditions: 55 active listings in the ZIP; 106 units permitted in Washington County in 2024 (0 in 5+ unit buildings).
Forward outlook
- In year one you build about $8k of equity ($522 loan paydown + $8k appreciation (10.0% local appreciation)).
- Washington County population projected at -20% by 2050 — secular population decline; favor cash flow + early exit over multi-decade hold.
- At projected returns (10.0% appreciation + 3.0% rent growth), your $21k cash investment doubles in ~2 years — after that, you're playing with house money.
- By year 5, paydown + projected appreciation supports a ~$38k cash-out refi (75% LTV) — recoverable capital for the next deal without selling this one.
Negotiation context
- Only 13 days on market — expect competitive offers; lowballing is unlikely to land.
Questions for the listing agent
- Have any recent inspections been done? Can we get a copy of the seller's disclosures and any deferred-maintenance estimates?
- Built in 1976 — when were the roof, HVAC, electrical panel, plumbing, and water heater last replaced?
- Is there a deadline driving the sale (1031 exchange, divorce, estate, relocation)? That informs how much negotiation room exists.
- Schools are A-rated — typically a magnet for longer-tenancy family renters. What's the average tenant stay here, and is there a school-zone premium baked into asking?
- Crime grade is F in this area — have there been break-ins, vandalism, or insurance claims at this property in the last 3 years? What carrier currently insures it and at what premium?
- What's the average days-on-market for RENTAL listings here right now (not sales)? A rising rental-DOM trend means longer vacancies and softer asking-rent achievability than the comps imply.
- What's the recent tenant-quality profile in this submarket — average credit score on applications, eviction rate, late-payment / NSF rate, and stable-employment percentage? A property-management company in the area should have these aggregated.
- How much new for-sale + rental construction is in the pipeline within 1–3 miles? Heavy new supply typically softens prices + rents 12–24 months out; constrained supply supports both.
Investment metrics
- 1% rule
- 1.96% ✓
- Cap rate
- 16.62%
- Cash-on-cash
- 36.90%
- DSCR
- 2.64
- GRM
- 4.2
CMA / ARV
No comps found within radius.
Projected returns pro-forma
10.0% appreciation · 3.0% rent growth · sell at horizon
- IRR
- 52.7%
- Equity multiple
- 4.90×
- Total profit
- $82,539
- Equity at exit
- $68,016
- IRR
- 46.3%
- Equity multiple
- 10.96×
- Total profit
- $210,553
- Equity at exit
- $146,680
Cash invested: $21,140 (down + closing). Projections, not guarantees.
Landlord ↔ Tenant lean methodology
- Overall (STATE)
- 15 Strongly Tenant-Friendly
- State New York
- 15 Strongly Tenant-Friendly · D+10
- County
- — inherits STATE
- City
- — inherits STATE
ZIP-level market 12839
- Home prices YoY
- 8.5%
- Active inventory
- 55
- Price-to-rent
- 4.2×
Monthly cashflow live
- Estimated rent
- $1,483 medium interval (Pro) →
- Mortgage (P&I)
- −$396
- Tax est. 1.5%
- −$94 /mo · $1,132/yr
- Insurance
- −$31
- HOA
- −$0
- Vacancy / Maint / Mgmt
- −$311
- Net cashflow
- $650
Break-even live
UW: 25.0% down · 7.5% · 30yr · 1.5% tax · 5.0% vac · 8.0% maint · 8.0% mgmt
Financing live
Cash to close
- Down payment
- $18,875
- Closing costs
- $2,265
- Reserves months
- —
- Total cash needed
- —
Loan-product check · same deal, 3 products live
Conventional
25% down · 7.5% · 30yr
- Down + closing
- —
- Monthly P&I
- —
- Monthly cashflow
- —
- DSCR
- —
- Eligible?
- —
Personal DTI + credit; lowest rate.
DSCR
20% down · 8.5% · 30yr
- Down + closing
- —
- Monthly P&I
- —
- Monthly cashflow
- —
- DSCR
- —
- Eligible?
- —
No personal income docs; deal must DSCR.
Hard money
10% down · 12.0% · 12mo
- Down + closing
- —
- Monthly P&I
- —
- Monthly cashflow
- —
- DSCR
- —
- Eligible?
- —
Short-term bridge; refi at stabilization.
Listing history 6 events
-
2026-06-03status $75,500 Pending 13 DOM
-
2026-06-02days on market $75,500 Active 13 DOM
-
2026-06-01days on market $75,500 Active 12 DOM
-
2026-05-31days on market $75,500 Active 11 DOM
-
2026-05-31days on market $75,500 Active 10 DOM
-
2026-05-19$75,500 Active
ⓘ Source: listings_history table (triggers on properties + properties_extension) + one-shot
backfill from property_details.listing_events for pre-trigger history.
Climate risk First Street
- Flood 1/10 Low FEMA zone X · 0% chance over 30 yrs
- Wildfire 1/10 Low
- Heat 3/10 Moderate 7 d/yr ≥95°F today · 16 d/yr by 30 yrs out
- Wind 2/10 Low 3% chance of damaging wind over 30 yrs
- Air quality 2/10 Low 0 unhealthy d/yr today · 1 by 30 yrs out
Nearby sold comps map
Loading sold comps map…
Walkable amenities ~0.75 mi
Loading nearby amenities…
Taxation est. · year 1
- Rental income
- $17,799
- − Mortgage interest
- −$4,229
- − Property taxes
- −$1,132
- − Insurance
- −$378
- − Repairs & maintenance
- −$1,424
- − Management
- −$1,424
- − Depreciation
- −$2,196
- Taxable income
- $7,015
- Est. tax owed @ 24.0%
- −$1,684
- After-tax cash flow
- $6,116/yr
For passive investors: Depreciation is non-cash, so a rental often shows a tax loss while cash-flowing — sheltering income. Rental losses are passive: they offset passive income freely, and up to $25,000/yr can offset ordinary (W-2) income if you actively participate and your MAGI is under $100k (phasing out to $0 by $150k); unused losses carry forward. On sale, claimed depreciation is recaptured at up to 25%, and gains may owe capital-gains tax (a 1031 exchange can defer both). Figures are a year-1 estimate at your 24.0% rate — not tax advice; consult a CPA.
Condition & rehab AI · 13 photos
This rural property requires extensive repairs and updates to its exterior, interior, and systems, significantly impacting its value. Landscaping and fencing improvements can enhance curb appeal and security, while new siding, windows, and roof would greatly improve its structural integrity and energy efficiency.
Repairs flagged
- Major siding — Severe weathering and damage
- Major windows — Missing or broken windows
- Major roof — Exposed rafters and missing shingles
- Major flooring — Worn and damaged wooden floors
- Major interior walls — Peeling paint and exposed insulation
- Major HVAC — Exposed components and electrical issues
Value-add opportunities
- Both Landscaping and fencing — Improves curb appeal and security
- Both New siding and windows — Enhances aesthetics and energy efficiency
- Both New roof — Improves structural integrity and energy efficiency
- Both Flooring replacement — Enhances comfort and durability
- Both Interior wall repairs and paint — Enhances aesthetics and energy efficiency
- Both HVAC system replacement — Improves comfort and energy efficiency
Renovation cost estimate screening
| Repair item | Severity | Est. cost |
|---|---|---|
| siding · Severe weathering and damage | Major | $15,000–50,000 |
| windows · Missing or broken windows | Major | $15,000–50,000 |
| roof · Exposed rafters and missing shingles | Major | $15,000–50,000 |
| flooring · Worn and damaged wooden floors | Major | $15,000–50,000 |
| interior walls · Peeling paint and exposed insulation | Major | $15,000–50,000 |
| HVAC · Exposed components and electrical issues | Major | $15,000–50,000 |
| Total estimated repair cost · 6 items | $90,000–300,000 |
Value-add ROI direction
- Both Landscaping and fencing — Improves curb appeal and security ↑
- Both New siding and windows — Enhances aesthetics and energy efficiency ↑
- Both New roof — Improves structural integrity and energy efficiency ↑
- Both Flooring replacement — Enhances comfort and durability ↑
- Both Interior wall repairs and paint — Enhances aesthetics and energy efficiency ↑
- Both HVAC system replacement — Improves comfort and energy efficiency ↑
ⓘ Cost ranges are severity-bucket heuristics (US national rule-of-thumb). Get contractor quotes + a written scope before underwriting a rehab budget.
Schools (NCES district)
- District
- Hudson Falls Central School District
- NCES district ID
- 3614970
- Math proficiency
- 39% ▼ -8.00%
- Reading proficiency
- 47% ▲ 6.00%
- Median HH income
- $46,019
- Composite
- 36.57/100
- National rank
- #4635
- State rank
- #486 of 590 in NY
Livability — Fort Ann
- Score
- 66/100
- State rank
- #645
- US rank
- #12084
Category grades
Schools grade is shown separately in the Schools card above.
Census & demographics
- Population (ZIP)
- 13,618
Population outlook (Washington County) Hauer SSP2
- Today (2025)
- 59,576 people
- By 2030
- 57,618 · -3.3%
- By 2040
- 52,751 · -11.5%
- By 2050
- 47,514 · -20.2%
- By 2075
- 35,690 · -40.1%
- By 2100
- 24,807 · -58.4%
Race, ethnicity, and origin ACS 2023
- Neighborhood character
- Predominantly White (89%)
- Race & ethnicity
- White 89% Hispanic / Latino 4% Two or more races 4%
- Common ancestry
- Lithuanian 8% Slovak 5% Estonian 3%
- Foreign-born
- 5% · Canada, Guatemala
- Languages at home
- 92% English-only · Spanish 4% Other Indo-European 2% German/W. Germanic 2%
Political lean MEDSL · Washington
- 2024 margin
- Strong R (+21.2) · D 39.4% · R 60.6%
- 2008→2024 swing
- -22.0pp toward R · 2008: 0.8pp · 2024: -21.2pp
- All cycles
- 2024: R+21.2 2020: R+15.6 2016: R+20.2 2012: D+1.6 2008: D+0.8
Not yet ingested
- Civics
- —
Market trends
- HPI YoY
- ▲ 25.92%
- Current HPI
- 331.6315
- Rent YoY
- —
- Metro
- —
- State GDP YoY
- ▲ 2.60%
- F500 in state
- 92
Industry mix (Fortune 500 HQ in NY)
| Industry | F500 HQs | Revenue |
|---|---|---|
| Financial Services | 10 | $950B |
|
||
| Consumer Goods | 9 | $162B |
|
||
| Insurance | 4 | $225B |
|
||
| Telecommunications | 2 | $144B |
|
||
| Pharmaceuticals | 2 | $112B |
|
||
| Media / Entertainment | 2 | $69B |
|
||
Price history
1 event — show timeline
- 2026-05-19 Listed $75,500 Global MLS
Cash-flow waterfall
monthlySold comps — $/sqft
last 12 mo · ≤1 miLoading sold comps…