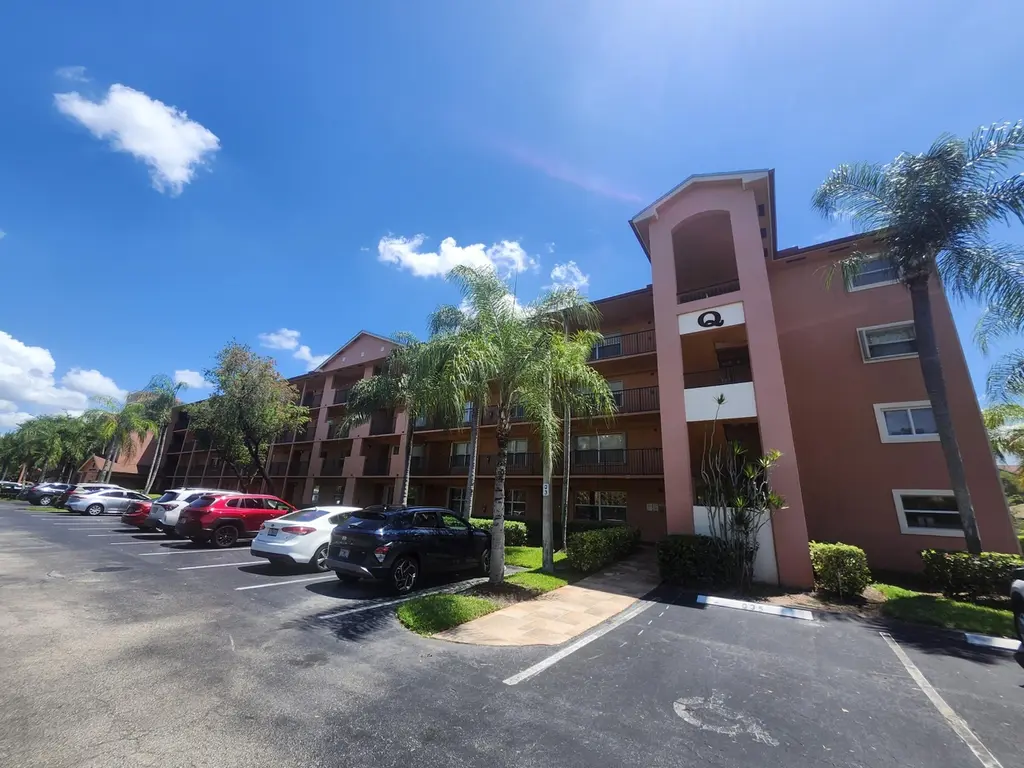
601 SW 142nd Ave SW Unit 413 Q · Pembroke Pines, FL
Flood risk 1/10 · Minimal
- FEMA flood zone
- X (unshaded)
- Chance of flooding over 30 yrs
- 0.0%
- Est. flood insurance / yr
- $507 – $1,088
Fire risk 1/10 · Minimal
- Est. fire insurance / yr
- $947 – $1,759
Heat risk 10/10 · Severe
- Hot days now (above 106°F)
- 7 days/yr
- Hot days in 30 yrs
- 26 days/yr
Wind risk 10/10 · Severe
- Chance of severe wind over 30 yrs
- 99.0%
Air-quality risk 2/10 · Minimal
- Unhealthy air days now
- 2 days/yr
- Unhealthy air days in 30 yrs
- 2 days/yr
Risk factors via First Street. Map © Google.
Why this score? — see what drove the C- grade
The composite is a weighted blend of 9 inputs, each scored 0–100. Each bar is that input's sub-score; the figure is the points it added to the 100-point composite (weight × sub-score).
- Cash flow +15.2/30.0
- 1% rule +8.3/10.0
- ARV discount +7.5/15.0
- DSCR +4.7/10.0
- Livability +4.2/5.0
- Schools +4.1/10.0
- Appreciation +4.0/10.0
- Rent growth +2.5/5.0
- Condition / age +2.5/5.0
$179,900
🖨 Deal sheet 📄 Offer letter ✓ Due diligence
Listing remarks
CENTURY VILLAGE---"PLYMOUTH"---55 AND OVER---------- GOLF COURSE COMMUNITY WITH 24 HOUR SECURITY--------2 BEDROOMS WITH WALK IN CLOSET (11X5)------2 BATHS-----------JASMINE MODEL---------4TH FLOOR----------ALL TILE----------EAT IN KITCHEN WITH ALL APPLIANCES-----PANTRY-----BUILDING HAS ELEVATOR------WASHER AND DRYER IN UNIT------STEPS TO POOL-------ENJOY ALL OF THE AMENITIES CENTURY VILLAGE HAS TO OFFER----INDOOR OUTDOOR POOLS----FITNESS CENTER----ACTIVITIES----TENNIS-----PICKLEBALL----BILLIARDS------ENTERTAINMENT SHOWS AND MORE-----LOCATED JUST MINUTES FROM MAJOR ROADS------SHOPPING-----RESTAURANTS------PARKS------MALLS------ENTERTAINMENT VENUES-------CASINOS AND THE BEACHE
Key facts
- Eat in kitchen
- Walk in closet
- 24 hour security
Tags
Property features AI
Finance
- Financial info: Community of approximately 7,000 units; Pets not allowed
- HOA & community: Association (Plymouth / Century Village CVP) with monthly fee; HOA fee includes cable, internet, grounds and structure maintenance, security, sewer, trash, water, common areas, elevator, legal/accounting, reserves, roof repairs, recreation facility, and pool service; Community amenities include clubhouse, fitness center, indoor pool, heated pool, spa/hot tub, outdoor pool, tennis courts, pickleball courts, shuffleboard, jogging paths, park, billiard room, cafe/restaurant, library, manager on site, maintenance, trash chute, courtesy bus, sidewalks, street lights, gated security, and recreation facilities; Manager on site and on-site management phone available
Exterior
- Parking: Assigned parking and guest parking (1 parking space total)
- Security: Gated community with guard; Security guard; Security fence and gate; Smoke detectors
- Utilities: Public water; Public sewer; Cable available; Electricity available; Phone available; Sewer connected; Water connected; Underground utilities
- Home design: Condominium; One-level living; Located on entry level 4; Faces west; Resale property
- Construction: CBS construction; Built as part of a 4-story building; Other roof
- Exterior features: Terrace; Asphalt/paved roads; Private and public maintained roads; Not waterfront
Interior
- Kitchen: Dishwasher; Disposal; Electric range; Microwave; Refrigerator; Electric water heater
- Bedrooms: 2 bedrooms on the main level
- Flooring: Tile
- Bathrooms: 2 full bathrooms on the main level
- Heating & cooling: Central heating (electric); Central air; Ceiling fan(s)
- Interior features: Entrance foyer; Walk-in closets; Split bedroom layout; Custom mirrors; Blinds and sliding/single-hung metal windows
- Laundry & utility: In-unit laundry (see remarks)
Neighborhood map
What this means for you Summary
Snapshot
- This is a 2-bed/2.0-bath condo listed at $180k.
Deal economics
- At list price, monthly cash flow is $64 ($769/yr) — positive.
- The deal already cash-flows at list — no discount required.
- Meets the 1% rule at list price ($2k rent vs $180k).
- Recommended offer: $175k (3.0% below list) — sets the bar for market timing.
- Cap rate 6.7% vs local median 4.0% in Pembroke Pines — top-decile yield for the area; either an underpriced asset or a hidden risk that comps aren't pricing in. Stress-test before assuming the spread holds.
Location & tenants
- Location reads 83/100 on livability (#54 in FL, #933 nationally) — a professional / high-income tenant draw. Strengths: housing A+, health & safety A+, crime A-; Watch: amenities D+, cost of living D+.
- Broward (suburban): math 42% / reading 53% proficiency, ranked #46 of 73 in FL (top 63%) — families likely to look elsewhere, expect single-tenant / working-renter base with shorter leases.
- Zoned schools: Lakeside Elementary School (math 53% / reading 63%, grade C+, #751 of 2,144 statewide, top 36%, 631 students, 57% FRL); Walter C. Young Middle School (math 49% / reading 62%, grade B-, #178 of 571 statewide, top 31%, 873 students, 56% FRL); Charles W Flanagan High School (math 29% / reading 50%, grade F, #304 of 667 statewide, top 47%, 2,475 students, 57% FRL).
- Market conditions: Rents soft (-0.2%/yr); 543 active listings in the ZIP; 40 comparable units currently listed for rent nearby; rentals at typical pace (median 18d on market — plan ~3-4 weeks tenant-placement turnaround); solid renter incomes; 2,111 units permitted in Broward County in 2024 (1,265 in 5+ unit buildings).
- This rent runs 37% of the median local income ($77k/yr) — at the standard rent-burdened threshold; future hikes will face affordability resistance.
Forward outlook
- Local home prices are declining (-2.0%/yr); year-one equity from $1k of loan paydown is wiped out by about $4k of value loss. Plan a longer hold.
- Broward County population projected at +34% by 2050 — long-run rental-demand tailwind backs the buy-and-hold thesis.
Negotiation context
- It's been on market 51 days — a 3% lower offer ($175k) is reasonable based on typical stale-listing flexibility.
Risks & watch-outs
- Watch-outs: HOA is 31% of rent.
- Climate carrying-cost: severe wind risk, 99% chance of damaging wind over 30y; extreme-heat days projected 7→26/yr by 2055 (HVAC capex compounding) — expect insurance premiums to compound above CPI over the hold.
Questions for the listing agent
- It's been on market 51 days. Have you received any prior offers? Is the seller open to a 3% concession, seller financing, or rate buy-down credit?
- What does the HOA fee cover, when was the last increase, and are there any pending special assessments or reserve-fund shortfalls?
- Any open or pending special assessments — roof, HVAC, plumbing, elevator, façade? What's the per-unit balance and payoff schedule, and is the seller paying it off at close or rolling it to the buyer?
- Is there a deadline driving the sale (1031 exchange, divorce, estate, relocation)? That informs how much negotiation room exists.
- Schools are A-rated — typically a magnet for longer-tenancy family renters. What's the average tenant stay here, and is there a school-zone premium baked into asking?
- What's the average days-on-market for RENTAL listings here right now (not sales)? A rising rental-DOM trend means longer vacancies and softer asking-rent achievability than the comps imply.
- What's the recent tenant-quality profile in this submarket — average credit score on applications, eviction rate, late-payment / NSF rate, and stable-employment percentage? A property-management company in the area should have these aggregated.
- How much new apartment / multifamily construction is in the pipeline within 1–3 miles? Heavy new supply (>2% of stock underway) typically softens rents 12–24 months out; light construction supports rent growth.
Investment metrics
- 1% rule
- 1.33% ✓
- Cap rate
- 6.72%
- Cash-on-cash
- 1.53%
- DSCR
- 1.07
- GRM
- 6.3
CMA / ARV
No comps found within radius.
Projected returns pro-forma
-2.01% appreciation · 0.0% rent growth · sell at horizon
- IRR
- -12.6%
- Equity multiple
- 0.52×
- Total profit
- $-24,146
- Equity at exit
- $34,836
- IRR
- -10.8%
- Equity multiple
- 0.31×
- Total profit
- $-34,523
- Equity at exit
- $29,672
Cash invested: $50,372 (down + closing). Projections, not guarantees.
Landlord ↔ Tenant lean methodology
- Overall (STATE)
- 87 Strongly Landlord-Friendly
- State Florida
- 87 Strongly Landlord-Friendly · R+3
- County
- — inherits STATE
- City
- — inherits STATE
ZIP-level market 33027
- Home prices YoY
- -0.6%
- Rents YoY
- -0.2%
- Active inventory
- 543
- Price-to-rent
- 6.3×
Monthly cashflow live
- Estimated rent
- $2,390 high interval (Pro) →
- Mortgage (P&I)
- −$943
- Tax from tax record
- −$64 /mo · $771/yr
- Insurance
- −$75
- HOA
- −$741
- Vacancy / Maint / Mgmt
- −$502
- Net cashflow
- $64
Break-even live
UW: 25.0% down · 7.5% · 30yr · 1.5% tax · 5.0% vac · 8.0% maint · 8.0% mgmt
Financing live
Cash to close
- Down payment
- $44,975
- Closing costs
- $5,397
- Reserves months
- —
- Total cash needed
- —
Loan-product check · same deal, 3 products live
Conventional
25% down · 7.5% · 30yr
- Down + closing
- —
- Monthly P&I
- —
- Monthly cashflow
- —
- DSCR
- —
- Eligible?
- —
Personal DTI + credit; lowest rate.
DSCR
20% down · 8.5% · 30yr
- Down + closing
- —
- Monthly P&I
- —
- Monthly cashflow
- —
- DSCR
- —
- Eligible?
- —
No personal income docs; deal must DSCR.
Hard money
10% down · 12.0% · 12mo
- Down + closing
- —
- Monthly P&I
- —
- Monthly cashflow
- —
- DSCR
- —
- Eligible?
- —
Short-term bridge; refi at stabilization.
Rent comps 40 comps
| Address | Beds | Baths | Sqft | Rent | $/sqft | DOM | Units | Dist |
|---|---|---|---|---|---|---|---|---|
| 500 SW 145th Ave Pembroke Pines, FL | 1.0–3.0 | 1.0–2.0 | 1044 | $2,982 | $2.86 | 1d | 21 | 0.10mi |
| 701 SW 141st Ave Unit 110R Pembroke Pines, FL | 2.0 | 1.5 | 1032 | $2,200 | $2.13 | 24d | 1 | 0.14mi |
| 701 SW 141st Ave Unit 110R Pembroke Pines, FL | 2.0 | 1.5 | 1032 | $2,200 | $2.13 | 7d | 1 | 0.14mi |
| 701 SW 141st Ave Unit 405R Pembroke Pines, FL | 2.0 | 1.5 | 1032 | $2,000 | $1.94 | 24d | 1 | 0.14mi |
| 943 SW 143rd Ter #2109 Pembroke Pines, FL | 3.0 | 2.5 | 1390 | $3,050 | $2.19 | 20d | 1 | 0.18mi |
| 550 SW 138th Ave Unit 206K Pembroke Pines, FL | 2.0 | 2.0 | 1207 | $2,400 | $1.99 | 15d | 1 | 0.20mi |
| 850 SW 138th Ave Pembroke Pines, FL | 1.0–2.0 | 1.5–2.0 | 1120 | $2,250 | $2.01 | 22d | 2 | 0.21mi |
| 962 SW 143rd Ave #2207 Pembroke Pines, FL | 3.0 | 2.5 | 1390 | $3,000 | $2.16 | 24d | 1 | 0.22mi |
| 962 SW 143rd Ave #2207 Pembroke Pines, FL | 3.0 | 2.5 | 1390 | $3,000 | $2.16 | 7d | 1 | 0.22mi |
| 915 SW 143rd Ave #2008 Pembroke Pines, FL | 2.0 | 2.5 | 1100 | $2,400 | $2.18 | 3d | 1 | 0.22mi |
| 1009 SW 144th Ave #2701 Pembroke Pines, FL | 3.0 | 2.5 | 1396 | $2,850 | $2.04 | 24d | 1 | 0.25mi |
| 1062 SW 143rd Ave Pembroke Pines, FL | 3.0 | 2.5 | 1425 | $3,000 | $2.11 | 24d | 1 | 0.28mi |
| 900 SW 142nd Ave Pembroke Pines, FL | 2.0 | 2.0 | 1207 | $2,200 | $1.82 | 1d | 2 | 0.32mi |
| 900 SW 142nd Ave Unit 202L Pembroke Pines, FL | 2.0 | 2.0 | 1207 | $2,300 | $1.91 | 7d | 1 | 0.32mi |
| 1001 SW 141st Ave Unit 311K Pembroke Pines, FL | 1.0 | 1.5 | 1056 | $1,900 | $1.80 | 4d | 1 | 0.35mi |
| 301 SW 135th Ave Unit 415C Pembroke Pines, FL | 1.0 | 1.5 | 811 | $1,650 | $2.03 | 22d | 1 | 0.36mi |
| 551 SW 135th Ave Unit 405B Pembroke Pines, FL | 2.0 | 1.5 | 953 | $1,700 | $1.78 | 24d | 1 | 0.37mi |
| 13455 SW 3rd St Unit 309S Pembroke Pines, FL | 1.0 | 1.5 | 811 | $1,700 | $2.10 | 24d | 1 | 0.43mi |
| 13500 SW 1st St Pembroke Pines, FL | 2.0 | 1.5 | 954 | $1,750 | $1.83 | 5d | 2 | 0.44mi |
| 13500 SW 1st St Pembroke Pines, FL | 2.0 | 1.5 | 954 | $1,750 | $1.83 | 24d | 2 | 0.44mi |
| 13701 SW 12th St Apt 103A Pembroke Pines, FL | 2.0 | 2.0 | 1207 | $2,500 | $2.07 | 3d | 1 | 0.47mi |
| 150 SW 134th Way Pembroke Pines, FL | 2.0 | 1.5–2.0 | 1060 | $1,800 | $1.70 | 24d | 2 | 0.47mi |
| 150 SW 134th Way Unit 314R Pembroke Pines, FL | 2.0 | 2.0 | 1166 | $1,900 | $1.63 | 7d | 1 | 0.48mi |
| 150 SW 134th Way Unit 314R Pembroke Pines, FL | 2.0 | 2.0 | 1166 | $1,900 | $1.63 | 15d | 1 | 0.48mi |
| 850 SW 133rd Ter Pembroke Pines, FL | 2.0 | 1.5 | 953 | $1,938 | $2.03 | 1d | 2 | 0.49mi |
| 850 SW 133rd Ter Pembroke Pines, FL | 2.0 | 1.5 | 953 | $1,938 | $2.03 | 20d | 2 | 0.49mi |
| 850 SW 133rd Ter Unit 106B Pembroke Pines, FL | 2.0 | 1.5 | 953 | $1,975 | $2.07 | 22d | 1 | 0.49mi |
| 850 SW 133rd Ter Unit B406 Pembroke Pines, FL | 2.0 | 1.5 | 953 | $1,900 | $1.99 | 24d | 1 | 0.49mi |
| 13455 SW 9th Ct Pembroke Pines, FL | 1.0 | 1.5 | 811 | $1,685 | $2.08 | 22d | 2 | 0.50mi |
| 400 SW 134th Way Pembroke Pines, FL | 1.0–2.0 | 1.5–2.0 | 927 | $2,000 | $2.16 | 24d | 3 | 0.51mi |
| 400 SW 134th Way Pembroke Pines, FL | 1.0–2.0 | 1.5–2.0 | 927 | $2,000 | $2.16 | 10d | 2 | 0.51mi |
| 400 SW 134th Way Unit 302F Pembroke Pines, FL | 2.0 | 2.0 | 1044 | $2,000 | $1.92 | 7d | 1 | 0.51mi |
| 1351 SW 141st Ave Unit 213G Pembroke Pines, FL | 2.0 | 2.0 | 1207 | $1,800 | $1.49 | 17d | 1 | 0.51mi |
| 801 SW 133rd Ter Unit 401K Pembroke Pines, FL | 1.0 | 1.0 | 960 | $1,850 | $1.93 | 24d | 1 | 0.54mi |
| 13250 SW 7th Ct Unit 402L Pembroke Pines, FL | 2.0 | 2.0 | 1044 | $1,750 | $1.68 | 2d | 1 | 0.54mi |
| 13250 SW 7th Ct Unit 402L Pembroke Pines, FL | 2.0 | 2.0 | 1044 | $1,750 | $1.68 | 15d | 1 | 0.54mi |
| 13651 NW 4th St Pembroke Pines, FL | 1.0–3.0 | 1.5–3.0 | 1187 | $3,190 | $2.69 | 2d | 15 | 0.55mi |
| 13355 SW 9th Ct Unit 317H Pembroke Pines, FL | 2.0 | 2.0 | 1044 | $1,975 | $1.89 | 5d | 1 | 0.56mi |
| 251 SW 134th Way Unit 210M Pembroke Pines, FL | 2.0 | 1.5 | 954 | $1,645 | $1.72 | 22d | 1 | 0.57mi |
| 251 SW 134th Way Pembroke Pines, FL | 1.0–2.0 | 1.5 | 882 | $1,645 | $1.86 | 7d | 2 | 0.57mi |
HOA detail condo
- Monthly dues
- $741 · $8,892/yr
- Likely covers
- poolgymsecurity
- Assessments
- None detected in remarks — confirm with the listing agent.
Listing history 15 events
-
2026-06-18days on market $179,900 Active 51 DOM
-
2026-06-17days on market $179,900 Active 50 DOM
-
2026-06-16days on market $179,900 Active 49 DOM
-
2026-06-15days on market $179,900 Active 48 DOM
-
2026-06-13days on market $179,900 Active 46 DOM
-
2026-06-09days on market $179,900 Active 42 DOM
-
2026-06-08days on market $179,900 Active 41 DOM
-
2026-06-07days on market $179,900 Active 40 DOM
-
2026-06-04days on market $179,900 Active 37 DOM
-
2026-06-03days on market $179,900 Active 36 DOM
-
2026-06-02days on market $179,900 Active 35 DOM
-
2026-06-02price $179,900 Active 34 DOM
-
2026-06-01days on market $189,900 Active 34 DOM
-
2026-05-31days on market $189,900 Active 33 DOM
-
2026-04-28$189,900 Active
ⓘ Source: listings_history table (triggers on properties + properties_extension) + one-shot
backfill from property_details.listing_events for pre-trigger history.
Tax reassessment forecast FL · Resets to sale price
- Current annual tax
- $771 · $64/mo
- Projected year-2 tax
- $1,493 · $124/mo
- Expected delta
- +$722/yr (+$60/mo · 93.6%)
ⓘ Screening estimate from a state-policy table — verify with the county assessor before closing.
Climate risk First Street
- Flood 1/10 Low FEMA zone X (unshaded) · 0% chance over 30 yrs
- Wildfire 1/10 Low
- Heat 10/10 Extreme 7 d/yr ≥106°F today · 26 d/yr by 30 yrs out
- Wind 10/10 Extreme 99% chance of damaging wind over 30 yrs
- Air quality 2/10 Low 2 unhealthy d/yr today · 2 by 30 yrs out
Nearby sold comps map
Loading sold comps map…
Walkable amenities ~0.75 mi
Loading nearby amenities…
Taxation est. · year 1
- Rental income
- $28,675
- − Mortgage interest
- −$10,077
- − Property taxes
- −$771
- − Insurance
- −$900
- − Repairs & maintenance
- −$2,294
- − Management
- −$2,294
- − HOA
- −$8,892
- − Depreciation
- −$5,233
- Taxable loss
- −$1,786
- Est. tax savings @ 24.0%
- +$429
- After-tax cash flow
- $1,198/yr
For passive investors: Depreciation is non-cash, so a rental often shows a tax loss while cash-flowing — sheltering income. Rental losses are passive: they offset passive income freely, and up to $25,000/yr can offset ordinary (W-2) income if you actively participate and your MAGI is under $100k (phasing out to $0 by $150k); unused losses carry forward. On sale, claimed depreciation is recaptured at up to 25%, and gains may owe capital-gains tax (a 1031 exchange can defer both). Figures are a year-1 estimate at your 24.0% rate — not tax advice; consult a CPA.
Schools (NCES district)
- District
- Broward
- NCES district ID
- 1200180
- Math proficiency
- 42% ▼ -18.00%
- Reading proficiency
- 53% ▼ -5.00%
- Median HH income
- $52,139
- Composite
- 40.88/100
- National rank
- #3621
- State rank
- #46 of 73 in FL
Livability — Pembroke Pines
- Score
- 83/100
- State rank
- #54
- US rank
- #933
Category grades
Schools grade is shown separately in the Schools card above.
Census & demographics
- Census place
- Pembroke Pines, FL
- County
- Broward County · 1,963,430 people
- City population
- 180,224
- Metro
- Miami-Fort Lauderdale-Pompano Beach, FL
- Population (ZIP)
- 65,116
- Household income
- $76,561
- Rent vs Own
- Severe rent burden
- 1728.0
Population outlook (Broward County) Hauer SSP2
- Today (2025)
- 2,207,033 people
- By 2030
- 2,360,704 · +7.0%
- By 2040
- 2,661,208 · +20.6%
- By 2050
- 2,946,698 · +33.5%
- By 2075
- 3,602,273 · +63.2%
- By 2100
- 3,970,984 · +79.9%
Race, ethnicity, and origin ACS 2023
- Neighborhood character
- Diverse neighborhood (Simpson 0.65)
- Race & ethnicity
- Hispanic / Latino 52% Two or more races 23% Black 22% White 16% Asian 6%
- Hispanic origin (detail)
- Puerto Rican 6% Cuban 19% Dominican 3%
- Common ancestry
- Hispanic 6% Romanian 1% Scotch-Irish 1%
- Foreign-born
- 47% · Canada, Jamaica, Vietnam
- Languages at home
- 40% English-only · Spanish 47% French/Haitian/Cajun 5% Other Indo-European 2%
Political lean MEDSL · Broward
- 2024 margin
- D (+17.0) · D 58.0% · R 41.0%
- 2008→2024 swing
- -17.8pp toward R · 2008: 34.7pp · 2024: 17.0pp
- All cycles
- 2024: D+17.0 2020: D+29.8 2016: D+35.0 2012: D+34.9 2008: D+34.7
Not yet ingested
- Civics
- —
Market trends
- HPI YoY
- ▼ -2.01%
- Current HPI
- 359.5973
- Rent YoY
- ▼ -0.20%
- Metro
- Miami-Fort Lauderdale-Pompano Beach, FL
- State GDP YoY
- ▲ 3.28%
- F500 in state
- 36
Industry mix (Fortune 500 HQ in FL)
| Industry | F500 HQs | Revenue |
|---|---|---|
| Industrial Technology | 2 | $29B |
|
||
| Insurance | 2 | $17B |
|
||
| Retail | 1 | $60B |
|
||
| Technology Distribution | 1 | $58B |
|
||
| Homebuilding | 1 | $35B |
|
||
| Technology Manufacturing | 1 | $35B |
|
||
Price history
1 event — show timeline
- 2026-04-28 Listed $189,900 Beaches MLS
Property tax history
-0.8%/yrLatest (2025): $771 · +2.3% YoY. Source: county tax records.
Cash-flow waterfall
monthlySold comps — $/sqft
last 12 mo · ≤1 miLoading sold comps…