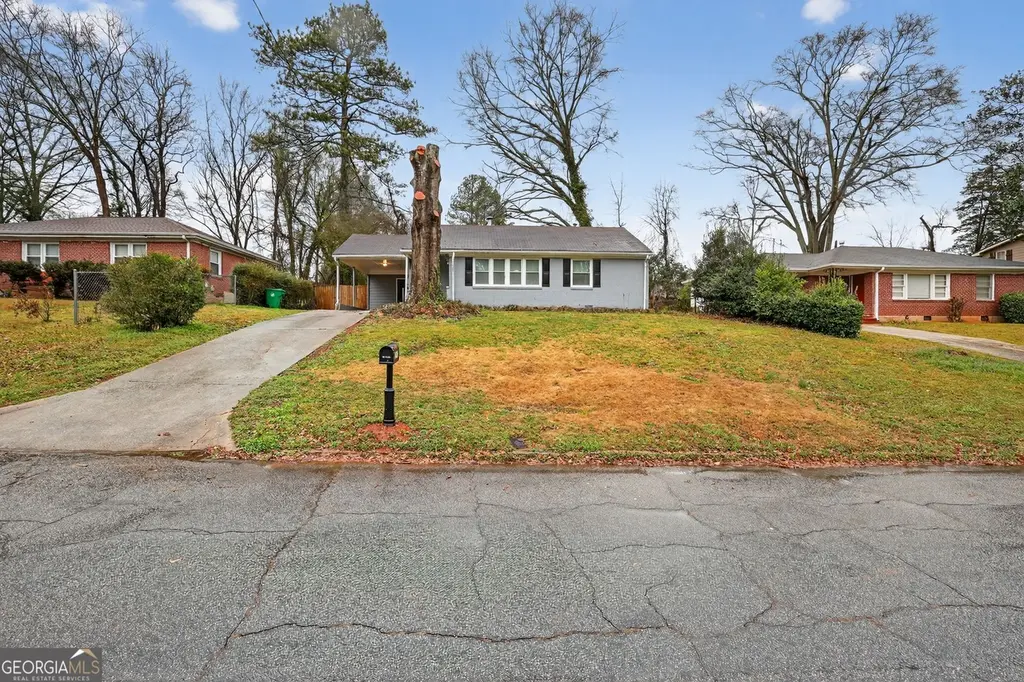
2751 Glenvalley Dr · Candler-McAfee, GA
Flood risk 1/10 · Minimal
- FEMA flood zone
- X (unshaded)
- Chance of flooding over 30 yrs
- 0.0%
- Est. flood insurance / yr
- $507 – $1,088
Fire risk 1/10 · Minimal
- Est. fire insurance / yr
- $963 – $1,789
Heat risk 5/10 · Moderate
- Hot days now (above 104°F)
- 7 days/yr
- Hot days in 30 yrs
- 17 days/yr
Wind risk 5/10 · Moderate
- Chance of severe wind over 30 yrs
- 26.0%
Air-quality risk 5/10 · Moderate
- Unhealthy air days now
- 6 days/yr
- Unhealthy air days in 30 yrs
- 8 days/yr
Risk factors via First Street. Map © Google.
Why this score? — see what drove the C- grade
The composite is a weighted blend of 9 inputs, each scored 0–100. Each bar is that input's sub-score; the figure is the points it added to the 100-point composite (weight × sub-score).
- Cash flow +15.5/30.0
- ARV discount +15.0/15.0
- 1% rule +5.4/10.0
- DSCR +4.8/10.0
- Rent growth +2.8/5.0
- Livability +2.5/5.0
- Condition / age +2.5/5.0
- Schools +2.1/10.0
- Appreciation +0.0/10.0
$159,900
🖨 Deal sheet 📄 Offer letter ✓ Due diligence
Listing remarks MLS
Charming and move-in ready, this well-maintained 3 bedroom, 1 full bathroom home offers comfortable one-level living with 1,067 square feet of inviting space. Featuring a functional layout, the home provides a bright living area, a cozy dining space, and a thoughtfully designed kitchen with ample cabinet storage. All bedrooms are generously sized with great natural light, and the full bath is conveniently located for easy access. The single-story design ensures effortless flow throughout the home. Seller will install AC unit with acceptable offer.
Key facts
- 0.23 acre lot
- Parking
- Built 1952
Neighborhood map
What this means for you Summary
Snapshot
- This is a 3-bed/1.0-bath single-family listed at $160k.
Deal economics
- At list price, monthly cash flow is $65 ($786/yr) — positive.
- The deal already cash-flows at list — no discount required.
- Meets the 1% rule at list price ($2k rent vs $160k).
- Recommended offer: $146k (9.0% below list) — sets the bar for market timing.
- Cap rate 6.8% vs local median 4.2% in Candler-McAfee — top-decile yield for the area; either an underpriced asset or a hidden risk that comps aren't pricing in. Stress-test before assuming the spread holds.
Location & tenants
- Location reads: area grade C — affects rentability + tenant quality, not the cash-flow math above.
- Dekalb County (suburban): math 19% / reading 28% proficiency, ranked #125 of 174 in GA (top 72%) — low school quality limits family demand, transient renter base, plan for 1-2y turnover; 68% free/reduced lunch — lower-income household profile, screen leases tightly.
- Market conditions: Rents rising (+1.3%/yr); 422 active listings in the ZIP; 40 comparable units currently listed for rent nearby; rentals at typical pace (median 24d on market — plan ~3-4 weeks tenant-placement turnaround); 45% of comp listings sitting > 30 days — soft ceiling on asking rent; 1,240 units permitted in DeKalb County in 2024 (385 in 5+ unit buildings).
- This rent runs 32% of the median local income ($63k/yr) — at the standard rent-burdened threshold; future hikes will face affordability resistance.
Forward outlook
- Local home prices are declining (-3.0%/yr); year-one equity from $1k of loan paydown is wiped out by about $5k of value loss. Plan a longer hold.
- DeKalb County population projected at +28% by 2050 — long-run rental-demand tailwind backs the buy-and-hold thesis.
Negotiation context
- It's been on market 92 days — a 9% lower offer ($146k) is reasonable based on typical stale-listing flexibility.
- 2 sale attempts since 18y ago; this cycle's ask has dropped $10k (6%) from the opening price — seller is motivated, your offer sets the floor, not the list.
Risks & watch-outs
- Watch-outs: property tax is 2.5% of price; built in 1952 — expect roof / HVAC / electrical / plumbing capex.
- Climate carrying-cost: moderate wind risk, 26% chance of damaging wind over 30y; extreme-heat days projected 7→17/yr by 2055 (HVAC capex compounding) — expect insurance premiums to compound above CPI over the hold.
Questions for the listing agent
- It's been on market 92 days. Have you received any prior offers? Is the seller open to a 9% concession, seller financing, or rate buy-down credit?
- Built in 1952 — when were the roof, HVAC, electrical panel, plumbing, and water heater last replaced?
- Property tax is high relative to price — has the assessment been appealed recently, and will the sale trigger a re-assessment?
- Why hasn't it sold? Are there any deal-killer items the seller is aware of (foundation, flood, title, zoning, code violations)?
- Is there a deadline driving the sale (1031 exchange, divorce, estate, relocation)? That informs how much negotiation room exists.
- What's the average days-on-market for RENTAL listings here right now (not sales)? A rising rental-DOM trend means longer vacancies and softer asking-rent achievability than the comps imply.
- What's the recent tenant-quality profile in this submarket — average credit score on applications, eviction rate, late-payment / NSF rate, and stable-employment percentage? A property-management company in the area should have these aggregated.
- How much new for-sale + rental construction is in the pipeline within 1–3 miles? Heavy new supply typically softens prices + rents 12–24 months out; constrained supply supports both.
Investment metrics
- 1% rule
- 1.04% ✓
- Cap rate
- 6.78%
- Cash-on-cash
- 1.75%
- DSCR
- 1.08
- GRM
- 8.0
CMA / ARV
- ARV (median comp)
- $287,747
- List price
- $159,900
- Delta
- -44.43%
- Verdict
- UNDERPRICED
- Comps
- 20 within 1.0 mi
Show comp detail 12 sales within ~0.75 mi
| Address | Dist | Beds/Ba | Sqft | Sold | Price | $/sf | Match |
|---|---|---|---|---|---|---|---|
| 1767 Thomas St | 0.25mi | 3/1.0 | 1,042 (-2%) | 2mo | $167,500 | $161 | 82 |
| 2712 Joyce Ave | 0.18mi | 3/2.0 | 1,095 (+3%) | 2mo | $300,000 | $274 | 82 |
| 2628 Northview Ave | 0.18mi | 3/1.0 | 1,024 (-4%) | 5mo | $130,000 | $127 | 81 |
| 2822 Joyce Ave | 0.40mi | 3/1.0 | 1,000 (-6%) | 1mo | $185,000 | $185 | 70 |
| 2812 Mitchell Dr | 0.41mi | 3/1.0 | 1,002 (-6%) | 5mo | $172,000 | $172 | 66 |
| 2665 Northview Ave | 0.19mi | 2/1.0 (-1) | 936 (-12%) | 3mo | $174,000 | $186 | 63 |
| 1968 Don Juan Ln | 0.33mi | 3/2.0 | 936 (-12%) | 2mo | $302,000 | $323 | 59 |
| 1987 Meadow Ln | 0.67mi | 3/2.0 | 975 (-9%) | 1mo | $257,000 | $264 | 50 |
| 1909 Meadow Ln | 0.60mi | 3/2.0 | 1,175 (+10%) | 4mo | $208,000 | $177 | 48 |
| 2505 Mellville Ave | 0.49mi | 2/1.0 (-1) | 936 (-12%) | 5mo | $210,000 | $224 | 48 |
| 1981 Meadow Ln | 0.67mi | 3/1.0 | 1,195 (+12%) | 3mo | $218,000 | $182 | 46 |
| 2913 Santa Monica Dr | 0.73mi | 3/2.0 | 1,209 (+13%) | 5mo | $321,038 | $266 | 35 |
Match score weights: distance 35% · size 25% · config 20% · recency 20%. Top-matched comps best support the ARV.
Projected returns pro-forma
-3.0% appreciation · 1.34% rent growth · sell at horizon
- IRR
- -15.5%
- Equity multiple
- 0.46×
- Total profit
- $-24,355
- Equity at exit
- $23,842
- IRR
- -10.5%
- Equity multiple
- 0.41×
- Total profit
- $-26,204
- Equity at exit
- $13,825
Cash invested: $44,772 (down + closing). Projections, not guarantees.
Landlord ↔ Tenant lean methodology
- Overall (STATE)
- 90 Strongly Landlord-Friendly
- State Georgia
- 90 Strongly Landlord-Friendly · R+3
- County
- — inherits STATE
- City
- — inherits STATE
ZIP-level market 30032
- Rents YoY
- 1.3%
- Active inventory
- 422
- Price-to-rent
- 8.0×
Monthly cashflow live
- Estimated rent
- $1,659 high interval (Pro) →
- Mortgage (P&I)
- −$839
- Tax from tax record
- −$340 /mo · $4,077/yr
- Insurance
- −$67
- HOA
- −$0
- Vacancy / Maint / Mgmt
- −$348
- Net cashflow
- $65
Break-even live
UW: 25.0% down · 7.5% · 30yr · 1.5% tax · 5.0% vac · 8.0% maint · 8.0% mgmt
Financing live
Cash to close
- Down payment
- $39,975
- Closing costs
- $4,797
- Reserves months
- —
- Total cash needed
- —
Loan-product check · same deal, 3 products live
Conventional
25% down · 7.5% · 30yr
- Down + closing
- —
- Monthly P&I
- —
- Monthly cashflow
- —
- DSCR
- —
- Eligible?
- —
Personal DTI + credit; lowest rate.
DSCR
20% down · 8.5% · 30yr
- Down + closing
- —
- Monthly P&I
- —
- Monthly cashflow
- —
- DSCR
- —
- Eligible?
- —
No personal income docs; deal must DSCR.
Hard money
10% down · 12.0% · 12mo
- Down + closing
- —
- Monthly P&I
- —
- Monthly cashflow
- —
- DSCR
- —
- Eligible?
- —
Short-term bridge; refi at stabilization.
Rent comps 40 comps
| Address | Beds | Baths | Sqft | Rent | $/sqft | DOM | Units | Dist |
|---|---|---|---|---|---|---|---|---|
| 2674 Joyce Ave Decatur, GA | 3.0 | 1.0 | 1014 | $1,044 | $1.03 | 20d | 1 | 0.13mi |
| 2577 Eastwood Dr Decatur, GA | 3.0 | 2.0 | 1075 | $1,700 | $1.58 | 24d | 1 | 0.28mi |
| 2577 Eastwood Dr Decatur, GA | 3.0 | 2.0 | 1075 | $1,700 | $1.58 | 18d | 1 | 0.28mi |
| 2721 White Oak Dr Decatur, GA | 1.0–2.0 | 1.0–1.5 | 975 | $1,190 | $1.22 | 43d | 3 | 0.33mi |
| 2758 Amelia Ave Decatur, GA | 2.0 | 1.0 | 850 | $1,500 | $1.76 | 12d | 1 | 0.34mi |
| 1972 Don Juan Ln Decatur, GA | 3.0 | 1.5 | 1224 | $1,799 | $1.47 | 43d | 1 | 0.36mi |
| 2706 White Oak Dr Decatur, GA | 3.0 | 2.0 | 1274 | $2,175 | $1.71 | 20d | 1 | 0.37mi |
| 2771 White Oak Dr Decatur, GA | 3.0 | 2.0 | 1032 | $1,524 | $1.48 | 5d | 2 | 0.40mi |
| 1994 Don Juan Ln Decatur, GA | 2.0 | 2.0 | 1200 | $1,495 | $1.25 | 12d | 1 | 0.41mi |
| 3529 Robins Landing Way Decatur, GA | 1.0–4.0 | 1.0–2.0 | 1042 | $1,443 | $1.38 | 1d | 37 | 0.43mi |
| 3529 Robins Landing Way Decatur, GA | 1.0–3.0 | 1.0–2.0 | 982 | $1,677 | $1.71 | 43d | 26 | 0.43mi |
| 1630 Line St Unit 1 Decatur, GA | 2.0 | 1.0 | 900 | $895 | $0.99 | 15d | 1 | 0.47mi |
| 1627 Line Cir Unit 4 Decatur, GA | 2.0 | 1.0 | 1000 | $1,295 | $1.29 | 43d | 1 | 0.47mi |
| 2039 Nettie Ct Unit RT Decatur, GA | 3.0 | 1.0 | 974 | $1,600 | $1.64 | 24d | 1 | 0.51mi |
| 1610 Line St Decatur, GA | 2.0 | 1.0 | 950 | $1,350 | $1.42 | 43d | 1 | 0.52mi |
| 1607 Line Cir Apt 2 Decatur, GA | 2.0 | 1.0 | 850 | $950 | $1.12 | 17d | 1 | 0.53mi |
| 1711 Candler Rd Decatur, GA | 2.0 | 1.0 | 936 | $1,860 | $1.99 | 43d | 1 | 0.53mi |
| 1930 Normal St Decatur, GA | 4.0 | 2.0 | 1459 | $1,850 | $1.27 | 43d | 1 | 0.56mi |
| 1596 Line Cir Apt 1 Decatur, GA | 2.0 | 1.0 | 966 | $995 | $1.03 | 1d | 1 | 0.57mi |
| 2873 White Oak Dr Decatur, GA | 2.0 | 1.5 | 816 | $1,800 | $2.21 | 43d | 1 | 0.58mi |
| 2931 Glenwood Ave SE Atlanta, GA | 2.0 | 1.0 | 865 | $1,750 | $2.02 | 43d | 1 | 0.60mi |
| 2912 Glenwood Ave SE Atlanta, GA | 2.0 | 1.0 | 1063 | $1,695 | $1.59 | 22d | 1 | 0.62mi |
| 1689 San Gabriel Ave Decatur, GA | 3.0 | 1.0 | 989 | $1,450 | $1.47 | 43d | 1 | 0.74mi |
| 1693 San Gabriel Ave Decatur, GA | 3.0 | 2.0 | 1265 | $1,995 | $1.58 | 4d | 1 | 0.74mi |
| 3106 Memorial Dr Atlanta, GA | 3.0 | 1.0–2.0 | 802 | $1,850 | $2.31 | 17d | 9 | 0.74mi |
| 2110 Dellwood Pl Decatur, GA | 2.0 | 1.0 | 1000 | $1,550 | $1.55 | 43d | 1 | 0.76mi |
| 3106 Memorial Dr SE Unit N204 Atlanta, GA | 2.0 | 1.0 | 915 | $1,695 | $1.85 | 43d | 1 | 0.77mi |
| 3106 Memorial Dr SE Unit G203 Atlanta, GA | 3.0 | 2.0 | 1185 | $1,850 | $1.56 | 43d | 1 | 0.77mi |
| 1622 Venice Dr SE Atlanta, GA | 3.0 | 1.0 | 1080 | $1,675 | $1.55 | 43d | 1 | 0.80mi |
| 251 Candler Rd SE Atlanta, GA | 2.0 | 1.0 | 850 | $1,305 | $1.54 | 16d | 1 | 0.82mi |
| 531 Allendale Dr Decatur, GA | 3.0 | 2.0 | 888 | $2,100 | $2.36 | 43d | 1 | 0.82mi |
| 1598 San Gabriel Ave Decatur, GA | 3.0 | 2.0 | 1451 | $2,023 | $1.39 | 24d | 1 | 0.90mi |
| 2524 Habersham Dr Decatur, GA | 3.0 | 1.0 | 1251 | $1,395 | $1.12 | 5d | 1 | 0.93mi |
| 3010 Santa Monica Dr Decatur, GA | 4.0 | 2.0 | 1392 | $2,095 | $1.51 | 43d | 1 | 0.93mi |
| 2553 Habersham Dr Decatur, GA | 2.0 | 4.5 | 1272 | $1,520 | $1.19 | 12d | 1 | 0.94mi |
| 2529 Habersham Dr Decatur, GA | 4.0 | 2.0 | 1272 | $7,895 | $6.21 | 20d | 1 | 0.95mi |
| 2386 Cresta Dr Decatur, GA | 3.0 | 2.5 | 1107 | $2,000 | $1.81 | 43d | 1 | 0.96mi |
| 2191 Greystone Way Decatur, GA | 3.0 | 1.0 | 1053 | $1,800 | $1.71 | 43d | 1 | 0.97mi |
| 2234 Brunswick Ave Decatur, GA | 2.0 | 1.0 | 780 | $1,950 | $2.50 | 5d | 1 | 1.03mi |
| 3024 Pasadena Dr Decatur, GA | 3.0 | 2.0 | 1079 | $1,993 | $1.85 | 5d | 1 | 1.03mi |
Listing history 15 events
-
2026-06-07statusdays on market $159,900 Under Contract 92 DOM
-
2026-06-04days on market $159,900 Active 91 DOM
-
2026-06-03days on market $159,900 Active 90 DOM
-
2026-06-02days on market $159,900 Active 89 DOM
-
2026-06-01days on market $159,900 Active 88 DOM
-
2026-05-31days on market $159,900 Active 87 DOM
-
2026-04-18price $159,900 554-char remark
Show marketing remark (554 chars)
Charming and move-in ready, this well-maintained 3 bedroom, 1 full bathroom home offers comfortable one-level living with 1,067 square feet of inviting space. Featuring a functional layout, the home provides a bright living area, a cozy dining space, and a thoughtfully designed kitchen with ample cabinet storage. All bedrooms are generously sized with great natural light, and the full bath is conveniently located for easy access. The single-story design ensures effortless flow throughout the home. Seller will install AC unit with acceptable offer.
-
2026-04-10price $164,900 554-char remark
Show marketing remark (554 chars)
Charming and move-in ready, this well-maintained 3 bedroom, 1 full bathroom home offers comfortable one-level living with 1,067 square feet of inviting space. Featuring a functional layout, the home provides a bright living area, a cozy dining space, and a thoughtfully designed kitchen with ample cabinet storage. All bedrooms are generously sized with great natural light, and the full bath is conveniently located for easy access. The single-story design ensures effortless flow throughout the home. Seller will install AC unit with acceptable offer.
-
2026-03-05$169,900 New 554-char remark
Show marketing remark (554 chars)
Charming and move-in ready, this well-maintained 3 bedroom, 1 full bathroom home offers comfortable one-level living with 1,067 square feet of inviting space. Featuring a functional layout, the home provides a bright living area, a cozy dining space, and a thoughtfully designed kitchen with ample cabinet storage. All bedrooms are generously sized with great natural light, and the full bath is conveniently located for easy access. The single-story design ensures effortless flow throughout the home. Seller will install AC unit with acceptable offer.
-
2012-12-20soldstatus $714,000
-
2008-09-25soldstatus $31,000 72-char remark
Show marketing remark (72 chars)
GREAT INVESTMENT, SOLD "AS IS". HARDWOOD FLOORS, FIXER UPPER.
-
2008-08-03$45,320 72-char remark
Show marketing remark (72 chars)
GREAT INVESTMENT, SOLD "AS IS". HARDWOOD FLOORS, FIXER UPPER.
-
2006-07-20soldstatus $110,000
-
1988-09-16soldstatus $49,000
-
1983-04-22soldstatus $41,900
ⓘ Source: listings_history table (triggers on properties + properties_extension) + one-shot
backfill from property_details.listing_events for pre-trigger history.
Tax reassessment forecast GA · Resets to sale price
- Current annual tax
- $4,077 · $340/mo
- Projected year-2 tax
- $4,077 · $340/mo
- Expected delta
- $0/yr ($0/mo · 0.0%)
ⓘ Screening estimate from a state-policy table — verify with the county assessor before closing.
Climate risk First Street
- Flood 1/10 Low FEMA zone X (unshaded) · 0% chance over 30 yrs
- Wildfire 1/10 Low
- Heat 5/10 Major 7 d/yr ≥104°F today · 17 d/yr by 30 yrs out
- Wind 5/10 Major 26% chance of damaging wind over 30 yrs
- Air quality 5/10 Major 6 unhealthy d/yr today · 8 by 30 yrs out
Nearby sold comps map
Loading sold comps map…
Walkable amenities ~0.75 mi
Loading nearby amenities…
Taxation est. · year 1
- Rental income
- $19,905
- − Mortgage interest
- −$8,957
- − Property taxes
- −$4,077
- − Insurance
- −$800
- − Repairs & maintenance
- −$1,592
- − Management
- −$1,592
- − Depreciation
- −$4,652
- Taxable loss
- −$1,765
- Est. tax savings @ 24.0%
- +$424
- After-tax cash flow
- $1,209/yr
For passive investors: Depreciation is non-cash, so a rental often shows a tax loss while cash-flowing — sheltering income. Rental losses are passive: they offset passive income freely, and up to $25,000/yr can offset ordinary (W-2) income if you actively participate and your MAGI is under $100k (phasing out to $0 by $150k); unused losses carry forward. On sale, claimed depreciation is recaptured at up to 25%, and gains may owe capital-gains tax (a 1031 exchange can defer both). Figures are a year-1 estimate at your 24.0% rate — not tax advice; consult a CPA.
Schools (NCES district)
- District
- Dekalb County
- NCES district ID
- 1301740
- Math proficiency
- 19% ▼ -12.00%
- Reading proficiency
- 28% ▼ -7.00%
- Median HH income
- $51,448
- Composite
- 20.92/100
- National rank
- #8482
- State rank
- #125 of 174 in GA
Livability — Candler-McAfee
No livability data for this city. (Only ~50 U.S. cities are tracked.)
Census & demographics
- Census place
- Candler-McAfee, GA
- County
- Dekalb County · 782,738 people
- Metro
- Atlanta-Sandy Springs-Alpharetta, GA
- Population (ZIP)
- 42,948
- Household income
- $62,765
- Rent vs Own
- Severe rent burden
- 2097.0
Population outlook (DeKalb County) Hauer SSP2
- Today (2025)
- 839,977 people
- By 2030
- 891,768 · +6.2%
- By 2040
- 988,894 · +17.7%
- By 2050
- 1,074,583 · +27.9%
- By 2075
- 1,245,026 · +48.2%
- By 2100
- 1,303,135 · +55.1%
Race, ethnicity, and origin ACS 2023
- Neighborhood character
- Predominantly Black (70%)
- Race & ethnicity
- Black 70% White 18% Two or more races 6% Hispanic / Latino 5% Asian 2%
- Hispanic origin (detail)
- Mexican 2%
- Common ancestry
- Slovak 1% Italian 1% Serbian 1%
- Foreign-born
- 7% · Canada, China, Guatemala
- Languages at home
- 91% English-only · Spanish 4% Arabic 1% Other Indo-European 0%
Political lean MEDSL · DeKalb
- 2024 margin
- Solid D (+64.8) · D 81.9% · R 17.1% · Other 1.0%
- 2008→2024 swing
- +6.1pp toward D · 2008: 58.6pp · 2024: 64.8pp
- All cycles
- 2024: D+64.8 2020: D+67.4 2016: D+64.8 2012: D+56.8 2008: D+58.6
Not yet ingested
- Civics
- —
Market trends
- HPI YoY
- ▼ -203.83%
- Current HPI
- 221.0467
- Rent YoY
- ▲ 1.34%
- Metro
- Atlanta-Sandy Springs-Alpharetta, GA
- State GDP YoY
- ▲ 2.66%
- F500 in state
- 28
Industry mix (Fortune 500 HQ in GA)
| Industry | F500 HQs | Revenue |
|---|---|---|
| Paper / Packaging | 2 | $29B |
|
||
| Retail | 1 | $160B |
|
||
| Transportation / Logistics | 1 | $91B |
|
||
| Airlines | 1 | $62B |
|
||
| Consumer Goods | 1 | $47B |
|
||
| Utilities | 1 | $25B |
|
||
Price history
+281.6% since first listed9 events — show timeline
- 2026-04-18 Price Changed $159,900 GAMLS
- 2026-04-10 Price Changed $164,900 GAMLS
- 2026-03-05 Listed $169,900 GAMLS
- 2012-12-20 Sold (Public Records) $714,000 Public Records
- 2008-09-25 Sold (MLS) $31,000 FMLS
- 2008-08-03 Listed $45,320 FMLS
- 2006-07-20 Sold (Public Records) $110,000 Public Records
- 1988-09-16 Sold (Public Records) $49,000 Public Records
- 1983-04-22 Sold (Public Records) $41,900 Public Records
Property tax history
+5.2%/yrLatest (2025): $4,077 · +0.1% YoY. Source: county tax records.
Cash-flow waterfall
monthlySold comps — $/sqft
last 12 mo · ≤1 miLoading sold comps…