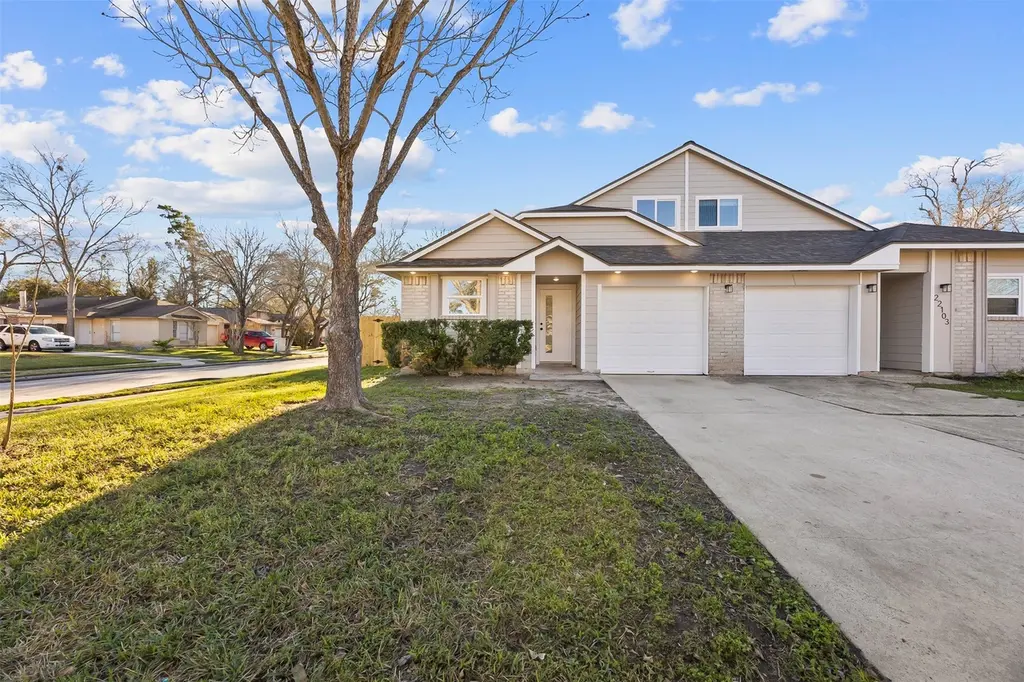
22101 Diane Dr · Spring, TX
Flood risk 1/10 · Minimal
- FEMA flood zone
- X (unshaded)
- Chance of flooding over 30 yrs
- 0.0%
- Est. flood insurance / yr
- $507 – $1,088
Fire risk 1/10 · Minimal
- Est. fire insurance / yr
- $1,222 – $2,270
Heat risk 9/10 · Severe
- Hot days now (above 111°F)
- 7 days/yr
- Hot days in 30 yrs
- 24 days/yr
Wind risk 8/10 · Major
- Chance of severe wind over 30 yrs
- 99.0%
Air-quality risk 3/10 · Minor
- Unhealthy air days now
- 3 days/yr
- Unhealthy air days in 30 yrs
- 3 days/yr
Risk factors via First Street. Map © Google.
Why this score? — see what drove the C grade
The composite is a weighted blend of 9 inputs, each scored 0–100. Each bar is that input's sub-score; the figure is the points it added to the 100-point composite (weight × sub-score).
- Cash flow +26.7/30.0
- DSCR +9.1/10.0
- ARV discount +7.5/15.0
- 1% rule +6.4/10.0
- Livability +3.3/5.0
- Condition / age +2.5/5.0
- Rent growth +2.4/5.0
- Schools +2.0/10.0
- Appreciation +0.0/10.0
$199,000
🖨 Deal sheet 📄 Offer letter ✓ Due diligence
Listing remarks
Welcome to 22101 Diane Drive located on a corner lot in Spring, TX! This beautifully remodeled 3-bedroom, 2-bath home offers comfortable living with a versatile gameroom perfect for entertaining, a home office, or play space. Recent updates enhance both style and functionality, creating a fresh, move-in-ready feel throughout. The open and inviting layout flows seamlessly, while the private bedrooms provide a relaxing retreat. Conveniently located with easy access to shopping, dining, and major roadways, this home is a must-see. Schedule your showing today!
Key facts
- Remodeled
- Private bedrooms
- Gameroom
Tags
Property features AI
Finance
- HOA & community: Association Principal Management; Annual association fee of $435 covering common areas
Exterior
- Parking: Attached garage (1 car)
- Utilities: Central electric heating and cooling
- Home design: Residential property; 2 stories; Entry on slab foundation
- Construction: Built in 1984; Brick, cement siding, and wood siding exterior; Composition roof; Slab foundation
- Exterior features: Concrete road access; Gutters
Interior
- Kitchen: Dishwasher; Electric oven; Electric range; Free-standing range; Disposal; Oven
- Bedrooms: Primary bedroom (First floor) — 14x11; Bedroom (First floor) — 11x11; Bedroom (First floor) — 11x10; Bedroom (Second floor) — 11x10
- Flooring: Carpet; Laminate; Tile
- Bathrooms: 2 full bathrooms
- Heating & cooling: Central heating (Electric); Central air conditioning (Electric)
- Interior features: Granite counters; High ceilings; Pantry; Self-closing cabinet doors; Tub/shower; Ceiling fans; Living/dining room
Neighborhood map
What this means for you Summary
Snapshot
- This is a 3-bed/2.0-bath townhouse listed at $199k.
Deal economics
- At list price, monthly cash flow is $536 ($6k/yr) — positive.
- The deal already cash-flows at list — no discount required.
- Meets the 1% rule at list price ($2k rent vs $199k).
- Recommended offer: $193k (3.0% below list) — sets the bar for market timing.
- Cap rate 9.5% vs local median 4.5% in Spring — top-decile yield for the area; either an underpriced asset or a hidden risk that comps aren't pricing in. Stress-test before assuming the spread holds.
Location & tenants
- Location reads 66/100 on livability (#635 in TX) — a middle-class / working-renter tenant base. Strengths: cost of living A+, housing A+, employment B; Watch: crime D, amenities F, commute F.
- Spring ISD (suburban): math 19% / reading 26% proficiency, ranked #730 of 826 in TX (top 88%) — low school quality limits family demand, transient renter base, plan for 1-2y turnover; 66% free/reduced lunch — lower-income household profile, screen leases tightly.
- Zoned schools: Dueitt Middle (math 12% / reading 23%, grade F, #1,507 of 1,662 statewide, top 91%, 773 students, 84% FRL); Spring H S (math 12% / reading 21%, grade F, #1,497 of 1,632 statewide, top 92%, 2,760 students, 72% FRL).
- Market conditions: Rents soft (-0.3%/yr); 595 active listings in the ZIP; solid renter incomes; 29,883 units permitted in Harris County in 2024 (8,621 in 5+ unit buildings).
- This rent runs 31% of the median local income ($89k/yr) — at the standard rent-burdened threshold; future hikes will face affordability resistance.
Forward outlook
- Local home prices are declining (-3.0%/yr); year-one equity from $1k of loan paydown is wiped out by about $6k of value loss. Plan a longer hold.
- Harris County population projected at +47% by 2050 — long-run rental-demand tailwind backs the buy-and-hold thesis.
Negotiation context
- It's been on market 55 days — a 3% lower offer ($193k) is reasonable based on typical stale-listing flexibility.
- 6 sale attempts since 19y ago; this cycle's ask has dropped $11k (5%) from the opening price — seller is motivated, your offer sets the floor, not the list.
Risks & watch-outs
- Climate carrying-cost: severe wind risk, 99% chance of damaging wind over 30y; extreme-heat days projected 7→24/yr by 2055 (HVAC capex compounding) — expect insurance premiums to compound above CPI over the hold.
Questions for the listing agent
- It's been on market 55 days. Have you received any prior offers? Is the seller open to a 3% concession, seller financing, or rate buy-down credit?
- What does the HOA fee cover, when was the last increase, and are there any pending special assessments or reserve-fund shortfalls?
- Is there a deadline driving the sale (1031 exchange, divorce, estate, relocation)? That informs how much negotiation room exists.
- Crime grade is D in this area — have there been break-ins, vandalism, or insurance claims at this property in the last 3 years? What carrier currently insures it and at what premium?
- What's the average days-on-market for RENTAL listings here right now (not sales)? A rising rental-DOM trend means longer vacancies and softer asking-rent achievability than the comps imply.
- What's the recent tenant-quality profile in this submarket — average credit score on applications, eviction rate, late-payment / NSF rate, and stable-employment percentage? A property-management company in the area should have these aggregated.
- How much new for-sale + rental construction is in the pipeline within 1–3 miles? Heavy new supply typically softens prices + rents 12–24 months out; constrained supply supports both.
Investment metrics
- 1% rule
- 1.14% ✓
- Cap rate
- 9.53%
- Cash-on-cash
- 11.55%
- DSCR
- 1.51
- GRM
- 7.3
CMA / ARV
No comps found within radius.
Projected returns pro-forma
-3.0% appreciation · 0.0% rent growth · sell at horizon
- IRR
- -2.3%
- Equity multiple
- 0.91×
- Total profit
- $-4,757
- Equity at exit
- $29,672
- IRR
- 4.0%
- Equity multiple
- 1.25×
- Total profit
- $14,034
- Equity at exit
- $17,206
Cash invested: $55,720 (down + closing). Projections, not guarantees.
Landlord ↔ Tenant lean methodology
- Overall (STATE)
- 87 Strongly Landlord-Friendly
- State Texas
- 87 Strongly Landlord-Friendly · R+5
- County
- — inherits STATE
- City
- — inherits STATE
ZIP-level market 77373
- Rents YoY
- -0.3%
- Active inventory
- 595
- Price-to-rent
- 7.3×
Monthly cashflow live
- Estimated rent
- $2,265 medium interval (Pro) →
- Mortgage (P&I)
- −$1,044
- Tax from tax record
- −$91 /mo · $1,087/yr
- Insurance
- −$83
- HOA
- −$36
- Vacancy / Maint / Mgmt
- −$476
- Net cashflow
- $536
Break-even live
UW: 25.0% down · 7.5% · 30yr · 1.5% tax · 5.0% vac · 8.0% maint · 8.0% mgmt
Financing live
Cash to close
- Down payment
- $49,750
- Closing costs
- $5,970
- Reserves months
- —
- Total cash needed
- —
Loan-product check · same deal, 3 products live
Conventional
25% down · 7.5% · 30yr
- Down + closing
- —
- Monthly P&I
- —
- Monthly cashflow
- —
- DSCR
- —
- Eligible?
- —
Personal DTI + credit; lowest rate.
DSCR
20% down · 8.5% · 30yr
- Down + closing
- —
- Monthly P&I
- —
- Monthly cashflow
- —
- DSCR
- —
- Eligible?
- —
No personal income docs; deal must DSCR.
Hard money
10% down · 12.0% · 12mo
- Down + closing
- —
- Monthly P&I
- —
- Monthly cashflow
- —
- DSCR
- —
- Eligible?
- —
Short-term bridge; refi at stabilization.
HOA detail
- Monthly dues
- $36 · $432/yr
Listing history 31 events
-
2026-06-18days on market $199,000 Active 55 DOM
-
2026-06-17days on market $199,000 Active 54 DOM
-
2026-06-16days on market $199,000 Active 53 DOM
-
2026-06-15days on market $199,000 Active 52 DOM
-
2026-06-13days on market $199,000 Active 50 DOM
-
2026-06-13days on market $199,000 Active 49 DOM
-
2026-06-09days on market $199,000 Active 46 DOM
-
2026-06-08days on market $199,000 Active 45 DOM
-
2026-06-07days on market $199,000 Active 44 DOM
-
2026-06-04days on market $199,000 Active 41 DOM
-
2026-06-03days on market $199,000 Active 40 DOM
-
2026-06-02days on market $199,000 Active 39 DOM
-
2026-06-01days on market $199,000 Active 38 DOM
-
2026-05-31days on market $199,000 Active 37 DOM
-
2026-05-16price $199,000 562-char remark
-
2026-05-16price $205,000 562-char remark
-
2026-04-24$210,000 Active 562-char remark
-
2026-04-24historical
-
2026-03-05price $214,500
-
2026-01-21$219,500 Active
-
2026-01-21historical
-
2026-01-19$219,500 Active
-
2025-08-25historical
-
2025-08-18price $91,000
-
2025-08-07$97,000 Active
-
2008-07-15historical
-
2008-01-15$85,900
-
2007-08-31historical
-
2007-05-31$89,500
-
1999-07-29soldstatus
-
1997-05-21soldstatus
ⓘ Source: listings_history table (triggers on properties + properties_extension) + one-shot
backfill from property_details.listing_events for pre-trigger history.
Tax reassessment forecast TX · Resets to sale price
- Current annual tax
- $1,087 · $91/mo
- Projected year-2 tax
- $3,642 · $303/mo
- Expected delta
- +$2,554/yr (+$213/mo · 234.9%)
ⓘ Screening estimate from a state-policy table — verify with the county assessor before closing.
Climate risk First Street
- Flood 1/10 Low FEMA zone X (unshaded) · 0% chance over 30 yrs
- Wildfire 1/10 Low
- Heat 9/10 Extreme 7 d/yr ≥111°F today · 24 d/yr by 30 yrs out
- Wind 8/10 Severe 99% chance of damaging wind over 30 yrs
- Air quality 3/10 Moderate 3 unhealthy d/yr today · 3 by 30 yrs out
Nearby sold comps map
Loading sold comps map…
Walkable amenities ~0.75 mi
Loading nearby amenities…
Taxation est. · year 1
- Rental income
- $27,184
- − Mortgage interest
- −$11,147
- − Property taxes
- −$1,087
- − Insurance
- −$995
- − Repairs & maintenance
- −$2,175
- − Management
- −$2,175
- − HOA
- −$432
- − Depreciation
- −$5,789
- Taxable income
- $3,384
- Est. tax owed @ 24.0%
- −$812
- After-tax cash flow
- $5,626/yr
For passive investors: Depreciation is non-cash, so a rental often shows a tax loss while cash-flowing — sheltering income. Rental losses are passive: they offset passive income freely, and up to $25,000/yr can offset ordinary (W-2) income if you actively participate and your MAGI is under $100k (phasing out to $0 by $150k); unused losses carry forward. On sale, claimed depreciation is recaptured at up to 25%, and gains may owe capital-gains tax (a 1031 exchange can defer both). Figures are a year-1 estimate at your 24.0% rate — not tax advice; consult a CPA.
Schools (NCES district)
- District
- Spring ISD
- NCES district ID
- 4841220
- Math proficiency
- 19% ▼ -13.00%
- Reading proficiency
- 26% ▼ -6.00%
- Median HH income
- $51,584
- Composite
- 20.12/100
- National rank
- #8643
- State rank
- #730 of 826 in TX
Livability — Spring
- Score
- 66/100
- State rank
- #635
- US rank
- #12101
Category grades
Schools grade is shown separately in the Schools card above.
Census & demographics
- Census place
- Spring, TX
- County
- Harris County · 4,702,590 people
- City population
- 430,529
- Metro
- Houston-The Woodlands-Sugar Land, TX
- Population (ZIP)
- 69,739
- Household income
- $88,617
- Rent vs Own
- Severe rent burden
- 1050.0
Population outlook (Harris County) Hauer SSP2
- Today (2025)
- 5,571,493 people
- By 2030
- 6,089,821 · +9.3%
- By 2040
- 7,142,806 · +28.2%
- By 2050
- 8,185,864 · +46.9%
- By 2075
- 10,574,329 · +89.8%
- By 2100
- 12,109,958 · +117.4%
Race, ethnicity, and origin ACS 2023
- Neighborhood character
- Diverse neighborhood (Simpson 0.69)
- Race & ethnicity
- Hispanic / Latino 40% White 30% Black 23% Two or more races 22% Asian 3%
- Hispanic origin (detail)
- Mexican 27% Puerto Rican 2% Cuban 2% Dominican 2%
- Common ancestry
- Lithuanian 2% Italian 1% Slovak 1%
- Foreign-born
- 17% · Canada, Jamaica, Vietnam
- Languages at home
- 64% English-only · Spanish 32% Vietnamese 1% Other Indo-European 1%
Political lean MEDSL · Harris
- 2024 margin
- Lean D (+5.5) · D 52.0% · R 46.4% · Other 1.6%
- 2008→2024 swing
- +3.9pp toward D · 2008: 1.6pp · 2024: 5.5pp
- All cycles
- 2024: D+5.5 2020: D+13.3 2016: D+12.4 2012: D+0.1 2008: D+1.6
Not yet ingested
- Civics
- —
Market trends
- HPI YoY
- ▼ -142.98%
- Current HPI
- 251.7231
- Rent YoY
- ▼ -0.30%
- Metro
- Houston-The Woodlands-Sugar Land, TX
- State GDP YoY
- ▲ 3.95%
- F500 in state
- 110
Industry mix (Fortune 500 HQ in TX)
| Industry | F500 HQs | Revenue |
|---|---|---|
| Energy | 16 | $1,198B |
|
||
| Technology | 5 | $198B |
|
||
| Engineering / Construction | 4 | $72B |
|
||
| Energy Services | 3 | $60B |
|
||
| Utilities | 3 | $41B |
|
||
| Healthcare | 2 | $330B |
|
||
Price history
+122.3% since first listed17 events — show timeline
- 2026-05-16 Price Changed $199,000 HARMLS
- 2026-05-16 Price Changed $205,000 HARMLS
- 2026-04-24 Listing Removed — HARMLS
- 2026-04-24 Listed $210,000 HARMLS
- 2026-03-05 Price Changed $214,500 HARMLS
- 2026-01-21 Listing Removed — HARMLS
- 2026-01-21 Listed $219,500 HARMLS
- 2026-01-19 Listed $219,500 HARMLS
- 2025-08-25 Listing Removed — HARMLS
- 2025-08-18 Price Changed $91,000 HARMLS
- 2025-08-07 Listed $97,000 HARMLS
- 2008-07-15 Listing Removed — HARMLS
- 2008-01-15 Listed $85,900 HARMLS
- 2007-08-31 Listing Removed — HARMLS
- 2007-05-31 Listed $89,500 HARMLS
- 1999-07-29 Sold (Public Records) — Public Records
- 1997-05-21 Sold (Public Records) — Public Records
Property tax history
-1.1%/yrLatest (2025): $1,087 · +2.2% YoY. Source: county tax records.
Cash-flow waterfall
monthlySold comps — $/sqft
last 12 mo · ≤1 miLoading sold comps…