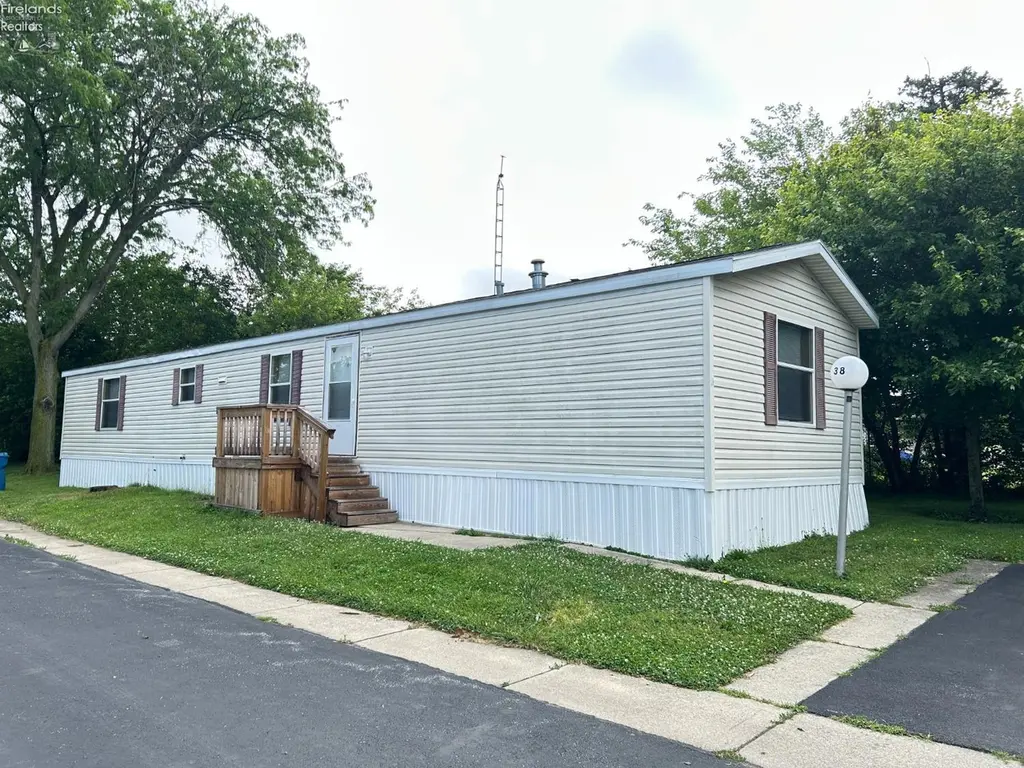
1730 Port Clinton Rd #38 · Fremont, OH
Flood risk 4/10 · Minor
- FEMA flood zone
- X (unshaded)
- Chance of flooding over 30 yrs
- 0.21%
- Est. flood insurance / yr
- $473 – $860
Fire risk 1/10 · Minimal
- Est. fire insurance / yr
- $713 – $1,323
Heat risk 3/10 · Minor
- Hot days now (above 98°F)
- 7 days/yr
- Hot days in 30 yrs
- 17 days/yr
Wind risk 2/10 · Minimal
- Chance of severe wind over 30 yrs
- —
Air-quality risk 2/10 · Minimal
- Unhealthy air days now
- 1 days/yr
- Unhealthy air days in 30 yrs
- 1 days/yr
Risk factors via First Street. Map © Google.
Why this score? — see what drove the C+ grade
The composite is a weighted blend of 9 inputs, each scored 0–100. Each bar is that input's sub-score; the figure is the points it added to the 100-point composite (weight × sub-score).
- Cash flow +30.0/30.0
- 1% rule +10.0/10.0
- DSCR +10.0/10.0
- Livability +3.7/5.0
- Schools +3.3/10.0
- Rent growth +2.5/5.0
- Condition / age +2.5/5.0
- ARV discount +0.5/15.0
- Appreciation +0.0/10.0
$49,000
🖨 Deal sheet 📄 Offer letter ✓ Due diligence
Listing remarks
This 2004 Redman MH with new roof (2025) has a master ensuite plus 2 additional bedrooms and another full bathroom. The large living room makes for great family space, and the kitchen dining combination are ample size. The mobile home is located in Berch Terrace MH Park is a pet friendly park with wide paved road, beautiful trees for shade. It is a quiet park with plenty of green space for each mobile. This lot has designated parking with a two-car space and additional parking along the road. Water, Sewer and Trash are included in the current $455 monthly lot rent. Park approval is required. (Dogs must be registered with park management. )
Key facts
- Master ensuite
- Large living room
- New roof
Tags
Property features AI
Exterior
- Parking: Off-street paved parking
- Security: Security system
- Utilities: Public water; Public sewer; 100 amp electric service; Cable available
- Home design: Residential mobile home
- Construction: Aluminum siding; Slab foundation
- Exterior features: Asphalt roof; Shed(s)
Interior
- Kitchen: Dishwasher; Range / Oven; Refrigerator
- Bathrooms: 2 full bathrooms
- Heating & cooling: Natural gas forced air heating; Ceiling fan(s) for cooling
- Interior features: Storm windows; Insulated windows; Security system
Neighborhood map
What this means for you Summary
Snapshot
- This is a 3-bed/2.0-bath manufactured listed at $49k. Condition is rated fair.
Deal economics
- At list price, monthly cash flow is $634 ($8k/yr) — positive.
- The deal already cash-flows at list — no discount required.
- Meets the 1% rule at list price ($1k rent vs $49k).
- Cap rate 21.8% vs local median 5.3% in Fremont — top-decile yield for the area; either an underpriced asset or a hidden risk that comps aren't pricing in. Stress-test before assuming the spread holds.
Location & tenants
- Location reads 74/100 on livability (#283 in OH, #4,637 nationally) — a middle-class / working-renter tenant base. Strengths: cost of living A+, housing A+, health & safety A+; Watch: amenities F, commute F, employment F.
- Fremont City (town): math 35% / reading 44% proficiency, ranked #543 of 656 in OH (top 83%) — families likely to look elsewhere, expect single-tenant / working-renter base with shorter leases.
- Market conditions: 88 active listings in the ZIP; 3 comparable units currently listed for rent nearby; rentals lingering (median 44d on market — plan ~5-8 weeks vacancy on turnover, expect pricing pressure); 67% of comp listings sitting > 30 days — soft ceiling on asking rent; 23 units permitted in Sandusky County in 2024 (0 in 5+ unit buildings).
Forward outlook
- Local home prices are declining (-3.0%/yr); year-one equity from $339 of loan paydown is wiped out by about $1k of value loss. Plan a longer hold.
- Sandusky County population projected at -17% by 2050 — secular population decline; favor cash flow + early exit over multi-decade hold.
- At projected returns (-3.0% appreciation + 3.0% rent growth), your $14k cash investment doubles in ~3 years — after that, you're playing with house money.
Negotiation context
- Only 7 days on market — expect competitive offers; lowballing is unlikely to land.
Questions for the listing agent
- Have any recent inspections been done? Can we get a copy of the seller's disclosures and any deferred-maintenance estimates?
- Is there a deadline driving the sale (1031 exchange, divorce, estate, relocation)? That informs how much negotiation room exists.
- Schools are B-rated — typically a magnet for longer-tenancy family renters. What's the average tenant stay here, and is there a school-zone premium baked into asking?
- What's the average days-on-market for RENTAL listings here right now (not sales)? A rising rental-DOM trend means longer vacancies and softer asking-rent achievability than the comps imply.
- What's the recent tenant-quality profile in this submarket — average credit score on applications, eviction rate, late-payment / NSF rate, and stable-employment percentage? A property-management company in the area should have these aggregated.
- How much new for-sale + rental construction is in the pipeline within 1–3 miles? Heavy new supply typically softens prices + rents 12–24 months out; constrained supply supports both.
Investment metrics
- 1% rule
- 2.51% ✓
- Cap rate
- 21.82%
- Cash-on-cash
- 55.44%
- DSCR
- 3.47
- GRM
- 3.3
CMA / ARV
- ARV (on-the-fly)
- $42,435
- Comps found
- 2
Show comp detail 2 sales within ~0.75 mi
| Address | Dist | Beds/Ba | Sqft | Sold | Price | $/sf | Match |
|---|---|---|---|---|---|---|---|
| 1730 Port Clinton Road Rd #41 | 0.13mi | 3/2.0 | 924 (-11%) | 7mo | $35,000 | $38 | 70 |
| 1730 Port Clinton Rd #16 | 0.14mi | 2/1.0 (-1) | 980 (-5%) | 20mo | $40,000 | $41 | 59 |
Match score weights: distance 35% · size 25% · config 20% · recency 20%. Top-matched comps best support the ARV.
Projected returns pro-forma
-3.0% appreciation · 3.0% rent growth · sell at horizon
- IRR
- 53.8%
- Equity multiple
- 3.37×
- Total profit
- $32,452
- Equity at exit
- $7,306
- IRR
- 58.9%
- Equity multiple
- 6.85×
- Total profit
- $80,323
- Equity at exit
- $4,237
Cash invested: $13,720 (down + closing). Projections, not guarantees.
Landlord ↔ Tenant lean methodology
- Overall (STATE)
- 73 Landlord-Friendly
- State Ohio
- 73 Landlord-Friendly · R+6
- County
- — inherits STATE
- City
- — inherits STATE
ZIP-level market 43420
- Home prices YoY
- -32.4%
- Active inventory
- 88
- Price-to-rent
- 3.3×
Monthly cashflow live
- Estimated rent
- $1,231 medium interval (Pro) →
- Mortgage (P&I)
- −$257
- Tax est. 1.5%
- −$61 /mo · $735/yr
- Insurance
- −$20
- HOA
- −$0
- Vacancy / Maint / Mgmt
- −$259
- Net cashflow
- $634
Break-even live
UW: 25.0% down · 7.5% · 30yr · 1.5% tax · 5.0% vac · 8.0% maint · 8.0% mgmt
Financing live
Cash to close
- Down payment
- $12,250
- Closing costs
- $1,470
- Reserves months
- —
- Total cash needed
- —
Loan-product check · same deal, 3 products live
Conventional
25% down · 7.5% · 30yr
- Down + closing
- —
- Monthly P&I
- —
- Monthly cashflow
- —
- DSCR
- —
- Eligible?
- —
Personal DTI + credit; lowest rate.
DSCR
20% down · 8.5% · 30yr
- Down + closing
- —
- Monthly P&I
- —
- Monthly cashflow
- —
- DSCR
- —
- Eligible?
- —
No personal income docs; deal must DSCR.
Hard money
10% down · 12.0% · 12mo
- Down + closing
- —
- Monthly P&I
- —
- Monthly cashflow
- —
- DSCR
- —
- Eligible?
- —
Short-term bridge; refi at stabilization.
Rent comps 3 comps
| Address | Beds | Baths | Sqft | Rent | $/sqft | DOM | Units | Dist |
|---|---|---|---|---|---|---|---|---|
| 1425 White Ave Fremont, OH | 3.0 | 1.0 | 1142 | $1,495 | $1.31 | 43d | 1 | 0.86mi |
| 1528 North St Fremont, OH | 2.0 | 1.0 | 750 | $834 | $1.11 | 43d | 1 | 0.99mi |
| 900 Stilwell Ave Fremont, OH | 3.0 | 2.0 | 1484 | $1,250 | $0.84 | 17d | 1 | 1.09mi |
Listing history 7 events
-
2026-06-18days on market $49,000 Active 7 DOM
-
2026-06-17days on market $49,000 Active 6 DOM
-
2026-06-16days on market $49,000 Active 5 DOM
-
2026-06-15days on market $49,000 Active 4 DOM
-
2026-06-13days on market $49,000 Active 2 DOM
-
2026-06-12remarks 647-char remark
-
2026-06-12$49,000 Active 1 DOM
ⓘ Source: listings_history table (triggers on properties + properties_extension) + one-shot
backfill from property_details.listing_events for pre-trigger history.
Climate risk First Street
- Flood 4/10 Moderate FEMA zone X (unshaded) · 21% chance over 30 yrs
- Wildfire 1/10 Low
- Heat 3/10 Moderate 7 d/yr ≥98°F today · 17 d/yr by 30 yrs out
- Wind 2/10 Low
- Air quality 2/10 Low 1 unhealthy d/yr today · 1 by 30 yrs out
Nearby sold comps map
Loading sold comps map…
Walkable amenities ~0.75 mi
Loading nearby amenities…
Taxation est. · year 1
- Rental income
- $14,773
- − Mortgage interest
- −$2,745
- − Property taxes
- −$735
- − Insurance
- −$245
- − Repairs & maintenance
- −$1,182
- − Management
- −$1,182
- − Depreciation
- −$1,425
- Taxable income
- $7,259
- Est. tax owed @ 24.0%
- −$1,742
- After-tax cash flow
- $5,865/yr
For passive investors: Depreciation is non-cash, so a rental often shows a tax loss while cash-flowing — sheltering income. Rental losses are passive: they offset passive income freely, and up to $25,000/yr can offset ordinary (W-2) income if you actively participate and your MAGI is under $100k (phasing out to $0 by $150k); unused losses carry forward. On sale, claimed depreciation is recaptured at up to 25%, and gains may owe capital-gains tax (a 1031 exchange can defer both). Figures are a year-1 estimate at your 24.0% rate — not tax advice; consult a CPA.
Condition & rehab AI · 14 photos
This mobile home has a fair condition with some repairs and maintenance needed. A new roof, flooring, and painting will significantly increase its value for both resale and rental.
Repairs flagged
- Major Roof — The independent image shows a new roof installed in 2025, but the listing photo shows an older roof. The independent image suggests the roof may need replacement.
- Major Flooring — The independent image shows carpeted flooring, which appears to be in poor condition. The listing photo shows a different flooring type, which may be in better condition.
- Major Interior walls/paint — The independent image shows some wear and tear on the interior walls and paint. The listing photo shows a different paint color, which may be in better condition.
Value-add opportunities
- Both New roof — A new roof will improve the home's appearance and increase its value for both resale and rental.
- Both New flooring — New flooring will improve the home's appearance and increase its value for both resale and rental.
- Both Paint interior walls — Painting interior walls will improve the home's appearance and increase its value for both resale and rental.
Renovation cost estimate screening
| Repair item | Severity | Est. cost |
|---|---|---|
| Roof · The independent image shows a new roof installed in 2025, but the listing photo shows an older roof. The independent image suggests the roof may need replacement. | Major | $15,000–50,000 |
| Flooring · The independent image shows carpeted flooring, which appears to be in poor condition. The listing photo shows a different flooring type, which may be in better condition. | Major | $15,000–50,000 |
| Interior walls/paint · The independent image shows some wear and tear on the interior walls and paint. The listing photo shows a different paint color, which may be in better condition. | Major | $15,000–50,000 |
| Total estimated repair cost · 3 items | $45,000–150,000 |
Value-add ROI direction
- Both New roof — A new roof will improve the home's appearance and increase its value for both resale and rental. ↑
- Both New flooring — New flooring will improve the home's appearance and increase its value for both resale and rental. ↑
- Both Paint interior walls — Painting interior walls will improve the home's appearance and increase its value for both resale and rental. ↑
ⓘ Cost ranges are severity-bucket heuristics (US national rule-of-thumb). Get contractor quotes + a written scope before underwriting a rehab budget.
Schools (NCES district)
- District
- Fremont City
- NCES district ID
- 3904401
- Math proficiency
- 35% ▼ -27.00%
- Reading proficiency
- 44% ▼ -13.00%
- Median HH income
- $44,046
- Composite
- 33.48/100
- National rank
- #5449
- State rank
- #543 of 656 in OH
Livability — Fremont
- Score
- 74/100
- State rank
- #283
- US rank
- #4637
Category grades
Schools grade is shown separately in the Schools card above.
Census & demographics
- Census place
- Fremont, OH
- County
- Sandusky · 51,886 people
- City population
- 29,400
- Population (ZIP)
- 29,400
- Household income
- $62,802
- Rent vs Own
- Severe rent burden
- 10.4
Population outlook (Sandusky County) Hauer SSP2
- Today (2025)
- 57,409 people
- By 2030
- 55,791 · -2.8%
- By 2040
- 51,837 · -9.7%
- By 2050
- 47,712 · -16.9%
- By 2075
- 39,908 · -30.5%
- By 2100
- 33,171 · -42.2%
Race, ethnicity, and origin ACS 2023
- Neighborhood character
- Predominantly White (76%)
- Race & ethnicity
- White 76% Hispanic / Latino 14% Two or more races 9% Black 5%
- Hispanic origin (detail)
- Mexican 12%
- Common ancestry
- Romanian 3% Lithuanian 2% Slovak 1%
- Foreign-born
- 2% · Canada
- Languages at home
- 94% English-only · Spanish 5%
Political lean MEDSL · Sandusky
- 2024 margin
- Solid R (+30.9) · D 34.1% · R 65.0%
- 2008→2024 swing
- -35.5pp toward R · 2008: 4.6pp · 2024: -30.9pp
- All cycles
- 2024: R+30.9 2020: R+27.6 2016: R+23.0 2012: D+1.9 2008: D+4.6
Not yet ingested
- Civics
- —
Market trends
- HPI YoY
- ▼ -90.51%
- Current HPI
- 188.5274
- Rent YoY
- —
- Metro
- —
- State GDP YoY
- ▲ 1.98%
- F500 in state
- 48
Industry mix (Fortune 500 HQ in OH)
| Industry | F500 HQs | Revenue |
|---|---|---|
| Insurance | 3 | $145B |
|
||
| Industrial Machinery | 3 | $49B |
|
||
| Financial Services | 3 | $24B |
|
||
| Consumer Goods | 2 | $93B |
|
||
| Aerospace / Defense | 2 | $47B |
|
||
| Utilities | 2 | $33B |
|
||
Price history
1 event — show timeline
- 2026-06-11 Listed $49,000 FAOR
Cash-flow waterfall
monthlySold comps — $/sqft
last 12 mo · ≤1 miLoading sold comps…