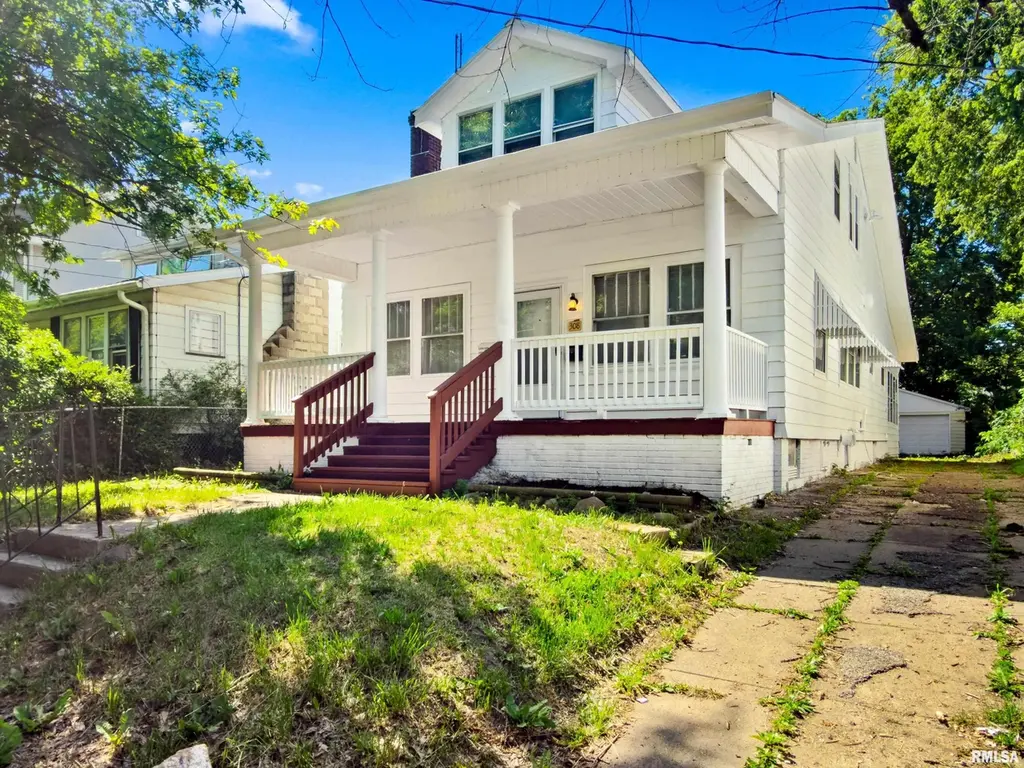
308 E Mcclure Ave · Peoria, IL
Flood risk 1/10 · Minimal
- FEMA flood zone
- X
- Chance of flooding over 30 yrs
- 0.0%
- Est. flood insurance / yr
- $473 – $860
Fire risk 1/10 · Minimal
- Est. fire insurance / yr
- $804 – $1,492
Heat risk 3/10 · Minor
- Hot days now (above 105°F)
- 7 days/yr
- Hot days in 30 yrs
- 18 days/yr
Wind risk 2/10 · Minimal
- Chance of severe wind over 30 yrs
- 1.0%
Air-quality risk 3/10 · Minor
- Unhealthy air days now
- 1 days/yr
- Unhealthy air days in 30 yrs
- 3 days/yr
Risk factors via First Street. Map © Google.
Why this score? — see what drove the D- grade
The composite is a weighted blend of 9 inputs, each scored 0–100. Each bar is that input's sub-score; the figure is the points it added to the 100-point composite (weight × sub-score).
- Cash flow +17.7/30.0
- DSCR +5.5/10.0
- 1% rule +4.2/10.0
- Livability +3.7/5.0
- Rent growth +3.4/5.0
- Condition / age +2.5/5.0
- Schools +1.1/10.0
- ARV discount +0.0/15.0
- Appreciation +0.0/10.0
$130,000
🖨 Deal sheet (PDF) 📄 Offer letter ✓ Due diligence
Listing remarks
Opportunity awaits with this versatile property just minutes from Peoria's Riverfront, Glen Oak Park, the Peoria Zoo, and some of the city's favorite local restaurants and coffee shops! Previously utilized as a duplex, the home offers two separate living spaces, each featuring 2 bedrooms, 1 full bathroom, and a full kitchen, making it ideal for investors, owner-occupants, multi-generational living, or house-hacking opportunities. The main-level unit features an oversized primary bedroom with direct access to a private deck and backyard, creating a rare retreat-like feel. A charming oversized front porch provides the perfect place to relax and enjoy the neighborhood's historic character. Dow
Key facts
- Private deck
- Bonus kitchen area
- 6,840 sq ft lot
Tags
Property features AI
Exterior
- Parking: Detached 2-car garage
- Utilities: Public water; Public sewer
- Home design: Single family residence; Built in 1917; Total living area about 1,937
- Construction: Shingle roof; Full basement
- Exterior features: Level lot; Lot dimensions approximately 45 x 152
Interior
- Kitchen: Kitchen on main level (approx. 13 x 14); Dishwasher; Refrigerator
- Bedrooms: Four bedrooms total; Main level bedroom (approx. 20 x 11) carpeted with egress window; Main level bedroom (approx. 10 x 10) carpeted with egress window; Upper level bedroom (approx. 10 x 10) carpeted with egress window; Upper level bedroom (approx. 10 x 10) carpeted with egress window
- Flooring: Carpet in bedrooms; Laminate flooring in kitchen
- Bathrooms: Three full bathrooms; No half bathrooms
- Heating & cooling: Forced air heating
- Interior features: Dishwasher; Refrigerator; Additional unspecified appliance(s); One fireplace; Full basement
- Laundry & utility: Basement provides utility space
Neighborhood map
What this means for you Summary
Snapshot
- This is a 4-bed/2.0-bath single-family listed at $130k.
Deal economics
- At list price, monthly cash flow is $105 ($1k/yr) — positive.
- The deal already cash-flows at list — no discount required.
- To meet the 1% rule (rent ≥ 1% of price), the offer needs to be $119k (8.4% below list).
- Recommended offer: $119k (8.4% below list) — sets the bar for 1% rule.
- Cap rate 7.3% vs local median 5.5% in Peoria — top-decile yield for the area; either an underpriced asset or a hidden risk that comps aren't pricing in. Stress-test before assuming the spread holds.
Location & tenants
- Location reads 73/100 on livability (#270 in IL) — a middle-class / working-renter tenant base. Strengths: commute A+, cost of living A+, housing A+; Watch: employment D+, crime F.
- Peoria SD 150 (urban): math 11% / reading 14% proficiency, ranked #554 of 620 in IL (top 89%) — low school quality limits family demand, transient renter base, plan for 1-2y turnover; 70% free/reduced lunch — lower-income household profile, screen leases tightly.
- Zoned schools: Lincoln School (math 0% / reading 2%, grade F, #2,052 of 2,056 statewide, top 100%, 727 students, 0% FRL); Reservoir Gifted School (math 79% / reading 82%, grade A+, #2 of 665 statewide, top 0%, 277 students, 0% FRL); Peoria High School (math 4% / reading 7%, grade F, #609 of 693 statewide, top 88%, 1,447 students, 0% FRL) — zoned schools average 0% FRL vs 70% district-wide (70 pts lower); this property's tenant base skews higher-income than the district average.
- Zoned-school proficiency averages 29% at this address vs 12% district-wide (+17 pts) — the actual schools serving this property are materially stronger than the Peoria SD 150 average implies; a family-tenant draw the district grade alone would hide.
- Market conditions: Rents rising (+3.5%/yr); 104 active listings in the ZIP; 8 comparable units currently listed for rent nearby; rentals at typical pace (median 23d on market — plan ~3-4 weeks tenant-placement turnaround); lower-income renter base — watch delinquency; 73 units permitted in Peoria County in 2024 (0 in 5+ unit buildings).
- This rent runs 34% of the median local income ($42k/yr) — at the standard rent-burdened threshold; future hikes will face affordability resistance.
Forward outlook
- Local home prices are declining (-3.0%/yr); year-one equity from $899 of loan paydown is wiped out by about $4k of value loss. Plan a longer hold.
- Peoria County population projected at -11% by 2050 — secular population decline; favor cash flow + early exit over multi-decade hold.
Negotiation context
- It's been on market 22 days — a 2% lower offer ($128k) is reasonable based on typical stale-listing flexibility.
- Current owner paid $40k; list at $130k implies a 225% gain — meaningful room to come down on a strong offer.
Risks & watch-outs
- Watch-outs: built in 1917 — expect roof / HVAC / electrical / plumbing capex.
Questions for the listing agent
- Built in 1917 — when were the roof, HVAC, electrical panel, plumbing, and water heater last replaced?
- Is there a deadline driving the sale (1031 exchange, divorce, estate, relocation)? That informs how much negotiation room exists.
- Schools are F-rated, which usually means shorter tenancies and higher turnover. Who's the typical renter profile here, and what's been the actual vacancy rate?
- Crime grade is F in this area — have there been break-ins, vandalism, or insurance claims at this property in the last 3 years? What carrier currently insures it and at what premium?
- The area grade is low — what's the realistic commute time and amenity access for the typical tenant pool here? Any planned neighborhood developments (good or bad) we should know about?
- What's the average days-on-market for RENTAL listings here right now (not sales)? A rising rental-DOM trend means longer vacancies and softer asking-rent achievability than the comps imply.
- What's the recent tenant-quality profile in this submarket — average credit score on applications, eviction rate, late-payment / NSF rate, and stable-employment percentage? A property-management company in the area should have these aggregated.
- How much new for-sale + rental construction is in the pipeline within 1–3 miles? Heavy new supply typically softens prices + rents 12–24 months out; constrained supply supports both.
Investment metrics
- 1% rule
- 0.92% ✗
- Cap rate
- 7.26%
- Cash-on-cash
- 3.45%
- DSCR
- 1.15
- GRM
- 9.1
CMA / ARV
- ARV (on-the-fly)
- $106,384
- Comps found
- 12
Show comp detail 12 sales within ~0.75 mi
| Address | Dist | Beds/Ba | Sqft | Sold | Price | $/sf | Match |
|---|---|---|---|---|---|---|---|
| 400 E Virginia Ave | 0.07mi | 4/1.0 | 1,676 (-4%) | 3mo | $117,500 | $70 | 84 |
| 301 E Thrush Ave | 0.19mi | 3/1.5 (-1) | 1,716 (-2%) | 2mo | $102,000 | $59 | 80 |
| 118 E Archer Ave | 0.15mi | 5/2.0 (+1) | 1,828 (+5%) | 1mo | $73,000 | $40 | 79 |
| 135 W Hanssler Pl | 0.33mi | 3/2.5 (-1) | 1,812 (+4%) | 3mo | $165,000 | $91 | 69 |
| 904 E Seneca Pl | 0.47mi | 3/1.5 (-1) | 1,765 (+1%) | 2mo | $107,000 | $61 | 67 |
| 220 E Frye St | 0.37mi | 3/2.0 (-1) | 1,842 (+6%) | 3mo | $56,500 | $31 | 66 |
| 1916 N Peoria Ave | 0.43mi | 3/2.0 (-1) | 1,817 (+4%) | 3mo | $147,000 | $81 | 65 |
| 812 E Seneca Pl | 0.44mi | 3/3.0 (-1) | 1,640 (-6%) | 3mo | $161,500 | $98 | 58 |
| 704 E Lasalle St | 0.73mi | 4/1.0 | 1,706 (-2%) | 1mo | $41,000 | $24 | 57 |
| 1826 N California Ave | 0.54mi | 3/1.5 (-1) | 1,564 (-10%) | 1mo | $34,900 | $22 | 50 |
| 714 E Kansas St | 0.50mi | 3/1.5 (-1) | 1,538 (-12%) | 2mo | $26,666 | $17 | 49 |
| 513 W Melbourne Ave | 0.73mi | 3/2.0 (-1) | 2,001 (+15%) | 2mo | $190,000 | $95 | 35 |
Match score weights: distance 35% · size 25% · config 20% · recency 20%. Top-matched comps best support the ARV.
Projected returns pro-forma
-3.0% appreciation · 3.49% rent growth · sell at horizon
- IRR
- -10.4%
- Equity multiple
- 0.62×
- Total profit
- $-13,837
- Equity at exit
- $19,383
- IRR
- -0.4%
- Equity multiple
- 0.97×
- Total profit
- $-1,110
- Equity at exit
- $11,240
Cash invested: $36,400 (down + closing). Projections, not guarantees.
Landlord ↔ Tenant lean methodology
- Overall (STATE)
- 43 Moderately Tenant-Leaning
- State Illinois
- 43 Moderately Tenant-Leaning · D+7
- County
- — inherits STATE
- City
- — inherits STATE
ZIP-level market 61603
- Home prices YoY
- -31.8%
- Rents YoY
- 3.5%
- Active inventory
- 104
- Price-to-rent
- 9.1×
Monthly cashflow live
- Estimated rent
- $1,191 high interval (Pro) →
- Mortgage (P&I)
- −$682
- Tax from tax record
- −$101 /mo · $1,208/yr
- Insurance
- −$54
- HOA
- −$0
- Vacancy / Maint / Mgmt
- −$250
- Net cashflow
- $105
Break-even live
Sensitivity live
| Price | -10% $178 | -5% $141 | +0% $105 | +5% $68 | +10% $31 |
|---|---|---|---|---|---|
| Rent | -10% $10 | -5% $57 | +0% $105 | +5% $152 | +10% $199 |
| Rate | -1.0pp $170 | -0.5pp $138 | base $105 | +0.5pp $71 | +1.0pp $37 |
UW: 25.0% down · 7.5% · 30yr · 1.5% tax · 5.0% vac · 8.0% maint · 8.0% mgmt
Financing live
Cash to close
- Down payment
- $32,500
- Closing costs
- $3,900
- Reserves months
- —
- Total cash needed
- —
Loan-product check · same deal, 3 products live
Conventional
25% down · 7.5% · 30yr
- Down + closing
- —
- Monthly P&I
- —
- Monthly cashflow
- —
- DSCR
- —
- Eligible?
- —
Personal DTI + credit; lowest rate.
DSCR
20% down · 8.5% · 30yr
- Down + closing
- —
- Monthly P&I
- —
- Monthly cashflow
- —
- DSCR
- —
- Eligible?
- —
No personal income docs; deal must DSCR.
Hard money
10% down · 12.0% · 12mo
- Down + closing
- —
- Monthly P&I
- —
- Monthly cashflow
- —
- DSCR
- —
- Eligible?
- —
Short-term bridge; refi at stabilization.
Rent comps 8 comps
| Address | Beds | Baths | Sqft | Rent | $/sqft | DOM | Units | Dist |
|---|---|---|---|---|---|---|---|---|
| 308 E Archer Ave Peoria, IL | 3.0 | 1.0 | 1444 | $950 | $0.66 | 15d | 1 | 0.07mi |
| 1806 N Peoria Ave Peoria, IL | 4.0 | 1.5 | 1668 | $894 | $0.54 | 15d | 1 | 0.56mi |
| 814 W McClure Ave Peoria, IL | 3.0 | 1.0 | 1148 | $1,100 | $0.96 | 45d | 1 | 0.78mi |
| 913 W McClure Ave Peoria, IL | 3.0 | 1.0 | 1400 | $1,200 | $0.86 | 23d | 1 | 0.87mi |
| 901 NE Glen Oak Ave Unit 2 Peoria, IL | 3.0 | 1.0 | 1120 | $1,200 | $1.07 | 23d | 1 | 0.89mi |
| 501 W Columbia Ter Unit 3 Peoria, IL | 3.0 | 1.0 | 1500 | $1,400 | $0.93 | 45d | 1 | 1.06mi |
| 2023 N Underhill St Peoria, IL | 3.0 | 1.0 | 1050 | $1,200 | $1.14 | 15d | 1 | 1.12mi |
| 2302 NE Monroe St Peoria, IL | 3.0 | 1.0 | 1100 | $875 | $0.80 | 15d | 1 | 1.37mi |
Listing history 17 events
-
2026-06-22days on market $130,000 Active 22 DOM
-
2026-06-19days on market $130,000 Active 20 DOM
-
2026-06-18days on market $130,000 Active 19 DOM
-
2026-06-17days on market $130,000 Active 18 DOM
-
2026-06-16days on market $130,000 Active 17 DOM
-
2026-06-15days on market $130,000 Active 16 DOM
-
2026-06-14days on market $130,000 Active 14 DOM
-
2026-06-13days on market $130,000 Active 13 DOM
-
2026-06-10days on market $130,000 Active 11 DOM
-
2026-06-09days on market $130,000 Active 10 DOM
-
2026-06-08days on market $130,000 Active 9 DOM
-
2026-06-07days on market $130,000 Active 8 DOM
-
2026-06-03days on market $130,000 Active 4 DOM
-
2026-06-02days on market $130,000 Active 3 DOM
-
2026-06-01days on market $130,000 Active 2 DOM
-
2026-05-30remarks 699-char remark
-
2026-05-30$130,000 Active 1 DOM
ⓘ Source: listings_history table (triggers on properties + properties_extension) + one-shot
backfill from property_details.listing_events for pre-trigger history.
Tax reassessment forecast IL · Partial reset (capped growth)
- Current annual tax
- $1,208 · $101/mo
- Projected year-2 tax
- $2,079 · $173/mo
- Expected delta
- +$872/yr (+$73/mo · 72.2%)
ⓘ Screening estimate from a state-policy table — verify with the county assessor before closing.
Climate risk First Street
- Flood 1/10 Low FEMA zone X · 0% chance over 30 yrs
- Wildfire 1/10 Low
- Heat 3/10 Moderate 7 d/yr ≥105°F today · 18 d/yr by 30 yrs out
- Wind 2/10 Low 100% chance of damaging wind over 30 yrs
- Air quality 3/10 Moderate 1 unhealthy d/yr today · 3 by 30 yrs out
Nearby sold comps map
Loading sold comps map…
Walkable amenities ~0.75 mi
Loading nearby amenities…
Taxation est. · year 1
- Rental income
- $14,295
- − Mortgage interest
- −$7,282
- − Property taxes
- −$1,208
- − Insurance
- −$650
- − Repairs & maintenance
- −$1,144
- − Management
- −$1,144
- − Depreciation
- −$3,782
- Taxable loss
- −$914
- Est. tax savings @ 24.0%
- +$219
- After-tax cash flow
- $1,474/yr
For passive investors: Depreciation is non-cash, so a rental often shows a tax loss while cash-flowing — sheltering income. Rental losses are passive: they offset passive income freely, and up to $25,000/yr can offset ordinary (W-2) income if you actively participate and your MAGI is under $100k (phasing out to $0 by $150k); unused losses carry forward. On sale, claimed depreciation is recaptured at up to 25%, and gains may owe capital-gains tax (a 1031 exchange can defer both). Figures are a year-1 estimate at your 24.0% rate — not tax advice; consult a CPA.
Schools (NCES district)
- District
- Peoria SD 150
- NCES district ID
- 1731230
- Math proficiency
- 11% ▼ -5.00%
- Reading proficiency
- 14% ▼ -4.00%
- Median HH income
- $41,951
- Composite
- 10.92/100
- National rank
- #9751
- State rank
- #554 of 620 in IL
Livability — Peoria
- Score
- 73/100
- State rank
- #270
- US rank
- #5096
Category grades
Schools grade is shown separately in the Schools card above.
Census & demographics
- Census place
- Peoria, IL
- County
- Peoria County · 120,495 people
- City population
- 114,670
- Metro
- Peoria, IL
- Population (ZIP)
- 15,356
- Household income
- $41,618
- Rent vs Own
- Severe rent burden
- 849.0
Population outlook (Peoria County) Hauer SSP2
- Today (2025)
- 183,007 people
- By 2030
- 179,643 · -1.8%
- By 2040
- 171,782 · -6.1%
- By 2050
- 163,508 · -10.7%
- By 2075
- 140,178 · -23.4%
- By 2100
- 114,493 · -37.4%
Race, ethnicity, and origin ACS 2023
- Neighborhood character
- Diverse neighborhood (Simpson 0.68)
- Race & ethnicity
- Black 43% White 36% Two or more races 12% Hispanic / Latino 10% Asian 1%
- Hispanic origin (detail)
- Mexican 7%
- Common ancestry
- Italian 2% Slovak 1% Lithuanian 1%
- Foreign-born
- 7% · Canada
- Languages at home
- 91% English-only · Spanish 6% Tagalog/Filipino 1%
Political lean MEDSL · Peoria
- 2024 margin
- Toss-up / Even · D 51.5% · R 46.9% · Other 1.6%
- 2008→2024 swing
- -9.2pp toward R · 2008: 13.9pp · 2024: 4.7pp
- All cycles
- 2024: D+4.7 2020: D+6.3 2016: D+2.8 2012: D+4.4 2008: D+13.9
Not yet ingested
- Civics
- —
Market trends
- HPI YoY
- ▼ -65.98%
- Current HPI
- 141.5343
- Rent YoY
- ▲ 3.49%
- Metro
- Peoria, IL
- State GDP YoY
- ▲ 1.59%
- F500 in state
- 60
Industry mix (Fortune 500 HQ in IL)
| Industry | F500 HQs | Revenue |
|---|---|---|
| Insurance | 4 | $201B |
|
||
| Consumer Goods | 4 | $87B |
|
||
| Industrial Machinery | 3 | $64B |
|
||
| Healthcare | 2 | $55B |
|
||
| Retail / Pharmacy | 1 | $148B |
|
||
| Agriculture / Food | 1 | $86B |
|
||
Price history
+225.0% since first listed2 events — show timeline
- 2026-05-30 Listed $130,000 RMLSA as Distributed by MLS Grid
- 1992-09-21 Sold (Public Records) $40,000 Public Records
Property tax history
-0.2%/yrLatest (2024): $1,208 · +4.8% YoY. Source: county tax records.
Cash-flow waterfall
monthlySold comps — $/sqft
last 12 mo · ≤1 miLoading sold comps…