3 E Reliance Ct · Mayflower, AR
Flood risk 1/10 · Minimal
- FEMA flood zone
- X (unshaded)
- Chance of flooding over 30 yrs
- 0.0%
- Est. flood insurance / yr
- $507 – $1,088
Fire risk 4/10 · Minor
- Est. fire insurance / yr
- $1,499 – $2,785
Heat risk 7/10 · Major
- Hot days now (above 111°F)
- 7 days/yr
- Hot days in 30 yrs
- 19 days/yr
Wind risk 3/10 · Minor
- Chance of severe wind over 30 yrs
- 7.0%
Air-quality risk 2/10 · Minimal
- Unhealthy air days now
- 0 days/yr
- Unhealthy air days in 30 yrs
- 1 days/yr
Risk factors via First Street. Map © Google.
Why this score? — see what drove the D+ grade
The composite is a weighted blend of 9 inputs, each scored 0–100. Each bar is that input's sub-score; the figure is the points it added to the 100-point composite (weight × sub-score).
- ARV discount +12.5/15.0
- Appreciation +9.8/10.0
- Cash flow +8.8/30.0
- 1% rule +3.1/10.0
- Schools +2.8/10.0
- Livability +2.8/5.0
- Rent growth +2.5/5.0
- Condition / age +2.5/5.0
- DSCR +2.4/10.0
$217,900
🖨 Deal sheet 📄 Offer letter ✓ Due diligence
Listing remarks
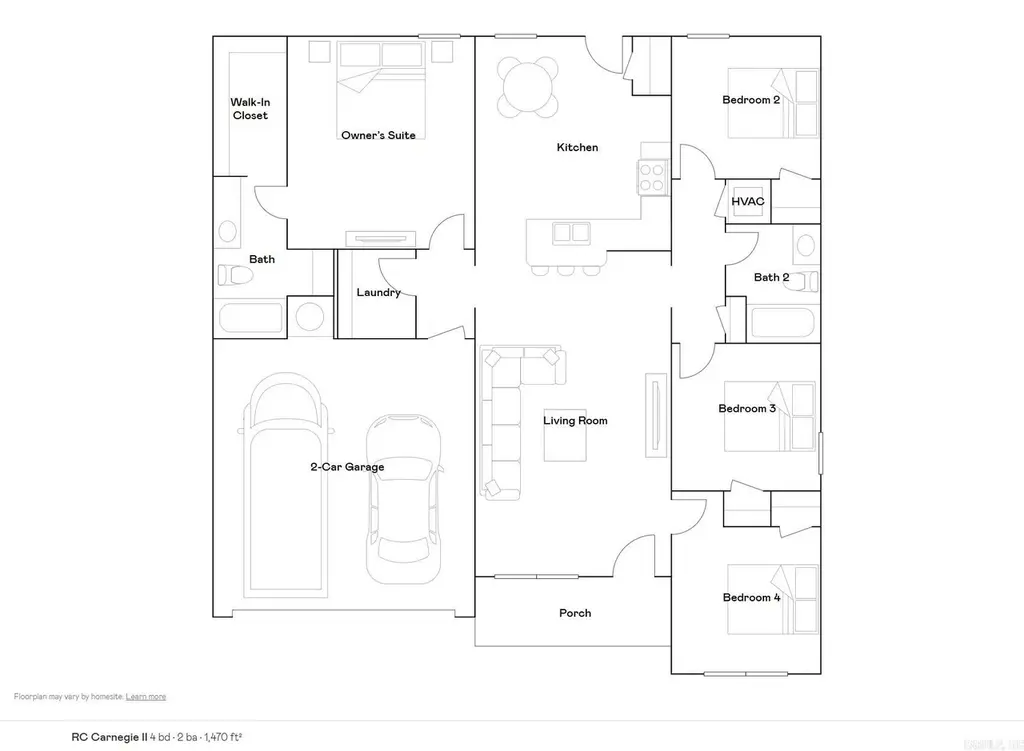
Discover the captivating Carnegie II plan, distinguished by its inviting covered entryway and beautifully landscaped front yard that exudes curb appeal. This thoughtfully designed home encompasses 4 bedrooms and 2 bathrooms, providing ample space for comfort and privacy. The spacious living room offers a welcoming environment for relaxation and gatherings. The kitchen is a chef's delight, equipped with energy-efficient appliances, abundant counterspace, and a convenient pantry for storage. The adjacent laundry room, situated just off the garage, ensures practicality for families of any size. The master suite includes a luxurious walk-in closet, enhancing the home's appeal and functionality.
Key facts
- 6,969 sq ft lot
- 2 garage spots
- Built 2026
Property features AI
Finance
- Financial info: Financing options include VA, FHA, conventional, cash, or Rural Development
- HOA & community: Annual association fee of $320; Additional fee of $200
Exterior
- Parking: Attached garage for 2 cars
- Utilities: Public sewer; Public water; Municipal electric (Entergy); All underground utilities
- Home design: Single-family home; Inside city limits
- Construction: Built by Lennar Homes of Arkansas, LLC; Slab foundation; Composition roof with 3-tab shingles
- Exterior features: Brick and frame exterior with metal/vinyl siding; Level lot in a subdivision; Paved road access; Lot roughly 60 x 115 (0.16 acre); New construction
Interior
- Kitchen: Free-standing stove; Electric range; Dishwasher; Disposal; Pantry
- Flooring: Carpet; Luxury vinyl
- Bathrooms: 2 full bathrooms
- Heating & cooling: Heat pump
- Interior features: Washer connection; Electric dryer connection; Electric water heater; Smoke detectors
- Laundry & utility: Laundry room
Neighborhood map
What this means for you Summary
Snapshot
- This is a 4-bed/2.0-bath single-family listed at $218k.
Deal economics
- At list price, monthly cash flow is $-178 ($-2k/yr) — negative.
- To cash-flow at today's rent, offer at most $187k (14.4% below list).
- To meet the 1% rule (rent ≥ 1% of price), the offer needs to be $177k (18.9% below list).
- Recommended offer: $177k (18.9% below list) — sets the bar for 1% rule.
Location & tenants
- Location reads 56/100 on livability (#390 in AR) — a working-class tenant base; expect higher turnover. Strengths: cost of living A+, housing B+; Watch: schools F, crime F, amenities F.
- Mayflower School District (rural): math 32% / reading 34% proficiency, ranked #127 of 238 in AR (top 53%) — families likely to look elsewhere, expect single-tenant / working-renter base with shorter leases.
- Market conditions: 110 active listings in the ZIP; 9 comparable units currently listed for rent nearby; rentals lingering (median 44d on market — plan ~5-8 weeks vacancy on turnover, expect pricing pressure); 56% of comp listings sitting > 30 days — soft ceiling on asking rent; 865 units permitted in Faulkner County in 2024 (451 in 5+ unit buildings).
Forward outlook
- In year one you build about $22k of equity ($2k loan paydown + $21k appreciation (9.6% local appreciation)).
- Faulkner County population projected at +32% by 2050 — long-run rental-demand tailwind backs the buy-and-hold thesis.
- By year 2, paydown + projected appreciation supports a ~$36k cash-out refi (75% LTV) — recoverable capital for the next deal without selling this one.
Negotiation context
- Only 4 days on market — expect competitive offers; lowballing is unlikely to land.
Risks & watch-outs
- Climate carrying-cost: extreme-heat days projected 7→19/yr by 2055 (HVAC capex compounding) — expect insurance premiums to compound above CPI over the hold.
Questions for the listing agent
- What do current leases actually rent for vs. the listed asking? Can we see a recent rent roll and the last 12 months of T-12 income?
- What does the HOA fee cover, when was the last increase, and are there any pending special assessments or reserve-fund shortfalls?
- Is there a deadline driving the sale (1031 exchange, divorce, estate, relocation)? That informs how much negotiation room exists.
- Schools are F-rated, which usually means shorter tenancies and higher turnover. Who's the typical renter profile here, and what's been the actual vacancy rate?
- Crime grade is F in this area — have there been break-ins, vandalism, or insurance claims at this property in the last 3 years? What carrier currently insures it and at what premium?
- The area grade is low — what's the realistic commute time and amenity access for the typical tenant pool here? Any planned neighborhood developments (good or bad) we should know about?
- What's the average days-on-market for RENTAL listings here right now (not sales)? A rising rental-DOM trend means longer vacancies and softer asking-rent achievability than the comps imply.
- What's the recent tenant-quality profile in this submarket — average credit score on applications, eviction rate, late-payment / NSF rate, and stable-employment percentage? A property-management company in the area should have these aggregated.
- How much new for-sale + rental construction is in the pipeline within 1–3 miles? Heavy new supply typically softens prices + rents 12–24 months out; constrained supply supports both.
Investment metrics
- 1% rule
- 0.81% ✗
- Cap rate
- 5.32%
- Cash-on-cash
- -3.49%
- DSCR
- 0.84
- GRM
- 10.3
CMA / ARV
- ARV (median comp)
- $245,228
- List price
- $217,900
- Delta
- -11.14%
- Verdict
- UNDERPRICED
- Comps
- 20 within 1.0 mi
Show comp detail 12 sales within ~0.75 mi
| Address | Dist | Beds/Ba | Sqft | Sold | Price | $/sf | Match |
|---|---|---|---|---|---|---|---|
| 108 E Sunbelt Ct | 0.09mi | 4/2.0 | 1,858 (+0%) | 1mo | $252,000 | $136 | 95 |
| 19 Vineyard Dr | 0.15mi | 4/2.0 | 1,852 (-0%) | 0mo | $236,900 | $128 | 92 |
| 105 E Sunbelt Ct | 0.10mi | 4/2.0 | 1,858 (+0%) | 3mo | $235,000 | $126 | 92 |
| 117 E Sunbelt Ct | 0.16mi | 4/2.0 | 1,858 (+0%) | 2mo | $245,000 | $132 | 90 |
| 102 E Fredonia Ct | 0.11mi | 4/2.0 | 1,897 (+2%) | 2mo | $262,000 | $138 | 90 |
| 113 E Sunbelt Ct | 0.13mi | 4/2.0 | 1,897 (+2%) | 2mo | $258,500 | $136 | 89 |
| 107 E Sunbelt Ct | 0.10mi | 4/2.0 | 1,897 (+2%) | 3mo | $254,000 | $134 | 89 |
| 101 E Fredonia Ct | 0.13mi | 4/2.0 | 1,655 (-11%) | 1mo | $232,000 | $140 | 75 |
| 3 Vineyard Dr | 0.21mi | 4/2.0 | 1,655 (-11%) | 2mo | $211,000 | $127 | 70 |
| 4 Concord Rd | 0.03mi | 3/2.0 (-1) | 1,600 (-14%) | 1mo | $269,900 | $169 | 70 |
| 109 E Sunbelt Ct | 0.11mi | 3/2.0 (-1) | 1,646 (-11%) | 3mo | $236,500 | $144 | 69 |
| 22 Ledrick Cir | 0.51mi | 3/2.0 (-1) | 1,648 (-11%) | 3mo | $264,400 | $160 | 50 |
Match score weights: distance 35% · size 25% · config 20% · recency 20%. Top-matched comps best support the ARV.
Projected returns pro-forma
9.62% appreciation · 3.0% rent growth · sell at horizon
- IRR
- 21.0%
- Equity multiple
- 2.67×
- Total profit
- $101,751
- Equity at exit
- $190,255
- IRR
- 19.1%
- Equity multiple
- 6.04×
- Total profit
- $307,256
- Equity at exit
- $404,024
Cash invested: $61,012 (down + closing). Projections, not guarantees.
Landlord ↔ Tenant lean methodology
- Overall (STATE)
- 92 Strongly Landlord-Friendly
- State Arkansas
- 92 Strongly Landlord-Friendly · R+14
- County
- — inherits STATE
- City
- — inherits STATE
ZIP-level market 72106
- Home prices YoY
- 4.2%
- Active inventory
- 110
- Price-to-rent
- 10.3×
Monthly cashflow live
- Estimated rent
- $1,767 high interval (Pro) →
- Mortgage (P&I)
- −$1,143
- Tax from tax record
- −$113 /mo · $1,360/yr
- Insurance
- −$91
- HOA
- −$227
- Vacancy / Maint / Mgmt
- −$371
- Net cashflow
- $-178
Break-even live
UW: 25.0% down · 7.5% · 30yr · 1.5% tax · 5.0% vac · 8.0% maint · 8.0% mgmt
Financing live
Cash to close
- Down payment
- $54,475
- Closing costs
- $6,537
- Reserves months
- —
- Total cash needed
- —
Loan-product check · same deal, 3 products live
Conventional
25% down · 7.5% · 30yr
- Down + closing
- —
- Monthly P&I
- —
- Monthly cashflow
- —
- DSCR
- —
- Eligible?
- —
Personal DTI + credit; lowest rate.
DSCR
20% down · 8.5% · 30yr
- Down + closing
- —
- Monthly P&I
- —
- Monthly cashflow
- —
- DSCR
- —
- Eligible?
- —
No personal income docs; deal must DSCR.
Hard money
10% down · 12.0% · 12mo
- Down + closing
- —
- Monthly P&I
- —
- Monthly cashflow
- —
- DSCR
- —
- Eligible?
- —
Short-term bridge; refi at stabilization.
Rent comps 9 comps
| Address | Beds | Baths | Sqft | Rent | $/sqft | DOM | Units | Dist |
|---|---|---|---|---|---|---|---|---|
| 110 Sunbelt Ct Mayflower, AR | 4.0 | 2.0 | 1897 | $1,750 | $0.92 | 43d | 1 | 0.10mi |
| 104 E Fredonia Ct Mayflower, AR | 4.0 | 2.0 | 1476 | $1,750 | $1.19 | 43d | 1 | 0.11mi |
| 101 E Fredonia Ct Mayflower, AR | 4.0 | 2.0 | 1655 | $1,923 | $1.16 | 14d | 1 | 0.13mi |
| 103 E Fredonia Ct Mayflower, AR | 3.0 | 2.0 | 1364 | $1,650 | $1.21 | 14d | 1 | 0.14mi |
| 17 Vineyard Dr Mayflower, AR | 4.0 | 2.0 | 1655 | $1,850 | $1.12 | 14d | 1 | 0.16mi |
| 11 Vineyard Dr Mayflower, AR | 3.0 | 2.0 | 1364 | $1,650 | $1.21 | 43d | 1 | 0.18mi |
| 7 Vineyard Dr Mayflower, AR | 4.0 | 2.0 | 1476 | $1,750 | $1.19 | 43d | 1 | 0.20mi |
| 5 Vineyard Dr Mayflower, AR | 3.0 | 2.0 | 1364 | $1,650 | $1.21 | 43d | 1 | 0.20mi |
| 3 Vineyard Dr Mayflower, AR | 4.0 | 2.0 | 1655 | $1,850 | $1.12 | 14d | 1 | 0.21mi |
HOA detail
- Monthly dues
- $227 · $2,724/yr
Listing history 2 events
-
2026-05-11status Under Contract 827-char remark
-
2026-05-07$217,900 New Listing 827-char remark
ⓘ Source: listings_history table (triggers on properties + properties_extension) + one-shot
backfill from property_details.listing_events for pre-trigger history.
Tax reassessment forecast AR · Resets to sale price
- Current annual tax
- $1,360 · $113/mo
- Projected year-2 tax
- $1,395 · $116/mo
- Expected delta
- +$34/yr (+$3/mo · 2.5%)
ⓘ Screening estimate from a state-policy table — verify with the county assessor before closing.
Climate risk First Street
- Flood 1/10 Low FEMA zone X (unshaded) · 0% chance over 30 yrs
- Wildfire 4/10 Moderate
- Heat 7/10 Severe 7 d/yr ≥111°F today · 19 d/yr by 30 yrs out
- Wind 3/10 Moderate 7% chance of damaging wind over 30 yrs
- Air quality 2/10 Low 0 unhealthy d/yr today · 1 by 30 yrs out
Nearby sold comps map
Loading sold comps map…
Walkable amenities ~0.75 mi
Loading nearby amenities…
Taxation est. · year 1
- Rental income
- $21,210
- − Mortgage interest
- −$12,206
- − Property taxes
- −$1,360
- − Insurance
- −$1,090
- − Repairs & maintenance
- −$1,697
- − Management
- −$1,697
- − HOA
- −$2,724
- − Depreciation
- −$6,339
- Taxable loss
- −$5,902
- Est. tax savings @ 24.0%
- +$1,417
- After-tax cash flow
- $-714/yr
For passive investors: Depreciation is non-cash, so a rental often shows a tax loss while cash-flowing — sheltering income. Rental losses are passive: they offset passive income freely, and up to $25,000/yr can offset ordinary (W-2) income if you actively participate and your MAGI is under $100k (phasing out to $0 by $150k); unused losses carry forward. On sale, claimed depreciation is recaptured at up to 25%, and gains may owe capital-gains tax (a 1031 exchange can defer both). Figures are a year-1 estimate at your 24.0% rate — not tax advice; consult a CPA.
Schools (NCES district)
- District
- Mayflower School District
- NCES district ID
- 0509540
- Math proficiency
- 32% ▼ -9.00%
- Reading proficiency
- 34% ▼ -6.00%
- Median HH income
- $47,119
- Composite
- 28.41/100
- National rank
- #6760
- State rank
- #127 of 238 in AR
Livability — Mayflower
- Score
- 56/100
- State rank
- #390
- US rank
- #22893
Category grades
Schools grade is shown separately in the Schools card above.
Census & demographics
- Census place
- Mayflower, AR
- Population (ZIP)
- 5,719
Population outlook (Faulkner County) Hauer SSP2
- Today (2025)
- 138,985 people
- By 2030
- 148,264 · +6.7%
- By 2040
- 166,010 · +19.4%
- By 2050
- 183,362 · +31.9%
- By 2075
- 224,593 · +61.6%
- By 2100
- 250,603 · +80.3%
Race, ethnicity, and origin ACS 2023
- Neighborhood character
- Predominantly White (86%)
- Race & ethnicity
- White 86% Two or more races 7% Black 6% Hispanic / Latino 1%
- Common ancestry
- Slovak 3% Lithuanian 1% Italian 1%
- Foreign-born
- 6% · Canada
Political lean MEDSL · Faulkner
- 2024 margin
- Solid R (+32.3) · D 32.6% · R 64.9% · Other 2.5%
- 2008→2024 swing
- -7.1pp toward R · 2008: -25.3pp · 2024: -32.3pp
- All cycles
- 2024: R+32.3 2020: R+29.5 2016: R+31.6 2012: R+31.7 2008: R+25.3
Not yet ingested
- Civics
- —
Market trends
- HPI YoY
- ▲ 9.62%
- Current HPI
- 236.6197
- Rent YoY
- —
- Metro
- —
- State GDP YoY
- ▲ 3.80%
- F500 in state
- 10
Industry mix (Fortune 500 HQ in AR)
| Industry | F500 HQs | Revenue |
|---|---|---|
| Retail | 1 | $681B |
|
||
| Food / Agriculture | 1 | $53B |
|
||
| Retail / Energy | 1 | $22B |
|
||
| Transportation / Logistics | 1 | $12B |
|
||
| Energy | 1 | $4B |
|
||
Price history
2 events — show timeline
- 2026-05-11 Pending — CARMLS
- 2026-05-07 Listed $217,900 CARMLS
Property tax history
+0.9%/yrLatest (2025): $1,360 · +1.1% YoY. Source: county tax records.
Cash-flow waterfall
monthlySold comps — $/sqft
last 12 mo · ≤1 miLoading sold comps…