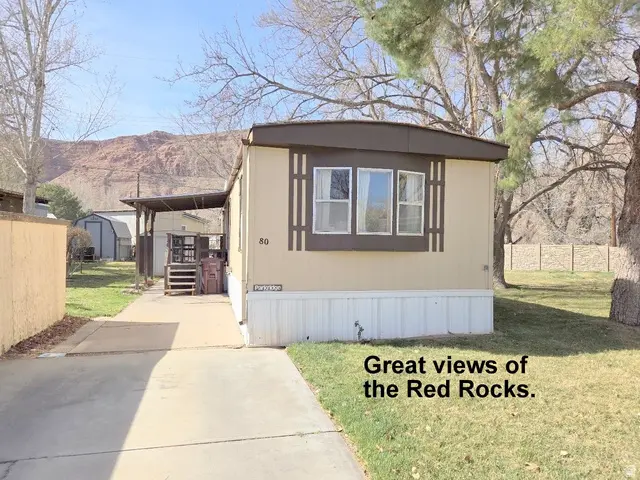
80 400 N. 500 W · Moab, UT
Flood risk 1/10 · Minimal
- FEMA flood zone
- X (shaded)
- Chance of flooding over 30 yrs
- 0.0%
- Est. flood insurance / yr
- $473 – $860
Fire risk 5/10 · Moderate
- Est. fire insurance / yr
- $453 – $841
Heat risk 6/10 · Moderate
- Hot days now (above 99°F)
- 7 days/yr
- Hot days in 30 yrs
- 19 days/yr
Wind risk 1/10 · Minimal
- Chance of severe wind over 30 yrs
- —
Air-quality risk 1/10 · Minimal
- Unhealthy air days now
- 0 days/yr
- Unhealthy air days in 30 yrs
- 0 days/yr
Risk factors via First Street. Map © Google.
Why this score? — see what drove the B grade
The composite is a weighted blend of 9 inputs, each scored 0–100. Each bar is that input's sub-score; the figure is the points it added to the 100-point composite (weight × sub-score).
- Cash flow +30.0/30.0
- 1% rule +10.0/10.0
- DSCR +10.0/10.0
- ARV discount +7.5/15.0
- Livability +3.6/5.0
- Appreciation +3.1/10.0
- Rent growth +2.5/5.0
- Schools +2.5/10.0
- Condition / age +2.2/5.0
$60,000
🖨 Deal sheet 📄 Offer letter ✓ Due diligence
Listing remarks MLS
There are no remarks available.
Key facts
- Exercise gym
- Basketball court
- Secure mail boxes
Tags
Property features AI
Finance
- HOA & community: Clubhouse; Located in the Grand Oasis subdivision (park rules and application required for space rental agreement)
Exterior
- Parking: Uncovered open parking
- Utilities: Natural gas connected; Electricity connected; Public sewer connected; Culinary water connected
- Home design: Mobile home; Built/standing condition; Pitched roof; Faces east; Residential use
- Construction: Composition exterior material
- Exterior features: Bay box windows; Covered deck; Open porch; Outbuildings; Fenced in-ground pool; Red Rock view; Road is paved; Mature trees; Single-level living accessibility
Interior
- Kitchen: Refrigerator; Range hood; Free-standing range/oven
- Bedrooms: Two main-level bedrooms; Primary bedroom on the 1st floor
- Flooring: Carpet; Linoleum
- Bathrooms: Two full bathrooms
- Heating & cooling: Central gas heating; Evaporative cooling
- Interior features: Free-standing range/oven; Blinds and drapes; Window coverings; 7 total rooms; No basement
- Laundry & utility: Washer; Dryer; Storage shed(s)
Neighborhood map
What this means for you Summary
Snapshot
- This is a 2-bed/2.0-bath manufactured listed at $60k. Condition is rated fair.
Deal economics
- At list price, monthly cash flow is $1k ($17k/yr) — positive.
- The deal already cash-flows at list — no discount required.
- Meets the 1% rule at list price ($2k rent vs $60k).
- Recommended offer: $55k (9.0% below list) — sets the bar for market timing.
Location & tenants
- Location reads 71/100 on livability (#89 in UT) — a middle-class / working-renter tenant base. Strengths: amenities A+, health & safety A+, cost of living B; Watch: employment D, crime F, commute F.
- Grand District (town): math 27% / reading 31% proficiency, ranked #71 of 80 in UT (top 89%) — low school quality limits family demand, transient renter base, plan for 1-2y turnover.
- Zoned schools: Helen M. Knight School (math 30% / reading 28%, grade F, #444 of 585 statewide, top 77%, 732 students, 49% FRL); Grand County High (math 22% / reading 47%, grade F, #95 of 171 statewide, top 61%, 461 students, 36% FRL) — zoned schools at 42% FRL track the district average.
- Market conditions: 237 active listings in the ZIP; 2 comparable units currently listed for rent nearby; 238 units permitted in Grand County in 2024 (100 in 5+ unit buildings).
Forward outlook
- Local home prices are declining (-3.0%/yr); year-one equity from $415 of loan paydown is wiped out by about $2k of value loss. Plan a longer hold.
- Grand County population projected at +10% by 2050 — modest demand growth; plan on rents tracking national, not racing it.
- At projected returns (-3.0% appreciation + 3.0% rent growth), your $17k cash investment doubles in ~2 years — after that, you're playing with house money.
Negotiation context
- It's been on market 94 days — a 9% lower offer ($55k) is reasonable based on typical stale-listing flexibility.
- 13 sale attempts since 16y ago; this cycle's ask has dropped $20k (25%) from the opening price — seller is motivated, your offer sets the floor, not the list.
Risks & watch-outs
- Watch-outs: property tax is 4.1% of price.
- Climate carrying-cost: moderate wildfire risk; extreme-heat days projected 7→19/yr by 2055 (HVAC capex compounding) — expect insurance premiums to compound above CPI over the hold.
Questions for the listing agent
- It's been on market 94 days. Have you received any prior offers? Is the seller open to a 9% concession, seller financing, or rate buy-down credit?
- Have any recent inspections been done? Can we get a copy of the seller's disclosures and any deferred-maintenance estimates?
- Property tax is high relative to price — has the assessment been appealed recently, and will the sale trigger a re-assessment?
- Why hasn't it sold? Are there any deal-killer items the seller is aware of (foundation, flood, title, zoning, code violations)?
- Is there a deadline driving the sale (1031 exchange, divorce, estate, relocation)? That informs how much negotiation room exists.
- Crime grade is F in this area — have there been break-ins, vandalism, or insurance claims at this property in the last 3 years? What carrier currently insures it and at what premium?
- What's the average days-on-market for RENTAL listings here right now (not sales)? A rising rental-DOM trend means longer vacancies and softer asking-rent achievability than the comps imply.
- What's the recent tenant-quality profile in this submarket — average credit score on applications, eviction rate, late-payment / NSF rate, and stable-employment percentage? A property-management company in the area should have these aggregated.
- How much new for-sale + rental construction is in the pipeline within 1–3 miles? Heavy new supply typically softens prices + rents 12–24 months out; constrained supply supports both.
Investment metrics
- 1% rule
- 4.06% ✓
- Cap rate
- 33.91%
- Cash-on-cash
- 98.64%
- DSCR
- 5.39
- GRM
- 2.1
CMA / ARV
No comps found within radius.
Projected returns pro-forma
-3.0% appreciation · 3.0% rent growth · sell at horizon
- IRR
- 99.7%
- Equity multiple
- 5.66×
- Total profit
- $78,347
- Equity at exit
- $8,946
- IRR
- —
- Equity multiple
- 11.83×
- Total profit
- $181,948
- Equity at exit
- $5,188
Cash invested: $16,800 (down + closing). Projections, not guarantees.
Landlord ↔ Tenant lean methodology
- Overall (STATE)
- 86 Strongly Landlord-Friendly
- State Utah
- 86 Strongly Landlord-Friendly · R+15
- County
- — inherits STATE
- City
- — inherits STATE
ZIP-level market 84532
- Home prices YoY
- -0.5%
- Active inventory
- 237
- Price-to-rent
- 2.1×
Monthly cashflow live
- Estimated rent
- $2,435 medium interval (Pro) →
- Mortgage (P&I)
- −$315
- Tax from tax record
- −$203 /mo · $2,439/yr
- Insurance
- −$25
- HOA
- −$0
- Vacancy / Maint / Mgmt
- −$511
- Net cashflow
- $1,381
Break-even live
UW: 25.0% down · 7.5% · 30yr · 1.5% tax · 5.0% vac · 8.0% maint · 8.0% mgmt
Financing live
Cash to close
- Down payment
- $15,000
- Closing costs
- $1,800
- Reserves months
- —
- Total cash needed
- —
Loan-product check · same deal, 3 products live
Conventional
25% down · 7.5% · 30yr
- Down + closing
- —
- Monthly P&I
- —
- Monthly cashflow
- —
- DSCR
- —
- Eligible?
- —
Personal DTI + credit; lowest rate.
DSCR
20% down · 8.5% · 30yr
- Down + closing
- —
- Monthly P&I
- —
- Monthly cashflow
- —
- DSCR
- —
- Eligible?
- —
No personal income docs; deal must DSCR.
Hard money
10% down · 12.0% · 12mo
- Down + closing
- —
- Monthly P&I
- —
- Monthly cashflow
- —
- DSCR
- —
- Eligible?
- —
Short-term bridge; refi at stabilization.
Rent comps 2 comps
| Address | Beds | Baths | Sqft | Rent | $/sqft | DOM | Units | Dist |
|---|---|---|---|---|---|---|---|---|
| 792 W 400 N Unit 1 Moab, UT | 3.0 | 2.5 | 1550 | $2,500 | $1.61 | 23d | 1 | 0.25mi |
| 724 Westwood Ave Moab, UT | 3.0 | 1.0 | 1409 | $2,200 | $1.56 | 13d | 1 | 0.83mi |
Listing history 40 events
-
2026-06-19days on market $60,000 Active 94 DOM
-
2026-06-18days on market $60,000 Active 93 DOM
-
2026-06-17days on market $60,000 Active 92 DOM
-
2026-06-16days on market $60,000 Active 91 DOM
-
2026-06-15days on market $60,000 Active 90 DOM
-
2026-06-14days on market $60,000 Active 88 DOM
-
2026-06-13days on market $60,000 Active 87 DOM
-
2026-06-10days on market $60,000 Active 85 DOM
-
2026-06-09days on market $60,000 Active 84 DOM
-
2026-06-08days on market $60,000 Active 83 DOM
-
2026-06-07days on market $60,000 Active 82 DOM
-
2026-06-05days on market $60,000 Active 79 DOM
-
2026-06-03days on market $60,000 Active 78 DOM
-
2026-06-02days on market $60,000 Active 77 DOM
-
2026-06-01days on market $60,000 Active 76 DOM
-
2026-05-31days on market $60,000 Active 75 DOM
-
2026-05-30days on market $60,000 Active 74 DOM
-
2026-05-04price $60,000
-
2026-03-17$80,000 Active
-
2025-06-04soldstatus Closed 31-char remark
Show marketing remark (31 chars)
There are no remarks available.
-
2025-05-15historical
-
2025-05-13historical Backup 31-char remark
Show marketing remark (31 chars)
There are no remarks available.
-
2025-04-22$150,000 Active
-
2025-03-28$66,500 Active 31-char remark
Show marketing remark (31 chars)
There are no remarks available.
-
2024-12-04status Under Contract
-
2024-12-04historical
-
2024-11-25$40,000 Active
-
2020-10-23$85,000
-
2018-07-10$72,000
-
2018-03-14soldstatus
-
2018-02-05$67,300
-
2017-12-18$76,000
-
2015-08-16$32,000
-
2015-06-15historical
-
2015-02-04$75,000
-
2012-06-05historical
-
2012-01-05$64,000
-
2011-10-05$32,500
-
2011-08-01soldstatus
-
2010-12-09$32,000
ⓘ Source: listings_history table (triggers on properties + properties_extension) + one-shot
backfill from property_details.listing_events for pre-trigger history.
Tax reassessment forecast UT · Resets to sale price
- Current annual tax
- $2,439 · $203/mo
- Projected year-2 tax
- $2,439 · $203/mo
- Expected delta
- $0/yr ($0/mo · 0.0%)
ⓘ Screening estimate from a state-policy table — verify with the county assessor before closing.
Climate risk First Street
- Flood 1/10 Low FEMA zone X (shaded) · 0% chance over 30 yrs
- Wildfire 5/10 Major
- Heat 6/10 Major 7 d/yr ≥99°F today · 19 d/yr by 30 yrs out
- Wind 1/10 Low
- Air quality 1/10 Low 0 unhealthy d/yr today · 0 by 30 yrs out
Nearby sold comps map
Loading sold comps map…
Walkable amenities ~0.75 mi
Loading nearby amenities…
Taxation est. · year 1
- Rental income
- $29,224
- − Mortgage interest
- −$3,361
- − Property taxes
- −$2,439
- − Insurance
- −$300
- − Repairs & maintenance
- −$2,338
- − Management
- −$2,338
- − Depreciation
- −$1,745
- Taxable income
- $16,702
- Est. tax owed @ 24.0%
- −$4,008
- After-tax cash flow
- $12,563/yr
For passive investors: Depreciation is non-cash, so a rental often shows a tax loss while cash-flowing — sheltering income. Rental losses are passive: they offset passive income freely, and up to $25,000/yr can offset ordinary (W-2) income if you actively participate and your MAGI is under $100k (phasing out to $0 by $150k); unused losses carry forward. On sale, claimed depreciation is recaptured at up to 25%, and gains may owe capital-gains tax (a 1031 exchange can defer both). Figures are a year-1 estimate at your 24.0% rate — not tax advice; consult a CPA.
Condition & rehab AI · 12 photos
This manufactured home requires moderate renovations to update the kitchen and bathrooms, and the addition of central air conditioning to increase its value.
Repairs flagged
- Moderate kitchen cabinets — dated and worn
- Moderate bathroom cabinets — dated and worn
- Major HVAC system — no AC
Value-add opportunities
- Resale update kitchen cabinets and appliances — modernizing the kitchen
- Resale update bathrooms with new fixtures and cabinets — modernizing the bathrooms
- Both install central air conditioning — increases comfort and appeal
Renovation cost estimate screening
| Repair item | Severity | Est. cost |
|---|---|---|
| kitchen cabinets · dated and worn | Moderate | $3,000–15,000 |
| bathroom cabinets · dated and worn | Moderate | $3,000–15,000 |
| HVAC system · no AC | Major | $15,000–50,000 |
| Total estimated repair cost · 3 items | $21,000–80,000 |
Value-add ROI direction
- Resale update kitchen cabinets and appliances — modernizing the kitchen ↑
- Resale update bathrooms with new fixtures and cabinets — modernizing the bathrooms ↑
- Both install central air conditioning — increases comfort and appeal ↑
ⓘ Cost ranges are severity-bucket heuristics (US national rule-of-thumb). Get contractor quotes + a written scope before underwriting a rehab budget.
Schools (NCES district)
- District
- Grand District
- NCES district ID
- 4900330
- Math proficiency
- 27% ▼ -7.00%
- Reading proficiency
- 31% ▼ -8.00%
- Median HH income
- $43,188
- Composite
- 24.71/100
- National rank
- #7611
- State rank
- #71 of 80 in UT
Livability — Moab
- Score
- 71/100
- State rank
- #89
- US rank
- #7233
Category grades
Schools grade is shown separately in the Schools card above.
Census & demographics
- Census place
- Moab, UT
- Population (ZIP)
- 10,648
Population outlook (Grand County) Hauer SSP2
- Today (2025)
- 10,228 people
- By 2030
- 10,507 · +2.7%
- By 2040
- 10,897 · +6.5%
- By 2050
- 11,243 · +9.9%
- By 2075
- 12,309 · +20.3%
- By 2100
- 13,202 · +29.1%
Race, ethnicity, and origin ACS 2023
- Neighborhood character
- Predominantly White (81%)
- Race & ethnicity
- White 81% Hispanic / Latino 11% Two or more races 5% Native American 4% Pacific Islander 1% Asian 1%
- Hispanic origin (detail)
- Mexican 9%
- Common ancestry
- Slovak 4% Portuguese 2% Romanian 2%
- Foreign-born
- 7% · Canada
- Languages at home
- 90% English-only · Spanish 5% Other Indo-European 1% Other Asian/Pacific 1%
Political lean MEDSL · Grand
- 2024 margin
- Lean D (+9.4) · D 53.4% · R 43.9% · Other 2.7%
- 2008→2024 swing
- +4.6pp toward D · 2008: 4.8pp · 2024: 9.4pp
- All cycles
- 2024: D+9.4 2020: D+10.8 2016: R+0.0 2012: R+6.3 2008: D+4.8
Not yet ingested
- Civics
- —
Market trends
- HPI YoY
- ▼ -3.84%
- Current HPI
- 734.29
- Rent YoY
- —
- Metro
- —
- State GDP YoY
- ▲ 3.54%
- F500 in state
- 2
Industry mix (Fortune 500 HQ in UT)
| Industry | F500 HQs | Revenue |
|---|---|---|
| Financial Services | 1 | $3B |
|
||
Price history
+87.5% since first listed23 events — show timeline
- 2026-05-04 Price Changed $60,000 WFRMLS
- 2026-03-17 Listed $80,000 WFRMLS
- 2025-06-04 Sold (MLS) — WFRMLS
- 2025-05-15 Listing Removed — WFRMLS
- 2025-05-13 Contingent — WFRMLS
- 2025-04-22 Listed $150,000 WFRMLS
- 2025-03-28 Listed $66,500 WFRMLS
- 2024-12-04 Pending — WFRMLS
- 2024-12-04 Listing Removed — WFRMLS
- 2024-11-25 Listed $40,000 WFRMLS
- 2020-10-23 Listed $85,000 WFRMLS
- 2018-07-10 Listed $72,000 WFRMLS
- 2018-03-14 Sold (MLS) — WFRMLS
- 2018-02-05 Listed $67,300 WFRMLS
- 2017-12-18 Listed $76,000 WFRMLS
- 2015-08-16 Listed $32,000 WFRMLS
- 2015-06-15 Listing Removed — WFRMLS
- 2015-02-04 Listed $75,000 WFRMLS
- 2012-06-05 Listing Removed — WFRMLS
- 2012-01-05 Listed $64,000 WFRMLS
- 2011-10-05 Listed $32,500 WFRMLS
- 2011-08-01 Sold (MLS) — WFRMLS
- 2010-12-09 Listed $32,000 WFRMLS
Property tax history
+21.6%/yrLatest (2025): $2,439 · -3.1% YoY. Source: county tax records.
Cash-flow waterfall
monthlySold comps — $/sqft
last 12 mo · ≤1 miLoading sold comps…