 Duplex
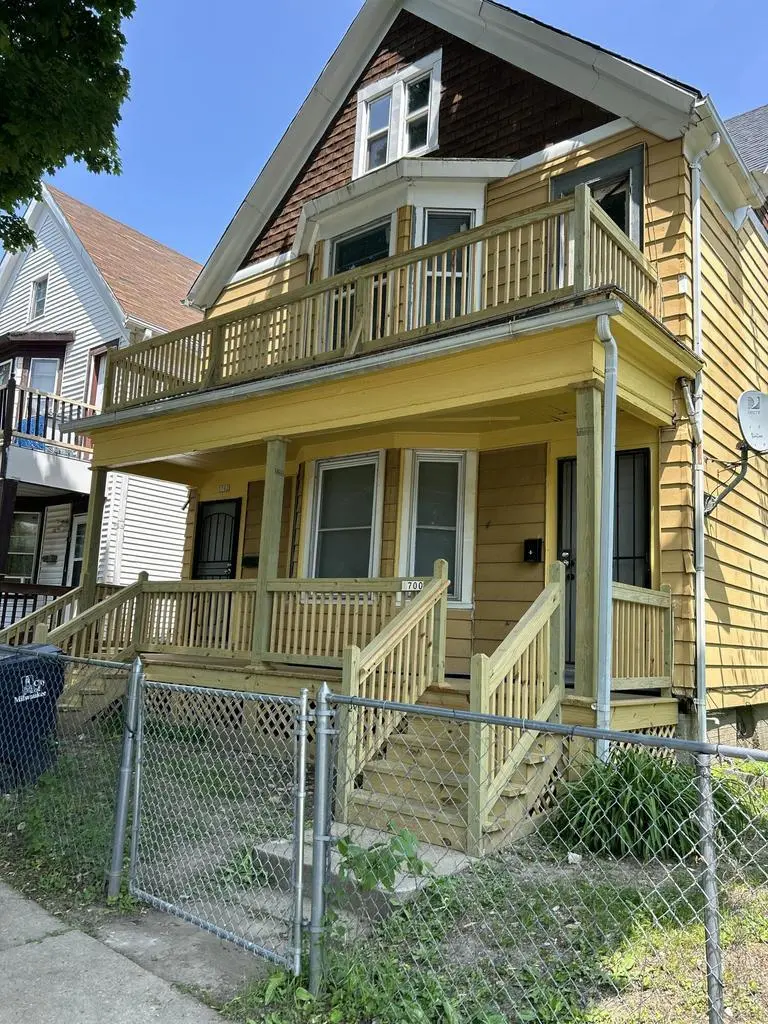
1700 N 28th St #1702 · Milwaukee, WI
Flood risk 1/10 · Minimal
- FEMA flood zone
- X (unshaded)
- Chance of flooding over 30 yrs
- 0.0%
- Est. flood insurance / yr
- $473 – $860
Fire risk 1/10 · Minimal
- Est. fire insurance / yr
- $636 – $1,182
Heat risk 2/10 · Minimal
- Hot days now (above 98°F)
- 7 days/yr
- Hot days in 30 yrs
- 13 days/yr
Wind risk 2/10 · Minimal
- Chance of severe wind over 30 yrs
- —
Air-quality risk 3/10 · Minor
- Unhealthy air days now
- 3 days/yr
- Unhealthy air days in 30 yrs
- 4 days/yr
Risk factors via First Street. Map © Google.
Why this score? — see what drove the B grade
The composite is a weighted blend of 9 inputs, each scored 0–100. Each bar is that input's sub-score; the figure is the points it added to the 100-point composite (weight × sub-score).
- Cash flow +30.0/30.0
- DSCR +10.0/10.0
- 1% rule +9.0/10.0
- ARV discount +7.5/15.0
- Rent growth +5.0/5.0
- Livability +4.0/5.0
- Condition / age +3.8/5.0
- Schools +1.2/10.0
- Appreciation +0.0/10.0
$174,000
🖨 Deal sheet 📄 Offer letter ✓ Due diligence
Multi-family units
County records classify this as Multi-Family (2-4 Unit). Listing-text estimate: 2 units. confirmed
Listing remarks MLS
Add this great duplex to your investment portfolio. Both units are currently vacant. Features include 3 bedrooms, 1 full bath in each unit. This one won't last long!
Key facts
- 2,613 sq ft lot
- Built 1907
- Listed 45 days
Property features AI
Finance
- Other: Property acreage less than 1/2 acre (approx. 0.06 acre)
Exterior
- Utilities: Municipal water; Municipal sewer
- Home design: Duplex, 2-story multi-family property; Zoning: RT4
- Construction: Assessor/public record lists year built (not specified)
- Exterior features: Aluminum/steel exterior
Interior
- Kitchen: Unit 2 kitchen located on upper level
- Bedrooms: Unit 1: 3 bedrooms; Unit 2: 3 bedrooms (master and other bedrooms on upper level)
- Bathrooms: Unit 1: 1 full bathroom; Unit 2: 1 full bathroom
- Interior features: Full basement
- Laundry & utility: 2 electric meters; 2 gas meters
Neighborhood map
What this means for you Summary
Snapshot
- This is a 2 × 3-bed/1.0-bath units multifamily listed at $174k. Condition is rated good.
Deal economics
- At list price, monthly cash flow is $726 ($9k/yr) — positive. Per door: $363/mo.
- The deal already cash-flows at list — no discount required.
- Meets the 1% rule at list price ($2k rent vs $174k).
- Recommended offer: $169k (3.0% below list) — sets the bar for market timing.
- Cap rate 11.3% vs local median 5.1% in Milwaukee — top-decile yield for the area; either an underpriced asset or a hidden risk that comps aren't pricing in. Stress-test before assuming the spread holds.
Location & tenants
- Location reads 81/100 on livability (#55 in WI, #1,534 nationally) — a professional / high-income tenant draw. Strengths: amenities A+, commute A+, cost of living A+; Watch: employment D+, schools F, crime F.
- Milwaukee School District (urban): math 10% / reading 18% proficiency, ranked #337 of 342 in WI (top 98%) — low school quality limits family demand, transient renter base, plan for 1-2y turnover; 77% free/reduced lunch — lower-income household profile, screen leases tightly.
- Market conditions: Rents rising fast (+10.8%/yr); 92 active listings in the ZIP; 3 comparable units currently listed for rent nearby; rentals at typical pace (median 15d on market — plan ~3-4 weeks tenant-placement turnaround); 1,017 units permitted in Milwaukee County in 2024 (803 in 5+ unit buildings).
- At $2,441/mo this rent would consume 56% of the median local household income ($53k/yr) (locally 1568% of renters already pay >50% of income on rent) — very limited rent-growth headroom before tenants either downsize or default.
Forward outlook
- Local home prices are declining (-3.0%/yr); year-one equity from $1k of loan paydown is wiped out by about $5k of value loss. Plan a longer hold.
- Milwaukee County population projected at +4% by 2050 — modest demand growth; plan on rents tracking national, not racing it.
- At projected returns (-3.0% appreciation + 8.0% rent growth), your $49k cash investment doubles in ~6 years — after that, you're playing with house money.
Negotiation context
- It's been on market 45 days — a 3% lower offer ($169k) is reasonable based on typical stale-listing flexibility.
- 4 sale attempts since 8y ago with the ask held roughly flat each time — persistent listings suggest the price (not the market) is what's stuck; bring a comps-based counter.
- Current owner paid $84k; list at $174k implies a 108% gain — meaningful room to come down on a strong offer.
Risks & watch-outs
- Watch-outs: built in 1907 — expect roof / HVAC / electrical / plumbing capex.
Questions for the listing agent
- It's been on market 45 days. Have you received any prior offers? Is the seller open to a 3% concession, seller financing, or rate buy-down credit?
- Can we see the unit-by-unit rent roll, current vacancy, and any below-market leases? What's the average tenancy length?
- What capital expenditures (roof, boiler, parking lot, exteriors) have been made in the last 5 years, and what's planned in the next 2?
- Built in 1907 — when were the roof, HVAC, electrical panel, plumbing, and water heater last replaced?
- Is there a deadline driving the sale (1031 exchange, divorce, estate, relocation)? That informs how much negotiation room exists.
- Schools are F-rated, which usually means shorter tenancies and higher turnover. Who's the typical renter profile here, and what's been the actual vacancy rate?
- Crime grade is F in this area — have there been break-ins, vandalism, or insurance claims at this property in the last 3 years? What carrier currently insures it and at what premium?
- What's the average days-on-market for RENTAL listings here right now (not sales)? A rising rental-DOM trend means longer vacancies and softer asking-rent achievability than the comps imply.
- What's the recent tenant-quality profile in this submarket — average credit score on applications, eviction rate, late-payment / NSF rate, and stable-employment percentage? A property-management company in the area should have these aggregated.
- How much new apartment / multifamily construction is in the pipeline within 1–3 miles? Heavy new supply (>2% of stock underway) typically softens rents 12–24 months out; light construction supports rent growth.
Investment metrics
- 1% rule
- 1.40% ✓
- Cap rate
- 11.30%
- Cash-on-cash
- 17.88%
- DSCR
- 1.80
- GRM
- 5.9
CMA / ARV
- ARV (median comp)
- $90,000
- List price
- $174,000
- Delta
- 93.33%
- Verdict
- OVERPRICED
- Comps
- 20 within 1.0 mi
Show comp detail 12 sales within ~0.75 mi
| Address | Dist | Beds/Ba | Sqft | Sold | Price | $/sf | Match |
|---|---|---|---|---|---|---|---|
| 1649 N 29th St #1651 | 0.09mi | 6/2.0 | 2,382 (+6%) | 6mo | $47,000 | $20 | 81 |
| 1302 N 26th St #1304 | 0.40mi | 6/2.0 | 2,318 (+3%) | 0mo | $210,900 | $91 | 76 |
| 2622 W Vine St #2624 | 0.17mi | 6/2.0 | 2,459 (+9%) | 4mo | $180,000 | $73 | 73 |
| 1800 N 36th St | 0.50mi | 6/2.0 | 2,320 (+3%) | 1mo | $147,700 | $64 | 70 |
| 1922 N 27th St #1924 | 0.19mi | 5/2.0 (-1) | 2,454 (+9%) | 4mo | $90,000 | $37 | 67 |
| 3127 W Garfield Ave #3129 | 0.49mi | 5/2.0 (-1) | 2,332 (+4%) | 0mo | $130,000 | $56 | 66 |
| 1420 N 37th St | 0.60mi | 6/2.0 | 2,193 (-2%) | 9mo | $282,000 | $129 | 61 |
| 1440 N 28th St | 0.23mi | 5/2.0 (-1) | 1,982 (-12%) | 5mo | $95,000 | $48 | 60 |
| 1800 N 36th St #1802 | 0.50mi | 5/2.0 (-1) | 2,320 (+3%) | 8mo | $45,000 | $19 | 59 |
| 2201 N 33rd St | 0.56mi | 6/2.0 | 2,446 (+9%) | 3mo | $186,300 | $76 | 57 |
| 1932 W Brown St #1934 | 0.62mi | 5/2.0 (-1) | 2,448 (+9%) | 2mo | $120,000 | $49 | 50 |
| 2137 N 31st St | 0.45mi | 5/2.0 (-1) | 1,919 (-15%) | 1mo | $138,500 | $72 | 49 |
Match score weights: distance 35% · size 25% · config 20% · recency 20%. Top-matched comps best support the ARV.
Projected returns pro-forma
-3.0% appreciation · 8.0% rent growth · sell at horizon
- IRR
- 14.9%
- Equity multiple
- 1.64×
- Total profit
- $30,975
- Equity at exit
- $25,944
- IRR
- 27.2%
- Equity multiple
- 3.98×
- Total profit
- $145,370
- Equity at exit
- $15,044
Cash invested: $48,720 (down + closing). Projections, not guarantees.
Landlord ↔ Tenant lean methodology
- Overall (STATE)
- 73 Landlord-Friendly
- State Wisconsin
- 73 Landlord-Friendly · R+2
- County
- — inherits STATE
- City
- — inherits STATE
ZIP-level market 53208
- Home prices YoY
- -27.1%
- Rents YoY
- 10.8%
- Active inventory
- 92
- Price-to-rent
- 11.9×
Monthly cashflow live
- Estimated rent
- $2,441 high interval (Pro) →
- Mortgage (P&I)
- −$912
- Tax est. 1.5%
- −$218 /mo · $2,610/yr
- Insurance
- −$72
- HOA
- −$0
- Vacancy / Maint / Mgmt
- −$513
- Net cashflow
- $726
Break-even live
2-unit breakdown (identical units grouped — click to expand)
| Units | Beds | Baths | Est. rent |
|---|---|---|---|
| 2× units | 3 | 1 | $2,440 |
| #1 | 3 | 1 | $1,220 |
| #2 | 3 | 1 | $1,220 |
| Total (2 units) | $2,441 | ||
UW: 25.0% down · 7.5% · 30yr · 1.5% tax · 5.0% vac · 8.0% maint · 8.0% mgmt
Financing live
Cash to close
- Down payment
- $43,500
- Closing costs
- $5,220
- Reserves months
- —
- Total cash needed
- —
Loan-product check · same deal, 3 products live
Conventional
25% down · 7.5% · 30yr
- Down + closing
- —
- Monthly P&I
- —
- Monthly cashflow
- —
- DSCR
- —
- Eligible?
- —
Personal DTI + credit; lowest rate.
DSCR
20% down · 8.5% · 30yr
- Down + closing
- —
- Monthly P&I
- —
- Monthly cashflow
- —
- DSCR
- —
- Eligible?
- —
No personal income docs; deal must DSCR.
Hard money
10% down · 12.0% · 12mo
- Down + closing
- —
- Monthly P&I
- —
- Monthly cashflow
- —
- DSCR
- —
- Eligible?
- —
Short-term bridge; refi at stabilization.
Rent comps 3 comps
| Address | Beds | Baths | Sqft | Rent | $/sqft | DOM | Units | Dist |
|---|---|---|---|---|---|---|---|---|
| 2432 N 28th St Milwaukee, WI | 5.0 | 1.5 | 1876 | $1,600 | $0.85 | 43d | 1 | 0.70mi |
| 2028 W Michigan St Milwaukee, WI | 6.0 | 2.0 | 2005 | $2,450 | $1.22 | 10d | 1 | 1.17mi |
| 2137 N 47th St Milwaukee, WI | 5.0 | 2.0 | 1723 | $1,850 | $1.07 | 14d | 1 | 1.25mi |
Listing history 25 events
-
2026-06-18days on market $174,000 Active 45 DOM
-
2026-06-17days on market $174,000 Active 44 DOM
-
2026-06-16days on market $174,000 Active 43 DOM
-
2026-06-15days on market $174,000 Active 42 DOM
-
2026-06-13days on market $174,000 Active 40 DOM
-
2026-06-13days on market $174,000 Active 39 DOM
-
2026-06-09days on market $174,000 Active 36 DOM
-
2026-06-08days on market $174,000 Active 35 DOM
-
2026-06-07days on market $174,000 Active 34 DOM
-
2026-06-05days on market $174,000 Active 31 DOM
-
2026-06-03days on market $174,000 Active 30 DOM
-
2026-06-02days on market $174,000 Active 29 DOM
-
2026-06-01days on market $174,000 Active 28 DOM
-
2026-05-31days on market $174,000 Active 27 DOM
-
2026-05-04$179,000 Active 536-char remark
-
2024-03-01soldstatus $83,600 Sold 165-char remark
Show marketing remark (165 chars)
Add this great duplex to your investment portfolio. Both units are currently vacant. Features include 3 bedrooms, 1 full bath in each unit. This one won't last long!
-
2024-01-05historical Contingent 165-char remark
Show marketing remark (165 chars)
Add this great duplex to your investment portfolio. Both units are currently vacant. Features include 3 bedrooms, 1 full bath in each unit. This one won't last long!
-
2024-01-01$91,900 Active 165-char remark
Show marketing remark (165 chars)
Add this great duplex to your investment portfolio. Both units are currently vacant. Features include 3 bedrooms, 1 full bath in each unit. This one won't last long!
-
2023-12-10historical
Show marketing remark (205 chars)
Add this great duplex to your investment portfolio. One unit rented, while the other awaits a new tenant or owner occupancy. Features include 3 bedrooms, 1 full bath in each unit. This one won't last long.
-
2023-12-06$91,900 Active
Show marketing remark (205 chars)
Add this great duplex to your investment portfolio. One unit rented, while the other awaits a new tenant or owner occupancy. Features include 3 bedrooms, 1 full bath in each unit. This one won't last long.
-
2018-11-23soldstatus $37,000 Sold
-
2018-10-18status Pending
-
2018-09-24price $43,000
-
2018-09-06price $48,000
-
2018-06-27$52,000 Active
ⓘ Source: listings_history table (triggers on properties + properties_extension) + one-shot
backfill from property_details.listing_events for pre-trigger history.
Climate risk First Street
- Flood 1/10 Low FEMA zone X (unshaded) · 0% chance over 30 yrs
- Wildfire 1/10 Low
- Heat 2/10 Low 7 d/yr ≥98°F today · 13 d/yr by 30 yrs out
- Wind 2/10 Low
- Air quality 3/10 Moderate 3 unhealthy d/yr today · 4 by 30 yrs out
Nearby sold comps map
Loading sold comps map…
Walkable amenities ~0.75 mi
Loading nearby amenities…
Taxation est. · year 1
- Rental income
- $29,292
- − Mortgage interest
- −$9,747
- − Property taxes
- −$2,610
- − Insurance
- −$870
- − Repairs & maintenance
- −$2,343
- − Management
- −$2,343
- − Depreciation
- −$5,062
- Taxable income
- $6,317
- Est. tax owed @ 24.0%
- −$1,516
- After-tax cash flow
- $7,195/yr
For passive investors: Depreciation is non-cash, so a rental often shows a tax loss while cash-flowing — sheltering income. Rental losses are passive: they offset passive income freely, and up to $25,000/yr can offset ordinary (W-2) income if you actively participate and your MAGI is under $100k (phasing out to $0 by $150k); unused losses carry forward. On sale, claimed depreciation is recaptured at up to 25%, and gains may owe capital-gains tax (a 1031 exchange can defer both). Figures are a year-1 estimate at your 24.0% rate — not tax advice; consult a CPA.
Condition & rehab AI · 12 photos
This well-maintained, investor-ready duplex offers stable tenancy and low maintenance appeal, with potential for cosmetic updates to enhance its resale and rental value.
Value-add opportunities
- Both paint exterior — enhances curb appeal and resale value
- Both replace carpet — improves comfort and rental appeal
Renovation cost estimate screening
Value-add ROI direction
- Both paint exterior — enhances curb appeal and resale value ↑
- Both replace carpet — improves comfort and rental appeal ↑
ⓘ Cost ranges are severity-bucket heuristics (US national rule-of-thumb). Get contractor quotes + a written scope before underwriting a rehab budget.
Schools (NCES district)
- District
- Milwaukee School District
- NCES district ID
- 5509600
- Math proficiency
- 10% ▼ -5.00%
- Reading proficiency
- 18% ▬ 0.00%
- Median HH income
- $36,339
- Composite
- 11.61/100
- National rank
- #9696
- State rank
- #337 of 342 in WI
Livability — Milwaukee
- Score
- 81/100
- State rank
- #55
- US rank
- #1534
Category grades
Schools grade is shown separately in the Schools card above.
Census & demographics
- Census place
- Milwaukee, WI
- County
- Milwaukee County · 926,379 people
- City population
- 573,768
- Metro
- Milwaukee-Waukesha, WI
- Population (ZIP)
- 27,201
- Household income
- $52,690
- Rent vs Own
- Severe rent burden
- 1568.0
Population outlook (Milwaukee County) Hauer SSP2
- Today (2025)
- 995,758 people
- By 2030
- 1,009,124 · +1.3%
- By 2040
- 1,028,128 · +3.3%
- By 2050
- 1,040,066 · +4.4%
- By 2075
- 1,057,849 · +6.2%
- By 2100
- 1,039,774 · +4.4%
Race, ethnicity, and origin ACS 2023
- Neighborhood character
- Diverse neighborhood (Simpson 0.69)
- Race & ethnicity
- Black 41% White 36% Hispanic / Latino 10% Asian 9% Two or more races 6%
- Hispanic origin (detail)
- Mexican 7% Puerto Rican 2%
- Common ancestry
- Romanian 5% Italian 2% Lithuanian 2%
- Foreign-born
- 9% · Canada, Philippines
- Languages at home
- 84% English-only · Other Asian/Pacific 6% Spanish 6% French/Haitian/Cajun 1%
Political lean MEDSL · Milwaukee
- 2024 margin
- Solid D (+38.5) · D 68.3% · R 29.8% · Other 1.8%
- 2008→2024 swing
- +2.7pp toward D · 2008: 35.9pp · 2024: 38.5pp
- All cycles
- 2024: D+38.5 2020: D+39.9 2016: D+37.5 2012: D+34.6 2008: D+35.9
Not yet ingested
- Civics
- —
Market trends
- HPI YoY
- ▼ -123.92%
- Current HPI
- 333.7268
- Rent YoY
- ▲ 10.78%
- Metro
- Milwaukee-Waukesha, WI
- State GDP YoY
- ▲ 2.10%
- F500 in state
- 20
Industry mix (Fortune 500 HQ in WI)
| Industry | F500 HQs | Revenue |
|---|---|---|
| Industrial Machinery | 4 | $23B |
|
||
| Industrial Technology | 2 | $36B |
|
||
| Insurance | 1 | $36B |
|
||
| Professional Services | 1 | $19B |
|
||
| Utilities | 1 | $9B |
|
||
| Consumer Goods | 1 | $3B |
|
||
Price history
+234.6% since first listed12 events — show timeline
- 2026-05-28 Price Changed $174,000 METROMLS
- 2026-05-04 Listed $179,000 METROMLS
- 2024-03-01 Sold (MLS) $83,600 METROMLS
- 2024-01-05 Contingent — METROMLS
- 2024-01-01 Listed $91,900 METROMLS
- 2023-12-10 Listing Removed — METROMLS
- 2023-12-06 Listed $91,900 METROMLS
- 2018-11-23 Sold (MLS) $37,000 METROMLS
- 2018-10-18 Pending — METROMLS
- 2018-09-24 Price Changed $43,000 METROMLS
- 2018-09-06 Price Changed $48,000 METROMLS
- 2018-06-27 Listed $52,000 METROMLS
Cash-flow waterfall
monthlySold comps — $/sqft
last 12 mo · ≤1 miLoading sold comps…