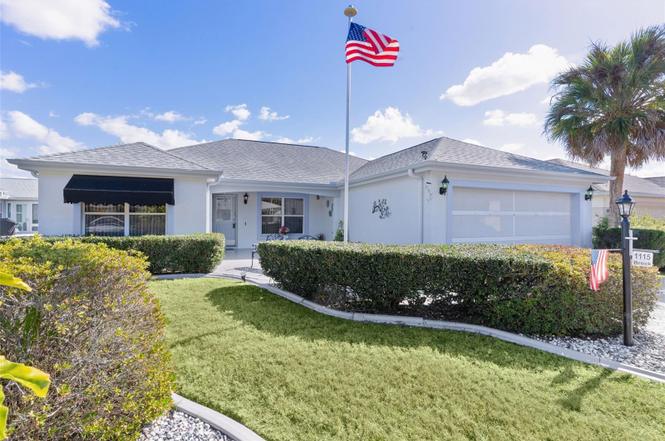
1115 Salido Ave · The Villages, FL
Flood risk 1/10 · Minimal
- FEMA flood zone
- X (unshaded)
- Chance of flooding over 30 yrs
- 0.0%
- Est. flood insurance / yr
- $507 – $1,088
Fire risk 4/10 · Minor
- Est. fire insurance / yr
- $947 – $1,759
Heat risk 9/10 · Severe
- Hot days now (above 109°F)
- 7 days/yr
- Hot days in 30 yrs
- 21 days/yr
Wind risk 9/10 · Severe
- Chance of severe wind over 30 yrs
- 99.0%
Air-quality risk 3/10 · Minor
- Unhealthy air days now
- 2 days/yr
- Unhealthy air days in 30 yrs
- 3 days/yr
Risk factors via First Street. Map © Google.
Why this score? — see what drove the D+ grade
The composite is a weighted blend of 9 inputs, each scored 0–100. Each bar is that input's sub-score; the figure is the points it added to the 100-point composite (weight × sub-score).
- Cash flow +14.8/30.0
- ARV discount +8.6/15.0
- Schools +5.2/10.0
- DSCR +4.5/10.0
- Rent growth +3.5/5.0
- Livability +3.5/5.0
- 1% rule +3.1/10.0
- Condition / age +2.5/5.0
- Appreciation +0.0/10.0
$350,000
🖨 Deal sheet 📄 Offer letter ✓ Due diligence
Listing remarks
Bond Paid. One Owner Home has been Maticulously Maintained~! TURNKEY with exceptions. Fabulous Sitting Area in Front of the Home with Birdcage in the Back for Exterior Relaxation in this Quiet Setting. Located in the Much Desired Village of Santo Domingo. Large Primary Bedroom with Walk In Closet, En-Suite Bath, Dual Vanities and Shower. Split Bedroom Designer, with Generous Sized Bedrooms and Bathroom, Tub/Shower in between. Funtional Kitchen with Eating Bar, Opens to Living Room and Dining Room Areas of Home. Kitchen has a Passthrough to the Enclosed Lanai Area with Solar Tube, Adding to Flexibility with this Wonderful Home. Oversized Garage with Epoxy Floor, Ceiling Fan and Top to Bottom
Key facts
- Functional kitchen
- Sitting area
- Eating bar
Tags
Property features AI
Finance
- Other: CDD applies; Turnkey furnished option available
- HOA & community: Community pool; Tennis courts; Pickleball courts; Trails; Golf course access; golf carts allowed; Senior community; Pets allowed
Exterior
- Parking: Attached 2-car garage (24 x 19)
- Utilities: Public water; Public sewer; Cable connected; Electricity connected; Phone available; Sewer connected; Water connected
- Home design: Single-family residence; One story; Faces west
- Construction: Block and stucco construction; Shingle roof; Slab foundation; Built on one level
- Exterior features: Awnings; Outdoor lighting; Outdoor grill; Rain gutters; Irrigation equipment
Interior
- Kitchen: Built-in oven; Dishwasher; Disposal; Microwave; Refrigerator
- Bedrooms: 3 bedrooms
- Flooring: Carpet; Ceramic tile
- Bathrooms: 2 full bathrooms
- Heating & cooling: Central heating (electric, heat pump); Central air conditioning
- Interior features: Ceiling fans; High ceilings; Open floorplan with living/dining combo; Split-bedroom layout; Walk-in closets; Window treatments
- Laundry & utility: Laundry room with washer and dryer hookups; Electric dryer hookup; Washer hookup; Inside laundry
Neighborhood map
What this means for you Summary
Snapshot
- This is a 3-bed/2.0-bath single-family listed at $350k.
Deal economics
- At list price, monthly cash flow is $97 ($1k/yr) — positive.
- The deal already cash-flows at list — no discount required.
- To meet the 1% rule (rent ≥ 1% of price), the offer needs to be $285k (18.7% below list).
- Recommended offer: $285k (18.7% below list) — sets the bar for 1% rule.
- Cap rate 6.6% vs local median 5.0% in The Villages — top-decile yield for the area; either an underpriced asset or a hidden risk that comps aren't pricing in. Stress-test before assuming the spread holds.
Location & tenants
- Location reads 70/100 on livability (#431 in FL) — a middle-class / working-renter tenant base. Strengths: schools A+, crime A+, housing A; Watch: amenities F, commute F, health & safety F.
- Sumter (rural): math 61% / reading 61% proficiency, ranked #11 of 73 in FL (top 15%) — acceptable for families but not a draw, mixed tenant base, ~2y average lease.
- Market conditions: Rents rising fast (+4.0%/yr); 576 active listings in the ZIP; 16 comparable units currently listed for rent nearby; rentals at typical pace (median 21d on market — plan ~3-4 weeks tenant-placement turnaround); 3,961 units permitted in Sumter County in 2024 (248 in 5+ unit buildings).
- At $2,846/mo this rent would consume 58% of the median local household income ($59k/yr) (locally 1047% of renters already pay >50% of income on rent) — very limited rent-growth headroom before tenants either downsize or default.
Forward outlook
- Local home prices are declining (-3.0%/yr); year-one equity from $2k of loan paydown is wiped out by about $10k of value loss. Plan a longer hold.
- Sumter County population projected at +45% by 2050 — long-run rental-demand tailwind backs the buy-and-hold thesis.
Negotiation context
- It's been on market 146 days — a 12% lower offer ($308k) is reasonable based on typical stale-listing flexibility.
- Current owner paid $114k; list at $350k implies a 208% gain — meaningful room to come down on a strong offer.
Risks & watch-outs
- Climate carrying-cost: severe wind risk, 99% chance of damaging wind over 30y; extreme-heat days projected 7→21/yr by 2055 (HVAC capex compounding) — expect insurance premiums to compound above CPI over the hold.
Questions for the listing agent
- It's been on market 146 days. Have you received any prior offers? Is the seller open to a 19% concession, seller financing, or rate buy-down credit?
- Why hasn't it sold? Are there any deal-killer items the seller is aware of (foundation, flood, title, zoning, code violations)?
- Is there a deadline driving the sale (1031 exchange, divorce, estate, relocation)? That informs how much negotiation room exists.
- Schools are A-rated — typically a magnet for longer-tenancy family renters. What's the average tenant stay here, and is there a school-zone premium baked into asking?
- The area grade is low — what's the realistic commute time and amenity access for the typical tenant pool here? Any planned neighborhood developments (good or bad) we should know about?
- What's the average days-on-market for RENTAL listings here right now (not sales)? A rising rental-DOM trend means longer vacancies and softer asking-rent achievability than the comps imply.
- What's the recent tenant-quality profile in this submarket — average credit score on applications, eviction rate, late-payment / NSF rate, and stable-employment percentage? A property-management company in the area should have these aggregated.
- How much new for-sale + rental construction is in the pipeline within 1–3 miles? Heavy new supply typically softens prices + rents 12–24 months out; constrained supply supports both.
Investment metrics
- 1% rule
- 0.81% ✗
- Cap rate
- 6.63%
- Cash-on-cash
- 1.19%
- DSCR
- 1.05
- GRM
- 10.2
CMA / ARV
- ARV (on-the-fly)
- $359,104
- Comps found
- 12
Show comp detail 12 sales within ~0.75 mi
| Address | Dist | Beds/Ba | Sqft | Sold | Price | $/sf | Match |
|---|---|---|---|---|---|---|---|
| 1110 Salido Ave | 0.05mi | 3/2.0 | 1,483 (+2%) | 3mo | $435,000 | $293 | 91 |
| 1134 Salido Ave | 0.10mi | 3/2.0 | 1,542 (+6%) | 1mo | $360,000 | $233 | 84 |
| 1148 Chaparral Dr | 0.23mi | 3/2.0 | 1,392 (-4%) | 0mo | $465,000 | $334 | 83 |
| 2125 Zaragoza Pl | 0.26mi | 3/2.0 | 1,494 (+3%) | 1mo | $370,000 | $248 | 82 |
| 2027 Cipriano Pl | 0.38mi | 3/2.0 | 1,392 (-4%) | 3mo | $306,000 | $220 | 73 |
| 1903 Antonia Pl | 0.55mi | 3/2.0 | 1,464 (+1%) | 0mo | $380,000 | $260 | 72 |
| 2016 Claudio Ln | 0.36mi | 3/2.0 | 1,527 (+6%) | 3mo | $310,000 | $203 | 72 |
| 2005 Claudio Ln | 0.41mi | 2/2.0 (-1) | 1,389 (-4%) | 0mo | $317,000 | $228 | 69 |
| 2109 Suarez Ct | 0.09mi | 2/2.0 (-1) | 1,248 (-14%) | 3mo | $310,000 | $248 | 65 |
| 2412 Merida Cir | 0.66mi | 3/2.0 | 1,527 (+6%) | 2mo | $282,500 | $185 | 58 |
| 1216 Chaparral Dr | 0.25mi | 2/2.0 (-1) | 1,239 (-14%) | 3mo | $292,000 | $236 | 57 |
| 1404 Almanza Dr | 0.55mi | 2/2.0 (-1) | 1,234 (-15%) | 3mo | $353,000 | $286 | 42 |
Match score weights: distance 35% · size 25% · config 20% · recency 20%. Top-matched comps best support the ARV.
Projected returns pro-forma
-3.0% appreciation · 4.03% rent growth · sell at horizon
- IRR
- -13.4%
- Equity multiple
- 0.51×
- Total profit
- $-47,651
- Equity at exit
- $52,186
- IRR
- -3.2%
- Equity multiple
- 0.78×
- Total profit
- $-21,509
- Equity at exit
- $30,262
Cash invested: $98,000 (down + closing). Projections, not guarantees.
Landlord ↔ Tenant lean methodology
- Overall (STATE)
- 87 Strongly Landlord-Friendly
- State Florida
- 87 Strongly Landlord-Friendly · R+3
- County
- — inherits STATE
- City
- — inherits STATE
ZIP-level market 32159
- Home prices YoY
- -16.0%
- Rents YoY
- 4.0%
- Active inventory
- 576
- Price-to-rent
- 10.2×
Monthly cashflow live
- Estimated rent
- $2,846 high interval (Pro) →
- Mortgage (P&I)
- −$1,835
- Tax from tax record
- −$170 /mo · $2,040/yr
- Insurance
- −$146
- HOA
- −$0
- Vacancy / Maint / Mgmt
- −$598
- Net cashflow
- $97
Break-even live
UW: 25.0% down · 7.5% · 30yr · 1.5% tax · 5.0% vac · 8.0% maint · 8.0% mgmt
Financing live
Cash to close
- Down payment
- $87,500
- Closing costs
- $10,500
- Reserves months
- —
- Total cash needed
- —
Loan-product check · same deal, 3 products live
Conventional
25% down · 7.5% · 30yr
- Down + closing
- —
- Monthly P&I
- —
- Monthly cashflow
- —
- DSCR
- —
- Eligible?
- —
Personal DTI + credit; lowest rate.
DSCR
20% down · 8.5% · 30yr
- Down + closing
- —
- Monthly P&I
- —
- Monthly cashflow
- —
- DSCR
- —
- Eligible?
- —
No personal income docs; deal must DSCR.
Hard money
10% down · 12.0% · 12mo
- Down + closing
- —
- Monthly P&I
- —
- Monthly cashflow
- —
- DSCR
- —
- Eligible?
- —
Short-term bridge; refi at stabilization.
Rent comps 16 comps
| Address | Beds | Baths | Sqft | Rent | $/sqft | DOM | Units | Dist |
|---|---|---|---|---|---|---|---|---|
| 2126 Sansores St Lady Lake, FL | 3.0 | 2.0 | 1748 | $3,700 | $2.12 | 21d | 1 | 0.10mi |
| 2006 Cardona Way Lady Lake, FL | 2.0 | 2.0 | 1428 | $3,900 | $2.73 | 21d | 1 | 0.34mi |
| 2002 Salinas Ave Lady Lake, FL | 3.0 | 2.0 | 1642 | $5,500 | $3.35 | 21d | 1 | 0.55mi |
| 1377 Camero Dr Lady Lake, FL | 3.0 | 2.0 | 1462 | $5,500 | $3.76 | 21d | 1 | 0.95mi |
| 722 Camino del Rey Dr Lady Lake, FL | 3.0 | 2.0 | 1205 | $2,000 | $1.66 | 21d | 1 | 1.07mi |
| 1522 Yucatan Way Unit 1525265P Lady Lake, FL | 2.0 | 2.0 | 1732 | $1,829 | $1.06 | 21d | 1 | 1.12mi |
| 2829 Burgos Dr The Villages, FL | 2.0 | 2.0 | 1156 | $1,850 | $1.60 | 21d | 1 | 1.16mi |
| 1524 Martinez Dr Lady Lake, FL | 2.0 | 2.0 | 1199 | $2,095 | $1.75 | 21d | 1 | 1.17mi |
| 1129 Santa Cruz Dr The Villages, FL | 2.0 | 2.0 | 1102 | $2,350 | $2.13 | 21d | 1 | 1.24mi |
| 6367 NE 118th Ave The Villages, FL | 3.0–4.0 | 2.0–2.5 | 1645 | $1,925 | $1.17 | 21d | 10 | 1.35mi |
| 613 Enconto St Unit 1525268P The Villages, FL | 2.0 | 2.0 | 1097 | $1,788 | $1.63 | 21d | 1 | 1.37mi |
| 1314 Corona Ave Lady Lake, FL | 2.0 | 2.0 | 1656 | $2,500 | $1.51 | 21d | 1 | 1.39mi |
| 13904 County Road 109D Lady Lake, FL | 3.0 | 2.0 | 1568 | $1,550 | $0.99 | 21d | 1 | 1.41mi |
| 1688 Garcia Ct Lady Lake, FL | 2.0 | 2.0 | 1075 | $1,700 | $1.58 | 21d | 1 | 1.42mi |
| 13957 County Road 109D Lady Lake, FL | 2.0 | 2.0 | 1482 | $1,650 | $1.11 | 21d | 1 | 1.45mi |
| 1304 Santa Rosa Ct Lady Lake, FL | 2.0 | 2.0 | 1286 | $4,500 | $3.50 | 21d | 1 | 1.46mi |
Listing history 18 events
-
2026-06-19days on market $350,000 Active 146 DOM
-
2026-06-18days on market $350,000 Active 145 DOM
-
2026-06-17days on market $350,000 Active 144 DOM
-
2026-06-16days on market $350,000 Active 143 DOM
-
2026-06-15days on market $350,000 Active 142 DOM
-
2026-06-14days on market $350,000 Active 140 DOM
-
2026-06-13days on market $350,000 Active 139 DOM
-
2026-06-10days on market $350,000 Active 137 DOM
-
2026-06-09days on market $350,000 Active 136 DOM
-
2026-06-08days on market $350,000 Active 135 DOM
-
2026-06-07pricedays on market $350,000 Active 134 DOM
-
2026-06-02days on market $365,000 Active 129 DOM
-
2026-06-01days on market $365,000 Active 128 DOM
-
2026-05-31days on market $365,000 Active 127 DOM
-
2026-05-30days on market $365,000 Active 126 DOM
-
2026-03-06price $365,000
-
2026-01-24$375,000 Active
-
1997-06-03soldstatus $113,600
ⓘ Source: listings_history table (triggers on properties + properties_extension) + one-shot
backfill from property_details.listing_events for pre-trigger history.
Tax reassessment forecast FL · Resets to sale price
- Current annual tax
- $2,040 · $170/mo
- Projected year-2 tax
- $2,905 · $242/mo
- Expected delta
- +$865/yr (+$72/mo · 42.4%)
ⓘ Screening estimate from a state-policy table — verify with the county assessor before closing.
Climate risk First Street
- Flood 1/10 Low FEMA zone X (unshaded) · 0% chance over 30 yrs
- Wildfire 4/10 Moderate
- Heat 9/10 Extreme 7 d/yr ≥109°F today · 21 d/yr by 30 yrs out
- Wind 9/10 Extreme 99% chance of damaging wind over 30 yrs
- Air quality 3/10 Moderate 2 unhealthy d/yr today · 3 by 30 yrs out
Nearby sold comps map
Loading sold comps map…
Walkable amenities ~0.75 mi
Loading nearby amenities…
Taxation est. · year 1
- Rental income
- $34,158
- − Mortgage interest
- −$19,605
- − Property taxes
- −$2,040
- − Insurance
- −$1,750
- − Repairs & maintenance
- −$2,733
- − Management
- −$2,733
- − Depreciation
- −$10,182
- Taxable loss
- −$4,885
- Est. tax savings @ 24.0%
- +$1,172
- After-tax cash flow
- $2,342/yr
For passive investors: Depreciation is non-cash, so a rental often shows a tax loss while cash-flowing — sheltering income. Rental losses are passive: they offset passive income freely, and up to $25,000/yr can offset ordinary (W-2) income if you actively participate and your MAGI is under $100k (phasing out to $0 by $150k); unused losses carry forward. On sale, claimed depreciation is recaptured at up to 25%, and gains may owe capital-gains tax (a 1031 exchange can defer both). Figures are a year-1 estimate at your 24.0% rate — not tax advice; consult a CPA.
Schools (NCES district)
- District
- Sumter
- NCES district ID
- 1201800
- Math proficiency
- 61% ▼ -4.00%
- Reading proficiency
- 61% ▼ -2.00%
- Median HH income
- $48,240
- Composite
- 51.74/100
- National rank
- #1682
- State rank
- #11 of 73 in FL
Livability — The Villages
- Score
- 70/100
- State rank
- #431
- US rank
- #7363
Category grades
Schools grade is shown separately in the Schools card above.
Census & demographics
- Census place
- The Villages, FL
- County
- Lake County · 364,602 people
- City population
- 83,973
- Metro
- Orlando-Kissimmee-Sanford, FL
- Population (ZIP)
- 32,107
- Household income
- $58,518
- Rent vs Own
- Severe rent burden
- 1047.0
Population outlook (Sumter County) Hauer SSP2
- Today (2025)
- 161,172 people
- By 2030
- 180,083 · +11.7%
- By 2040
- 209,892 · +30.2%
- By 2050
- 234,186 · +45.3%
- By 2075
- 284,602 · +76.6%
- By 2100
- 317,039 · +96.7%
Race, ethnicity, and origin ACS 2023
- Neighborhood character
- Predominantly White (86%)
- Race & ethnicity
- White 86% Hispanic / Latino 6% Two or more races 5% Black 4% Asian 1%
- Hispanic origin (detail)
- Puerto Rican 3%
- Common ancestry
- Romanian 4% Lithuanian 3% Slovak 3%
- Foreign-born
- 5% · Canada, Jamaica
- Languages at home
- 93% English-only · Spanish 4% German/W. Germanic 1% Other Indo-European 1%
Political lean MEDSL · Sumter
- 2024 margin
- Solid R (+37.6) · D 30.9% · R 68.6%
- 2008→2024 swing
- -10.6pp toward R · 2008: -27.0pp · 2024: -37.6pp
- All cycles
- 2024: R+37.6 2020: R+36.1 2016: R+39.2 2012: R+34.9 2008: R+27.0
Not yet ingested
- Civics
- —
Market trends
- HPI YoY
- ▼ -45.24%
- Current HPI
- 237.6208
- Rent YoY
- ▲ 4.03%
- Metro
- Orlando-Kissimmee-Sanford, FL
- State GDP YoY
- ▲ 3.28%
- F500 in state
- 36
Industry mix (Fortune 500 HQ in FL)
| Industry | F500 HQs | Revenue |
|---|---|---|
| Industrial Technology | 2 | $29B |
|
||
| Insurance | 2 | $17B |
|
||
| Retail | 1 | $60B |
|
||
| Technology Distribution | 1 | $58B |
|
||
| Homebuilding | 1 | $35B |
|
||
| Technology Manufacturing | 1 | $35B |
|
||
Price history
+221.3% since first listed3 events — show timeline
- 2026-03-06 Price Changed $365,000 Stellar MLS as Distributed by MLS Grid
- 2026-01-24 Listed $375,000 Stellar MLS as Distributed by MLS Grid
- 1997-06-03 Sold (Public Records) $113,600 Public Records
Property tax history
+2.0%/yrLatest (2025): $2,040 · +1.3% YoY. Source: county tax records.
Cash-flow waterfall
monthlySold comps — $/sqft
last 12 mo · ≤1 miLoading sold comps…