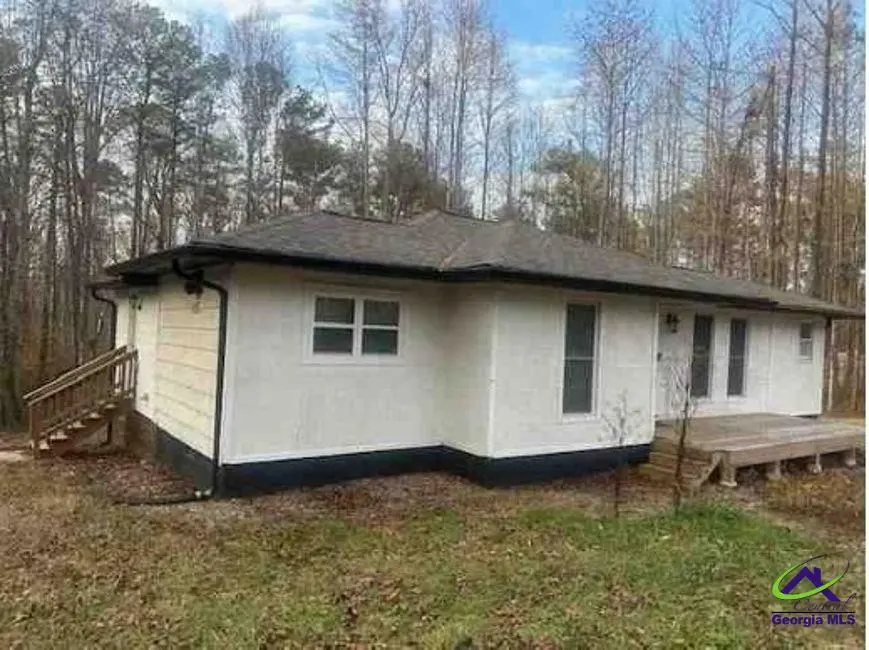
4289 Post Rd · Villa Rica, GA
Flood risk 1/10 · Minimal
- FEMA flood zone
- X (unshaded)
- Chance of flooding over 30 yrs
- 0.0%
- Est. flood insurance / yr
- $507 – $1,088
Fire risk 4/10 · Minor
- Est. fire insurance / yr
- $963 – $1,789
Heat risk 5/10 · Moderate
- Hot days now (above 103°F)
- 7 days/yr
- Hot days in 30 yrs
- 18 days/yr
Wind risk 5/10 · Moderate
- Chance of severe wind over 30 yrs
- 25.0%
Air-quality risk 3/10 · Minor
- Unhealthy air days now
- 4 days/yr
- Unhealthy air days in 30 yrs
- 4 days/yr
Risk factors via First Street. Map © Google.
Why this score? — see what drove the C+ grade
The composite is a weighted blend of 9 inputs, each scored 0–100. Each bar is that input's sub-score; the figure is the points it added to the 100-point composite (weight × sub-score).
- Cash flow +24.2/30.0
- ARV discount +15.0/15.0
- DSCR +7.8/10.0
- 1% rule +6.5/10.0
- Livability +3.2/5.0
- Schools +2.6/10.0
- Rent growth +2.5/5.0
- Condition / age +2.5/5.0
- Appreciation +0.0/10.0
$147,560
🖨 Deal sheet 📄 Offer letter ✓ Due diligence
Listing remarks MLS
Offers to be placed on Xome.com. Interior inspections are not available, do not trespass! Forward all inquiries and questions to Xome Customer Service . NO REPRESENTATION TO VALIDITY OF INFORMATION IS MADE, BUYER TO VERIFY ALL INFORMATION WHERIN.
Key facts
- 1.39 acre lot
- Built 1899
- Listed 26 days
Neighborhood map
What this means for you Summary
Snapshot
- This is a 3-bed/2.0-bath single-family listed at $148k.
Deal economics
- At list price, monthly cash flow is $295 ($4k/yr) — positive.
- The deal already cash-flows at list — no discount required.
- Meets the 1% rule at list price ($2k rent vs $148k).
- Recommended offer: $145k (1.5% below list) — sets the bar for market timing.
- Cap rate 8.7% vs local median 4.0% in Villa Rica — top-decile yield for the area; either an underpriced asset or a hidden risk that comps aren't pricing in. Stress-test before assuming the spread holds.
Location & tenants
- Location reads 65/100 on livability (#224 in GA) — a middle-class / working-renter tenant base. Strengths: cost of living A+, housing A+, employment B; Watch: schools C-, amenities F, commute F.
- Douglas County (suburban): math 23% / reading 35% proficiency, ranked #92 of 174 in GA (top 53%) — low school quality limits family demand, transient renter base, plan for 1-2y turnover.
- Market conditions: 127 active listings in the ZIP; 595 units permitted in Douglas County in 2024 (72 in 5+ unit buildings).
Forward outlook
- Local home prices are declining (-3.0%/yr); year-one equity from $1k of loan paydown is wiped out by about $4k of value loss. Plan a longer hold.
- Douglas County population projected at +35% by 2050 — long-run rental-demand tailwind backs the buy-and-hold thesis.
Negotiation context
- It's been on market 26 days — a 2% lower offer ($145k) is reasonable based on typical stale-listing flexibility.
- 14 sale attempts since 4y ago with the ask held roughly flat each time — persistent listings suggest the price (not the market) is what's stuck; bring a comps-based counter.
Risks & watch-outs
- Watch-outs: built in 1899 — expect roof / HVAC / electrical / plumbing capex.
- Climate carrying-cost: moderate wind risk, 25% chance of damaging wind over 30y; extreme-heat days projected 7→18/yr by 2055 (HVAC capex compounding) — expect insurance premiums to compound above CPI over the hold.
Questions for the listing agent
- Built in 1899 — when were the roof, HVAC, electrical panel, plumbing, and water heater last replaced?
- Is there a deadline driving the sale (1031 exchange, divorce, estate, relocation)? That informs how much negotiation room exists.
- What's the average days-on-market for RENTAL listings here right now (not sales)? A rising rental-DOM trend means longer vacancies and softer asking-rent achievability than the comps imply.
- What's the recent tenant-quality profile in this submarket — average credit score on applications, eviction rate, late-payment / NSF rate, and stable-employment percentage? A property-management company in the area should have these aggregated.
- How much new for-sale + rental construction is in the pipeline within 1–3 miles? Heavy new supply typically softens prices + rents 12–24 months out; constrained supply supports both.
Investment metrics
- 1% rule
- 1.15% ✓
- Cap rate
- 8.69%
- Cash-on-cash
- 8.58%
- DSCR
- 1.38
- GRM
- 7.2
CMA / ARV
- ARV (median comp)
- $265,977
- List price
- $147,560
- Delta
- -44.52%
- Verdict
- UNDERPRICED
- Comps
- 10 within 1.0 mi
Show comp detail 1 sale within ~0.75 mi
| Address | Dist | Beds/Ba | Sqft | Sold | Price | $/sf | Match |
|---|---|---|---|---|---|---|---|
| 4289 Post Rd | 0.00mi | 3/2.0 | 1,084 (0%) | 1mo | $150,000 | $138 | 99 |
Match score weights: distance 35% · size 25% · config 20% · recency 20%. Top-matched comps best support the ARV.
Projected returns pro-forma
-3.0% appreciation · 3.0% rent growth · sell at horizon
- IRR
- -3.3%
- Equity multiple
- 0.88×
- Total profit
- $-5,061
- Equity at exit
- $22,002
- IRR
- 6.5%
- Equity multiple
- 1.48×
- Total profit
- $19,982
- Equity at exit
- $12,758
Cash invested: $41,317 (down + closing). Projections, not guarantees.
Landlord ↔ Tenant lean methodology
- Overall (STATE)
- 90 Strongly Landlord-Friendly
- State Georgia
- 90 Strongly Landlord-Friendly · R+3
- County
- — inherits STATE
- City
- — inherits STATE
ZIP-level market 30187
- Home prices YoY
- -15.8%
- Active inventory
- 127
- Price-to-rent
- 7.2×
Monthly cashflow live
- Estimated rent
- $1,699 medium interval (Pro) →
- Mortgage (P&I)
- −$774
- Tax from tax record
- −$211 /mo · $2,537/yr
- Insurance
- −$61
- HOA
- −$0
- Vacancy / Maint / Mgmt
- −$357
- Net cashflow
- $295
Break-even live
UW: 25.0% down · 7.5% · 30yr · 1.5% tax · 5.0% vac · 8.0% maint · 8.0% mgmt
Financing live
Cash to close
- Down payment
- $36,890
- Closing costs
- $4,427
- Reserves months
- —
- Total cash needed
- —
Loan-product check · same deal, 3 products live
Conventional
25% down · 7.5% · 30yr
- Down + closing
- —
- Monthly P&I
- —
- Monthly cashflow
- —
- DSCR
- —
- Eligible?
- —
Personal DTI + credit; lowest rate.
DSCR
20% down · 8.5% · 30yr
- Down + closing
- —
- Monthly P&I
- —
- Monthly cashflow
- —
- DSCR
- —
- Eligible?
- —
No personal income docs; deal must DSCR.
Hard money
10% down · 12.0% · 12mo
- Down + closing
- —
- Monthly P&I
- —
- Monthly cashflow
- —
- DSCR
- —
- Eligible?
- —
Short-term bridge; refi at stabilization.
Listing history 45 events
-
2026-05-12status Pending 246-char remark
Show marketing remark (246 chars)
Offers to be placed on Xome.com. Interior inspections are not available, do not trespass! Forward all inquiries and questions to Xome Customer Service . NO REPRESENTATION TO VALIDITY OF INFORMATION IS MADE, BUYER TO VERIFY ALL INFORMATION WHERIN.
-
2026-04-16$147,560 Active 246-char remark
Show marketing remark (246 chars)
Offers to be placed on Xome.com. Interior inspections are not available, do not trespass! Forward all inquiries and questions to Xome Customer Service . NO REPRESENTATION TO VALIDITY OF INFORMATION IS MADE, BUYER TO VERIFY ALL INFORMATION WHERIN.
-
2026-04-07historical
-
2026-04-07historical
-
2026-01-07$199,000 New
-
2026-01-07$199,000 Active
-
2025-12-01historical
-
2025-11-05$199,000 New
-
2025-11-05status Back On Market
-
2025-11-05status Active
-
2025-11-04historical
-
2025-11-04historical
-
2025-05-24status Pending
-
2025-05-24status Under Contract
-
2025-05-16$269,000 New
-
2025-05-16$269,000 Active
-
2025-05-14historical
-
2025-05-13historical
-
2025-03-17price $269,900
-
2025-03-17price $269,900
-
2025-02-24price $290,000
-
2025-02-20$290,000 Active
-
2025-01-30$300,000 New
-
2023-09-11soldstatus $265,000
-
2023-09-08soldstatus $265,000 Closed
-
2023-09-08soldstatus $265,000 Sold
-
2023-08-07status Under Contract
-
2023-08-07historical Active Under Contract
-
2023-07-27price $257,000
-
2023-07-27price $257,000
-
2023-06-23$259,999 Active
-
2023-06-23$259,999 New
-
2022-10-24soldstatus $103,000
-
2022-10-14soldstatus $103,000 Closed
-
2022-10-14soldstatus $103,000 Sold
-
2022-10-14soldstatus $80,200
-
2022-09-24status Under Contract
-
2022-09-24status Pending
-
2022-09-21price $99,000
-
2022-09-19$110,000 Active
-
2022-09-19$99,000 New
-
2019-09-30soldstatus $75,000
-
1992-07-07soldstatus $54,699
-
1985-10-09soldstatus $57,750
-
1985-08-27soldstatus $55,700
ⓘ Source: listings_history table (triggers on properties + properties_extension) + one-shot
backfill from property_details.listing_events for pre-trigger history.
Tax reassessment forecast GA · Resets to sale price
- Current annual tax
- $2,537 · $211/mo
- Projected year-2 tax
- $2,537 · $211/mo
- Expected delta
- $0/yr ($0/mo · 0.0%)
ⓘ Screening estimate from a state-policy table — verify with the county assessor before closing.
Climate risk First Street
- Flood 1/10 Low FEMA zone X (unshaded) · 0% chance over 30 yrs
- Wildfire 4/10 Moderate
- Heat 5/10 Major 7 d/yr ≥103°F today · 18 d/yr by 30 yrs out
- Wind 5/10 Major 25% chance of damaging wind over 30 yrs
- Air quality 3/10 Moderate 4 unhealthy d/yr today · 4 by 30 yrs out
Nearby sold comps map
Loading sold comps map…
Walkable amenities ~0.75 mi
Loading nearby amenities…
Taxation est. · year 1
- Rental income
- $20,385
- − Mortgage interest
- −$8,266
- − Property taxes
- −$2,537
- − Insurance
- −$738
- − Repairs & maintenance
- −$1,631
- − Management
- −$1,631
- − Depreciation
- −$4,293
- Taxable income
- $1,290
- Est. tax owed @ 24.0%
- −$310
- After-tax cash flow
- $3,234/yr
For passive investors: Depreciation is non-cash, so a rental often shows a tax loss while cash-flowing — sheltering income. Rental losses are passive: they offset passive income freely, and up to $25,000/yr can offset ordinary (W-2) income if you actively participate and your MAGI is under $100k (phasing out to $0 by $150k); unused losses carry forward. On sale, claimed depreciation is recaptured at up to 25%, and gains may owe capital-gains tax (a 1031 exchange can defer both). Figures are a year-1 estimate at your 24.0% rate — not tax advice; consult a CPA.
Schools (NCES district)
- District
- Douglas County
- NCES district ID
- 1301860
- Math proficiency
- 23% ▼ -16.00%
- Reading proficiency
- 35% ▼ -11.00%
- Median HH income
- $55,335
- Composite
- 25.84/100
- National rank
- #7353
- State rank
- #92 of 174 in GA
Livability — Villa Rica
- Score
- 65/100
- State rank
- #224
- US rank
- #13182
Category grades
Schools grade is shown separately in the Schools card above.
Census & demographics
- City population
- 43,013
- Population (ZIP)
- 8,130
Population outlook (Douglas County) Hauer SSP2
- Today (2025)
- 163,022 people
- By 2030
- 173,956 · +6.7%
- By 2040
- 196,859 · +20.8%
- By 2050
- 220,017 · +35.0%
- By 2075
- 279,831 · +71.7%
- By 2100
- 322,702 · +97.9%
Race, ethnicity, and origin ACS 2023
- Neighborhood character
- Predominantly White (66%)
- Race & ethnicity
- White 66% Black 18% Hispanic / Latino 9% Two or more races 9% Asian 2% Native American 1%
- Hispanic origin (detail)
- Mexican 6% Puerto Rican 3%
- Common ancestry
- Slovak 2% Lithuanian 2% Serbian 2%
- Foreign-born
- 6% · Canada, Jamaica, Vietnam
- Languages at home
- 88% English-only · Spanish 9% Vietnamese 2% Russian/Polish/Slavic 1%
Political lean MEDSL · Douglas
- 2024 margin
- Solid D (+31.4) · D 65.4% · R 33.9%
- 2008→2024 swing
- +29.6pp toward D · 2008: 1.8pp · 2024: 31.4pp
- All cycles
- 2024: D+31.4 2020: D+25.1 2016: D+10.8 2012: D+4.0 2008: D+1.8
Not yet ingested
- Civics
- —
Market trends
- HPI YoY
- ▼ -50.56%
- Current HPI
- 270.0582
- Rent YoY
- —
- Metro
- —
- State GDP YoY
- ▲ 2.66%
- F500 in state
- 28
Industry mix (Fortune 500 HQ in GA)
| Industry | F500 HQs | Revenue |
|---|---|---|
| Paper / Packaging | 2 | $29B |
|
||
| Retail | 1 | $160B |
|
||
| Transportation / Logistics | 1 | $91B |
|
||
| Airlines | 1 | $62B |
|
||
| Consumer Goods | 1 | $47B |
|
||
| Utilities | 1 | $25B |
|
||
Price history
+164.9% since first listed45 events — show timeline
- 2026-05-12 Pending — CGMLS
- 2026-04-16 Listed $147,560 CGMLS
- 2026-04-07 Listing Removed — FMLS
- 2026-04-07 Listing Removed — GAMLS
- 2026-01-07 Listed $199,000 FMLS
- 2026-01-07 Listed $199,000 GAMLS
- 2025-12-01 Listing Removed — GAMLS
- 2025-11-05 Listed $199,000 GAMLS
- 2025-11-05 Relisted — GAMLS
- 2025-11-05 Relisted — FMLS
- 2025-11-04 Listing Removed — FMLS
- 2025-11-04 Listing Removed — GAMLS
- 2025-05-24 Pending — FMLS
- 2025-05-24 Pending — GAMLS
- 2025-05-16 Listed $269,000 FMLS
- 2025-05-16 Listed $269,000 GAMLS
- 2025-05-14 Listing Removed — FMLS
- 2025-05-13 Listing Removed — GAMLS
- 2025-03-17 Price Changed $269,900 FMLS
- 2025-03-17 Price Changed $269,900 GAMLS
- 2025-02-24 Price Changed $290,000 GAMLS
- 2025-02-20 Listed $290,000 FMLS
- 2025-01-30 Listed $300,000 GAMLS
- 2023-09-11 Sold (Public Records) $265,000 Public Records
- 2023-09-08 Sold (MLS) $265,000 GAMLS
- 2023-09-08 Sold (MLS) $265,000 FMLS
- 2023-08-07 Pending — GAMLS
- 2023-08-07 Contingent — FMLS
- 2023-07-27 Price Changed $257,000 GAMLS
- 2023-07-27 Price Changed $257,000 FMLS
- 2023-06-23 Listed $259,999 GAMLS
- 2023-06-23 Listed $259,999 FMLS
- 2022-10-24 Sold (Public Records) $103,000 Public Records
- 2022-10-14 Sold (Public Records) $80,200 Public Records
- 2022-10-14 Sold (MLS) $103,000 GAMLS
- 2022-10-14 Sold (MLS) $103,000 FMLS
- 2022-09-24 Pending — GAMLS
- 2022-09-24 Pending — FMLS
- 2022-09-21 Price Changed $99,000 FMLS
- 2022-09-19 Listed $99,000 GAMLS
- 2022-09-19 Listed $110,000 FMLS
- 2019-09-30 Sold (Public Records) $75,000 Public Records
- 1992-07-07 Sold (Public Records) $54,699 Public Records
- 1985-10-09 Sold (Public Records) $57,750 Public Records
- 1985-08-27 Sold (Public Records) $55,700 Public Records
Property tax history
+6.5%/yrLatest (2025): $2,537 · +42.1% YoY. Source: county tax records.
Cash-flow waterfall
monthlySold comps — $/sqft
last 12 mo · ≤1 miLoading sold comps…