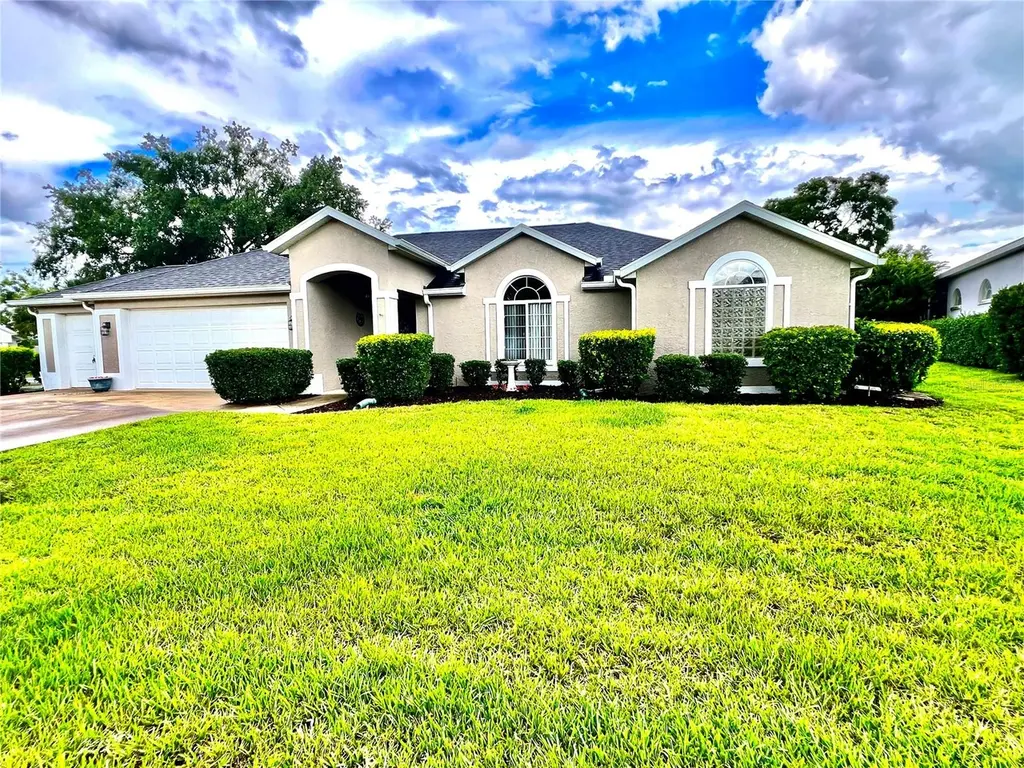
2100 NW 50th Cir · Ocala, FL
Flood risk 3/10 · Minor
- FEMA flood zone
- X (unshaded)
- Chance of flooding over 30 yrs
- 0.2%
- Est. flood insurance / yr
- $507 – $1,088
Fire risk 4/10 · Minor
- Est. fire insurance / yr
- $947 – $1,759
Heat risk 8/10 · Major
- Hot days now (above 107°F)
- 7 days/yr
- Hot days in 30 yrs
- 23 days/yr
Wind risk 9/10 · Severe
- Chance of severe wind over 30 yrs
- 99.0%
Air-quality risk 3/10 · Minor
- Unhealthy air days now
- 3 days/yr
- Unhealthy air days in 30 yrs
- 3 days/yr
Risk factors via First Street. Map © Google.
Why this score? — see what drove the D grade
The composite is a weighted blend of 9 inputs, each scored 0–100. Each bar is that input's sub-score; the figure is the points it added to the 100-point composite (weight × sub-score).
- ARV discount +15.0/15.0
- Cash flow +7.2/30.0
- Rent growth +5.0/5.0
- 1% rule +3.8/10.0
- Schools +3.6/10.0
- Livability +3.5/5.0
- Condition / age +2.5/5.0
- DSCR +1.4/10.0
- Appreciation +0.0/10.0
$239,900
🖨 Deal sheet (PDF) 📄 Offer letter ✓ Due diligence
Listing remarks
Welcome home to Ocala Palms, one of Ocala's most desirable active adult golf communities! Beautiful views of the 8th Tee. This carefully maintained 2-bedroom, 2-bath residence offers approximately 1,669 square feet of comfortable living space and has been thoughtfully updated with a brand-new roof, providing peace of mind for years to come. CUSTOM HOME ON CORNER LOT WITH GOLF COURSE VIEW. LARGE INSIDE LAUNDRY ROOM. Step inside and discover bright, open living areas designed for both everyday comfort and effortless entertaining. The spacious floor plan flows seamlessly from room to room, creating an inviting atmosphere perfect for gathering with family and friends or simply enjoying a quiet
Key facts
- Fitness center
- Golf course view
- Custom home
Tags
Property features AI
Finance
- Other: Lease restrictions apply; Directions: HWY 27 to entrance to Ocala Palms. Turn left past gate. Turn right onto 20th PL. Turn right onto 50th Circle. Home on left.
- Financial info: Total annual fees $3,540
- HOA & community: Monthly HOA fee $295 (required); Association amenities include cable TV, clubhouse, fitness center, golf course, pool, 24-hour guard; Association approval required; Senior community; Pets allowed (cats and dogs, number limit); Deed restrictions; Golf carts allowed; Sidewalks
Exterior
- Parking: Attached garage with 2 spaces
- Security: Gated community; Security gate; Security lights
- Utilities: Private water; Public sewer; Cable connected; Electricity connected; Phone available
- Home design: Single family residence; Residential property in a PUD; One-story; Faces northwest; Entry level: One
- Construction: Block and concrete construction; Shingle roof; Slab foundation; Built on a 0.2-acre lot
- Exterior features: Rain gutters; Sidewalk; Sliding doors; Paved road access; Lot dimensions 84 x 105
Interior
- Kitchen: Range; Range hood; Microwave; Refrigerator; Exhaust fan; Wine refrigerator
- Bedrooms: 2 bedrooms
- Flooring: Carpet; Ceramic tile; Laminate
- Bathrooms: 2 full bathrooms
- Heating & cooling: Electric heating; Heat pump; Central air conditioning
- Interior features: Eat-in kitchen; Walk-in closet(s); Breakfast room; Family room; Formal dining room; Inside utility
- Laundry & utility: Inside laundry room; Washer (included)
Neighborhood map
What this means for you Summary
Snapshot
- This is a 2-bed/2.0-bath single-family listed at $240k.
Deal economics
- At list price, monthly cash flow is $-325 ($-4k/yr) — negative.
- To cash-flow at today's rent, offer at most $182k (24.0% below list).
- To meet the 1% rule (rent ≥ 1% of price), the offer needs to be $211k (11.9% below list).
- Recommended offer: $182k (24.0% below list) — sets the bar for cash-flow.
Location & tenants
- Location reads 69/100 on livability (#476 in FL) — a middle-class / working-renter tenant base. Strengths: cost of living A+, housing A+, health & safety A+; Watch: crime F, amenities F, commute F.
- Marion (rural): math 42% / reading 43% proficiency, ranked #61 of 73 in FL (top 84%) — families likely to look elsewhere, expect single-tenant / working-renter base with shorter leases; 61% free/reduced lunch — lower-income household profile, screen leases tightly.
- Zoned schools: Liberty Middle School (math 40% / reading 41%, grade F, #360 of 571 statewide, top 64%, 1,365 students, 54% FRL); West Port High School (math 34% / reading 52%, grade F, #255 of 667 statewide, top 39%, 2,906 students, 52% FRL).
- Market conditions: Rents rising fast (+11.1%/yr); 670 active listings in the ZIP; 27 comparable units currently listed for rent nearby; rentals at typical pace (median 23d on market — plan ~3-4 weeks tenant-placement turnaround); 7,071 units permitted in Marion County in 2024 (534 in 5+ unit buildings).
- This rent runs 38% of the median local income ($66k/yr) — at the standard rent-burdened threshold; future hikes will face affordability resistance.
Forward outlook
- Local home prices are declining (-3.0%/yr); year-one equity from $2k of loan paydown is wiped out by about $7k of value loss. Plan a longer hold.
- Marion County population projected at +13% by 2050 — modest demand growth; plan on rents tracking national, not racing it.
Negotiation context
- Only 7 days on market — expect competitive offers; lowballing is unlikely to land.
- 7 sale attempts since 15y ago with the ask held roughly flat each time — persistent listings suggest the price (not the market) is what's stuck; bring a comps-based counter.
Risks & watch-outs
- Climate carrying-cost: severe wind risk, 99% chance of damaging wind over 30y; extreme-heat days projected 7→23/yr by 2055 (HVAC capex compounding) — expect insurance premiums to compound above CPI over the hold.
Questions for the listing agent
- What do current leases actually rent for vs. the listed asking? Can we see a recent rent roll and the last 12 months of T-12 income?
- What does the HOA fee cover, when was the last increase, and are there any pending special assessments or reserve-fund shortfalls?
- Is there a deadline driving the sale (1031 exchange, divorce, estate, relocation)? That informs how much negotiation room exists.
- Crime grade is F in this area — have there been break-ins, vandalism, or insurance claims at this property in the last 3 years? What carrier currently insures it and at what premium?
- The area grade is low — what's the realistic commute time and amenity access for the typical tenant pool here? Any planned neighborhood developments (good or bad) we should know about?
- What's the average days-on-market for RENTAL listings here right now (not sales)? A rising rental-DOM trend means longer vacancies and softer asking-rent achievability than the comps imply.
- What's the recent tenant-quality profile in this submarket — average credit score on applications, eviction rate, late-payment / NSF rate, and stable-employment percentage? A property-management company in the area should have these aggregated.
- How much new for-sale + rental construction is in the pipeline within 1–3 miles? Heavy new supply typically softens prices + rents 12–24 months out; constrained supply supports both.
Investment metrics
- 1% rule
- 0.88% ✗
- Cap rate
- 4.67%
- Cash-on-cash
- -5.81%
- DSCR
- 0.74
- GRM
- 9.5
CMA / ARV
- ARV (median comp)
- $296,098
- List price
- $239,900
- Delta
- -12.53%
- Verdict
- UNDERPRICED
- Comps
- 20 within 1.0 mi
Show comp detail 12 sales within ~0.75 mi
| Address | Dist | Beds/Ba | Sqft | Sold | Price | $/sf | Match |
|---|---|---|---|---|---|---|---|
| 5306 NW 19th Pl | 0.22mi | 3/2.0 (+1) | 1,719 (+3%) | 9mo | $344,500 | $200 | 72 |
| 5391 NW 19th Pl | 0.20mi | 3/2.0 (+1) | 1,715 (+3%) | 12mo | $205,000 | $120 | 71 |
| 5195 NW 21st Loop | 0.06mi | 3/2.0 (+1) | 1,840 (+10%) | 8mo | $299,000 | $163 | 69 |
| 5160 NW 25th Loop | 0.33mi | 2/2.0 | 1,569 (-6%) | 8mo | $237,500 | $151 | 68 |
| 5500 NW 23rd Pl | 0.17mi | 3/2.0 (+1) | 1,837 (+10%) | 4mo | $245,000 | $133 | 67 |
| 2218 NW 50th Ave | 0.33mi | 2/2.0 | 1,544 (-8%) | 6mo | $230,000 | $149 | 67 |
| 5535 NW 23rd Pl | 0.21mi | 3/2.0 (+1) | 1,485 (-11%) | 2mo | $280,000 | $189 | 65 |
| 5520 NW 26th Ln | 0.38mi | 3/2.0 (+1) | 1,526 (-9%) | 8mo | $215,000 | $141 | 56 |
| 2570 NW 55th Avenue Rd | 0.39mi | 2/2.0 | 1,914 (+15%) | 10mo | $297,500 | $155 | 49 |
| 1481 NW 48th Ter | 0.70mi | 3/2.0 (+1) | 1,429 (-14%) | 1mo | $240,000 | $168 | 38 |
| 4998 NW 30th Pl | 0.67mi | 3/2.0 (+1) | 1,476 (-12%) | 9mo | $259,000 | $175 | 37 |
| 1400 NW 48th Ter | 0.71mi | 3/2.0 (+1) | 1,428 (-14%) | 3mo | $298,140 | $209 | 36 |
Match score weights: distance 35% · size 25% · config 20% · recency 20%. Top-matched comps best support the ARV.
Projected returns pro-forma
-3.0% appreciation · 8.0% rent growth · sell at horizon
- IRR
- -19.5%
- Equity multiple
- 0.28×
- Total profit
- $-48,193
- Equity at exit
- $35,770
- IRR
- -3.0%
- Equity multiple
- 0.75×
- Total profit
- $-16,865
- Equity at exit
- $20,742
Cash invested: $67,172 (down + closing). Projections, not guarantees.
Landlord ↔ Tenant lean methodology
- Overall (STATE)
- 87 Strongly Landlord-Friendly
- State Florida
- 87 Strongly Landlord-Friendly · R+3
- County
- — inherits STATE
- City
- — inherits STATE
ZIP-level market 34482
- Rents YoY
- 11.1%
- Active inventory
- 670
- Price-to-rent
- 9.5×
Monthly cashflow live
- Estimated rent
- $2,113 high interval (Pro) →
- Mortgage (P&I)
- −$1,258
- Tax from tax record
- −$341 /mo · $4,096/yr
- Insurance
- −$100
- HOA
- −$295
- Vacancy / Maint / Mgmt
- −$444
- Net cashflow
- $-325
Break-even live
Sensitivity live
| Price | -10% $-190 | -5% $-257 | +0% $-325 | +5% $-393 | +10% $-461 |
|---|---|---|---|---|---|
| Rent | -10% $-492 | -5% $-409 | +0% $-325 | +5% $-242 | +10% $-158 |
| Rate | -1.0pp $-205 | -0.5pp $-264 | base $-325 | +0.5pp $-388 | +1.0pp $-451 |
UW: 25.0% down · 7.5% · 30yr · 1.5% tax · 5.0% vac · 8.0% maint · 8.0% mgmt
Financing live
Cash to close
- Down payment
- $59,975
- Closing costs
- $7,197
- Reserves months
- —
- Total cash needed
- —
Loan-product check · same deal, 3 products live
Conventional
25% down · 7.5% · 30yr
- Down + closing
- —
- Monthly P&I
- —
- Monthly cashflow
- —
- DSCR
- —
- Eligible?
- —
Personal DTI + credit; lowest rate.
DSCR
20% down · 8.5% · 30yr
- Down + closing
- —
- Monthly P&I
- —
- Monthly cashflow
- —
- DSCR
- —
- Eligible?
- —
No personal income docs; deal must DSCR.
Hard money
10% down · 12.0% · 12mo
- Down + closing
- —
- Monthly P&I
- —
- Monthly cashflow
- —
- DSCR
- —
- Eligible?
- —
Short-term bridge; refi at stabilization.
Rent comps 27 comps
| Address | Beds | Baths | Sqft | Rent | $/sqft | DOM | Units | Dist |
|---|---|---|---|---|---|---|---|---|
| 1918 NW 50th Cir Ocala, FL | 2.0 | 2.0 | 1061 | $2,200 | $2.07 | 23d | 1 | 0.27mi |
| 5399 NW 18th St Ocala, FL | 2.0 | 2.0 | 1085 | $2,100 | $1.94 | 23d | 1 | 0.28mi |
| 5399 NW 18th St Ocala, FL | 2.0 | 2.0 | 1085 | $2,100 | $1.94 | 15d | 1 | 0.28mi |
| 2048 NW 50th Ave Ocala, FL | 2.0 | 2.0 | 1062 | $2,250 | $2.12 | 23d | 1 | 0.30mi |
| 2038 NW 50th Ave Ocala, FL | 2.0 | 2.0 | 1062 | $2,250 | $2.12 | 23d | 1 | 0.30mi |
| 2028 NW 50th Ave Ocala, FL | 2.0 | 2.0 | 1066 | $1,595 | $1.50 | 23d | 1 | 0.30mi |
| 1527 NW 57th Ct Unit 1 Ocala, FL | 3.0 | 2.0 | 1460 | $1,550 | $1.06 | 23d | 1 | 0.66mi |
| 5353 N US Highway 27 Ocala, FL | 1.0–3.0 | 1.0–2.0 | 1169 | $1,785 | $1.53 | 23d | 1 | 0.66mi |
| 4530 NW 14th Loop Ocala, FL | 3.0 | 2.5 | 1966 | $2,250 | $1.14 | 15d | 1 | 0.86mi |
| 5361 NW 33rd Pl Ocala, FL | 2.0 | 2.0 | 1318 | $2,500 | $1.90 | 23d | 1 | 0.89mi |
| 5333 NW 33rd Pl Ocala, FL | 2.0 | 2.0 | 1368 | $2,300 | $1.68 | 15d | 1 | 0.89mi |
| 3335 NW 52nd Avenue Rd Ocala, FL | 2.0 | 2.5 | 1318 | $2,500 | $1.90 | 23d | 1 | 0.91mi |
| 1017 NW 57th Ct Unit 1019 Ocala, FL | 3.0 | 2.0 | 1162 | $1,649 | $1.42 | 23d | 1 | 0.91mi |
| 3384 NW 54th Ct Ocala, FL | 2.0 | 2.5 | 1722 | $2,300 | $1.34 | 23d | 1 | 0.92mi |
| 5811 NW 10th St Unit 5811 Ocala, FL | 3.0 | 2.0 | 1162 | $1,649 | $1.42 | 23d | 1 | 0.93mi |
| 985 NW 57th Ct Unit 987 Ocala, FL | 3.0 | 2.0 | 1162 | $1,697 | $1.46 | 23d | 1 | 0.93mi |
| 985 NW 57th Ct Unit 985 Ocala, FL | 3.0 | 2.0 | 1162 | $1,649 | $1.42 | 23d | 1 | 0.93mi |
| 5471 NW 34th St Ocala, FL | 2.0 | 2.0 | 1318 | $2,900 | $2.20 | 23d | 1 | 0.94mi |
| 933 NW 57th Ct Unit 935 Ocala, FL | 3.0 | 2.0 | 1162 | $1,649 | $1.42 | 23d | 1 | 0.97mi |
| 5191 NW 34th St Ocala, FL | 2.0 | 2.0 | 1318 | $2,400 | $1.82 | 23d | 1 | 0.97mi |
| 5048 NW 35th St Ocala, FL | 3.0 | 2.0 | 1552 | $1,900 | $1.22 | 15d | 1 | 1.00mi |
| 5423 NW 35th Lane Rd Ocala, FL | 2.0 | 2.0 | 1656 | $3,200 | $1.93 | 23d | 1 | 1.06mi |
| 4859 NW 35th Lane Rd Ocala, FL | 2.0 | 2.0 | 1666 | $2,495 | $1.50 | 23d | 1 | 1.33mi |
| 4122 NW 48th Terrace Rd Ocala, FL | 2.0 | 2.0 | 1816 | $1,999 | $1.10 | 15d | 1 | 1.46mi |
| 5530 NW 40th Loop Ocala, FL | 3.0 | 2.0 | 1622 | $2,000 | $1.23 | 23d | 1 | 1.47mi |
| 311 NW 60th Ave Ocala, FL | 3.0 | 2.0 | 1462 | $1,900 | $1.30 | 23d | 1 | 1.48mi |
| 4743 NW 39th Street Rd Ocala, FL | 3.0 | 2.0 | 1565 | $2,500 | $1.60 | 23d | 1 | 1.48mi |
HOA detail
- Monthly dues
- $295 · $3,540/yr
Listing history 35 events
-
2026-06-21statusdays on market $239,900 Pending 7 DOM
-
2026-06-18days on market $239,900 Active 6 DOM
-
2026-06-17days on market $239,900 Active 5 DOM
-
2026-06-16days on market $239,900 Active 4 DOM
-
2026-06-15days on market $239,900 Active 3 DOM
-
2026-06-13remarks 699-char remark
-
2026-06-13pricedays on market $239,900 Active 1 DOM
-
2026-06-09days on market $259,000 Active 349 DOM
-
2026-06-08days on market $259,000 Active 348 DOM
-
2026-06-07days on market $259,000 Active 347 DOM
-
2026-06-03days on market $259,000 Active 343 DOM
-
2026-06-02days on market $259,000 Active 342 DOM
-
2026-05-31days on market $259,000 Active 340 DOM
-
2026-05-30days on market $259,000 Active 339 DOM
-
2026-04-02price $259,000 1833-char remark
-
2025-06-25$269,500 Active 1833-char remark
-
2025-06-11historical
-
2025-04-14price $275,000
-
2024-07-11$289,000 Active
-
2024-05-02historical
-
2024-05-01price $279,900
-
2024-04-29price $284,900
-
2024-04-25price $289,900
-
2024-04-22price $294,900
-
2024-04-17$299,900 Active
-
2021-06-04soldstatus $211,000
-
2020-10-06soldstatus $140,000
-
2020-09-30soldstatus $140,000
-
2020-07-26$149,000
-
2019-09-09soldstatus $143,500
-
2019-09-06soldstatus $143,500
-
2019-05-25$149,000
-
2012-08-08soldstatus $95,000
-
2012-08-08soldstatus $95,142
-
2011-10-02$104,000
ⓘ Source: listings_history table (triggers on properties + properties_extension) + one-shot
backfill from property_details.listing_events for pre-trigger history.
Tax reassessment forecast FL · Resets to sale price
- Current annual tax
- $4,096 · $341/mo
- Projected year-2 tax
- $4,096 · $341/mo
- Expected delta
- $0/yr ($0/mo · 0.0%)
ⓘ Screening estimate from a state-policy table — verify with the county assessor before closing.
Climate risk First Street
- Flood 3/10 Moderate FEMA zone X (unshaded) · 20% chance over 30 yrs
- Wildfire 4/10 Moderate
- Heat 8/10 Severe 7 d/yr ≥107°F today · 23 d/yr by 30 yrs out
- Wind 9/10 Extreme 99% chance of damaging wind over 30 yrs
- Air quality 3/10 Moderate 3 unhealthy d/yr today · 3 by 30 yrs out
Nearby sold comps map
Loading sold comps map…
Walkable amenities ~0.75 mi
Loading nearby amenities…
Taxation est. · year 1
- Rental income
- $25,351
- − Mortgage interest
- −$13,438
- − Property taxes
- −$4,096
- − Insurance
- −$1,200
- − Repairs & maintenance
- −$2,028
- − Management
- −$2,028
- − HOA
- −$3,540
- − Depreciation
- −$6,979
- Taxable loss
- −$7,957
- Est. tax savings @ 24.0%
- +$1,910
- After-tax cash flow
- $-1,995/yr
For passive investors: Depreciation is non-cash, so a rental often shows a tax loss while cash-flowing — sheltering income. Rental losses are passive: they offset passive income freely, and up to $25,000/yr can offset ordinary (W-2) income if you actively participate and your MAGI is under $100k (phasing out to $0 by $150k); unused losses carry forward. On sale, claimed depreciation is recaptured at up to 25%, and gains may owe capital-gains tax (a 1031 exchange can defer both). Figures are a year-1 estimate at your 24.0% rate — not tax advice; consult a CPA.
Schools (NCES district)
- District
- Marion
- NCES district ID
- 1201260
- Math proficiency
- 42% ▼ -7.00%
- Reading proficiency
- 43% ▼ -4.00%
- Median HH income
- $40,015
- Composite
- 35.61/100
- National rank
- #4890
- State rank
- #61 of 73 in FL
Livability — Ocala
- Score
- 69/100
- State rank
- #476
- US rank
- #8461
Category grades
Schools grade is shown separately in the Schools card above.
Census & demographics
- County
- Marion County · 315,796 people
- City population
- 263,375
- Metro
- Ocala, FL
- Population (ZIP)
- 22,807
- Household income
- $65,901
- Rent vs Own
- Severe rent burden
- 282.0
Population outlook (Marion County) Hauer SSP2
- Today (2025)
- 365,905 people
- By 2030
- 376,768 · +3.0%
- By 2040
- 396,555 · +8.4%
- By 2050
- 412,723 · +12.8%
- By 2075
- 446,090 · +21.9%
- By 2100
- 436,193 · +19.2%
Race, ethnicity, and origin ACS 2023
- Neighborhood character
- Majority White (63%)
- Race & ethnicity
- White 63% Hispanic / Latino 19% Black 14% Two or more races 12%
- Hispanic origin (detail)
- Mexican 6% Puerto Rican 9% Cuban 2%
- Common ancestry
- Lithuanian 2% Romanian 2% Slovak 2%
- Foreign-born
- 10% · Canada
- Languages at home
- 81% English-only · Spanish 16% Other Indo-European 1%
Political lean MEDSL · Marion
- 2024 margin
- Solid R (+31.6) · D 33.8% · R 65.5%
- 2008→2024 swing
- -20.0pp toward R · 2008: -11.6pp · 2024: -31.6pp
- All cycles
- 2024: R+31.6 2020: R+25.9 2016: R+26.2 2012: R+16.2 2008: R+11.6
Not yet ingested
- Civics
- —
Market trends
- HPI YoY
- ▼ -133.62%
- Current HPI
- 194.3857
- Rent YoY
- ▲ 11.12%
- Metro
- Ocala, FL
- State GDP YoY
- ▲ 3.28%
- F500 in state
- 36
Industry mix (Fortune 500 HQ in FL)
| Industry | F500 HQs | Revenue |
|---|---|---|
| Industrial Technology | 2 | $29B |
|
||
| Insurance | 2 | $17B |
|
||
| Retail | 1 | $60B |
|
||
| Technology Distribution | 1 | $58B |
|
||
| Homebuilding | 1 | $35B |
|
||
| Technology Manufacturing | 1 | $35B |
|
||
Price history
+130.7% since first listed24 events — show timeline
- 2026-06-19 Pending — Stellar MLS as Distributed by MLS Grid
- 2026-06-12 Listed $239,900 Stellar MLS as Distributed by MLS Grid
- 2026-06-05 Listing Removed — Stellar MLS as Distributed by MLS Grid
- 2026-04-02 Price Changed $259,000 Stellar MLS as Distributed by MLS Grid
- 2025-06-25 Listed $269,500 Stellar MLS as Distributed by MLS Grid
- 2025-06-11 Listing Removed — Stellar MLS as Distributed by MLS Grid
- 2025-04-14 Price Changed $275,000 Stellar MLS as Distributed by MLS Grid
- 2024-07-11 Listed $289,000 Stellar MLS as Distributed by MLS Grid
- 2024-05-02 Listing Removed — Stellar MLS as Distributed by MLS Grid
- 2024-05-01 Price Changed $279,900 Stellar MLS as Distributed by MLS Grid
- 2024-04-29 Price Changed $284,900 Stellar MLS as Distributed by MLS Grid
- 2024-04-25 Price Changed $289,900 Stellar MLS as Distributed by MLS Grid
- 2024-04-22 Price Changed $294,900 Stellar MLS as Distributed by MLS Grid
- 2024-04-17 Listed $299,900 Stellar MLS as Distributed by MLS Grid
- 2021-06-04 Sold (Public Records) $211,000 Public Records
- 2020-10-06 Sold (Public Records) $140,000 Public Records
- 2020-09-30 Sold (MLS) $140,000 Stellar MLS as Distributed by MLS Grid
- 2020-07-26 Listed $149,000 Stellar MLS as Distributed by MLS Grid
- 2019-09-09 Sold (Public Records) $143,500 Public Records
- 2019-09-06 Sold (MLS) $143,500 Stellar MLS as Distributed by MLS Grid
- 2019-05-25 Listed $149,000 Stellar MLS as Distributed by MLS Grid
- 2012-08-08 Sold (Public Records) $95,142 Public Records
- 2012-08-08 Sold (MLS) $95,000 Stellar MLS as Distributed by MLS Grid
- 2011-10-02 Listed $104,000 Stellar MLS as Distributed by MLS Grid
Property tax history
+13.0%/yrLatest (2025): $4,096 · -1.8% YoY. Source: county tax records.
Cash-flow waterfall
monthlySold comps — $/sqft
last 12 mo · ≤1 miLoading sold comps…