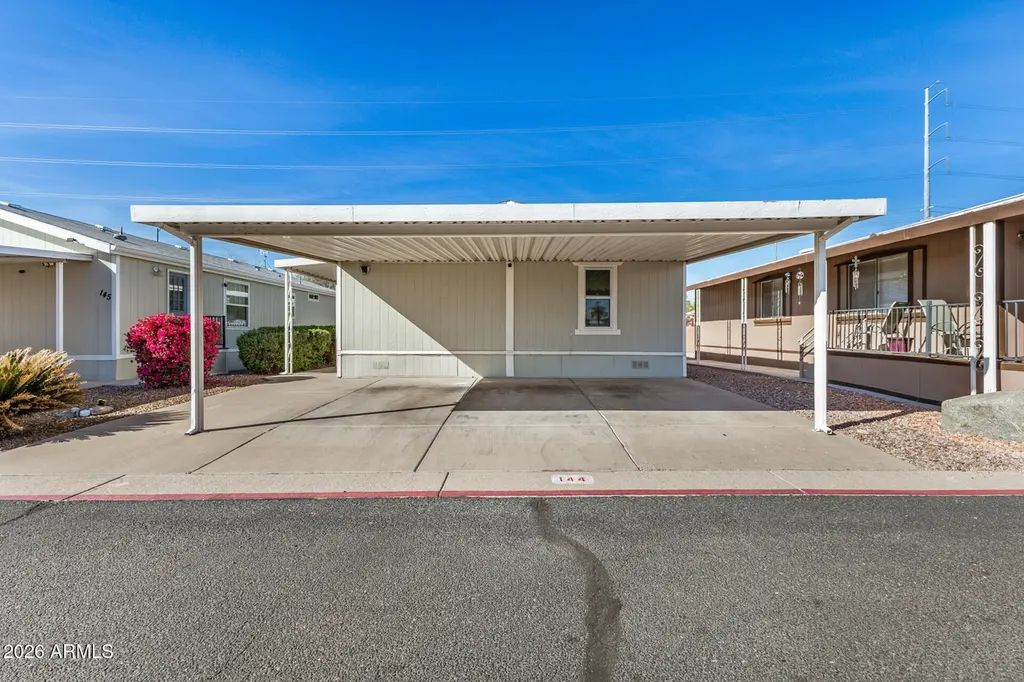
2120 E Bluefield Ave #144 · Phoenix, AZ
Flood risk No data
- FEMA flood zone
- —
- Chance of flooding over 30 yrs
- —
- Est. flood insurance / yr
- —
Fire risk No data
- Est. fire insurance / yr
- —
Heat risk No data
- Hot days now (above threshold)
- —
- Hot days in 30 yrs
- —
Wind risk No data
- Chance of severe wind over 30 yrs
- —
Air-quality risk No data
- Unhealthy air days now
- —
- Unhealthy air days in 30 yrs
- —
Risk factors via First Street. Map © Google.
Why this score? — see what drove the C+ grade
The composite is a weighted blend of 9 inputs, each scored 0–100. Each bar is that input's sub-score; the figure is the points it added to the 100-point composite (weight × sub-score).
- Cash flow +30.0/30.0
- 1% rule +10.0/10.0
- DSCR +10.0/10.0
- Schools +3.8/10.0
- Livability +3.8/5.0
- Condition / age +3.8/5.0
- Rent growth +2.2/5.0
- ARV discount +0.0/15.0
- Appreciation +0.0/10.0
$142,500
🖨 Deal sheet 📄 Offer letter ✓ Due diligence
Listing remarks MLS
Highly Motivated Seller! Amazing opportunity to live in beautiful Buffalo Ridge! Ideally located near restaurants, schools & parks, this home sits at the end of the street with a block wall for added privacy & XL 10x8 storage shed. The property features a 3-car carport & a cozy covered porch. Inside, enjoy vaulted ceilings, laminate flooring, neutral tones & a bright living area flowing into the dining space. The kitchen offers ample storage, tile countertops, and matching appliances. Major upgrades include a whole-house water filtration system which transfers to new owner, energy-efficient double-pane tilt-in windows, and a premium 40-year roof. The primary suite features dual sinks and a walk-in closet. Walk in closets in all bedrooms. Community amenities include a pool, playground, basketball court & dog park
Key facts
- 4,500 sq ft lot
- 3 parking spots
- Community pool
Neighborhood map
What this means for you Summary
Snapshot
- This is a 3-bed/2.0-bath manufactured listed at $142k. Condition is rated good.
Deal economics
- At list price, monthly cash flow is $756 ($9k/yr) — positive.
- The deal already cash-flows at list — no discount required.
- Meets the 1% rule at list price ($2k rent vs $142k).
- Recommended offer: $130k (9.0% below list) — sets the bar for market timing.
- Cap rate 12.7% vs local median 3.3% in Phoenix — top-decile yield for the area; either an underpriced asset or a hidden risk that comps aren't pricing in. Stress-test before assuming the spread holds.
Location & tenants
- Location reads 75/100 on livability (#16 in AZ, #3,924 nationally) — a middle-class / working-renter tenant base. Strengths: amenities A+, commute A+, housing A+; Watch: health & safety C-, crime F.
- Paradise Valley Unified District (4241) (urban): math 39% / reading 46% proficiency, ranked #56 of 249 in AZ (top 22%) — families likely to look elsewhere, expect single-tenant / working-renter base with shorter leases.
- Market conditions: Rents soft (-1.2%/yr); 282 active listings in the ZIP; 40 comparable units currently listed for rent nearby; rentals at typical pace (median 15d on market — plan ~3-4 weeks tenant-placement turnaround); 36,011 units permitted in Maricopa County in 2024 (12,801 in 5+ unit buildings).
- This rent runs 38% of the median local income ($70k/yr) — at the standard rent-burdened threshold; future hikes will face affordability resistance.
Forward outlook
- Local home prices are declining (-3.0%/yr); year-one equity from $985 of loan paydown is wiped out by about $4k of value loss. Plan a longer hold.
- Maricopa County population projected at +38% by 2050 — long-run rental-demand tailwind backs the buy-and-hold thesis.
- At projected returns (-3.0% appreciation + 0.0% rent growth), your $40k cash investment doubles in ~7 years — after that, you're playing with house money.
Negotiation context
- It's been on market 91 days — a 9% lower offer ($130k) is reasonable based on typical stale-listing flexibility.
Questions for the listing agent
- It's been on market 91 days. Have you received any prior offers? Is the seller open to a 9% concession, seller financing, or rate buy-down credit?
- Why hasn't it sold? Are there any deal-killer items the seller is aware of (foundation, flood, title, zoning, code violations)?
- Is there a deadline driving the sale (1031 exchange, divorce, estate, relocation)? That informs how much negotiation room exists.
- Crime grade is F in this area — have there been break-ins, vandalism, or insurance claims at this property in the last 3 years? What carrier currently insures it and at what premium?
- What's the average days-on-market for RENTAL listings here right now (not sales)? A rising rental-DOM trend means longer vacancies and softer asking-rent achievability than the comps imply.
- What's the recent tenant-quality profile in this submarket — average credit score on applications, eviction rate, late-payment / NSF rate, and stable-employment percentage? A property-management company in the area should have these aggregated.
- How much new for-sale + rental construction is in the pipeline within 1–3 miles? Heavy new supply typically softens prices + rents 12–24 months out; constrained supply supports both.
Investment metrics
- 1% rule
- 1.55% ✓
- Cap rate
- 12.66%
- Cash-on-cash
- 22.73%
- DSCR
- 2.01
- GRM
- 5.4
CMA / ARV
- ARV (median comp)
- $102,543
- List price
- $142,500
- Delta
- 38.97%
- Verdict
- OVERPRICED
- Comps
- 20 within 1.0 mi
Show comp detail 12 sales within ~0.75 mi
| Address | Dist | Beds/Ba | Sqft | Sold | Price | $/sf | Match |
|---|---|---|---|---|---|---|---|
| 18223 N 21st Pl #52 | 0.18mi | 3/2.0 | 1,344 (0%) | 1mo | $93,000 | $69 | 91 |
| 18018 N 17th Way | 0.57mi | 3/2.0 | 1,300 (-3%) | 6mo | $114,000 | $88 | 63 |
| 17853 N 16th Way | 0.68mi | 2/2.0 (-1) | 1,350 (+0%) | 2mo | $115,000 | $85 | 61 |
| 1638 E John Cabot Rd | 0.65mi | 2/2.0 (-1) | 1,344 (0%) | 6mo | $85,000 | $63 | 60 |
| 1820 E Grovers Ave | 0.57mi | 3/2.0 | 1,440 (+7%) | 3mo | $284,000 | $197 | 59 |
| 2233 E Behrend Dr #78 | 0.67mi | 3/2.0 | 1,248 (-7%) | 0mo | $69,900 | $56 | 56 |
| 1802 E Campo Bello Dr #29 | 0.63mi | 3/2.0 | 1,232 (-8%) | 4mo | $80,000 | $65 | 53 |
| 2233 E Behrend Dr #26 | 0.67mi | 3/2.0 | 1,456 (+8%) | 5mo | $125,000 | $86 | 50 |
| 17844 N 17th Pl | 0.63mi | 2/2.0 (-1) | 1,456 (+8%) | 3mo | $96,000 | $66 | 49 |
| 2233 E Behrend Dr #197 | 0.66mi | 2/2.0 (-1) | 1,456 (+8%) | 7mo | $145,000 | $100 | 44 |
| 2233 E Behrend Dr #219 | 0.66mi | 2/2.0 (-1) | 1,152 (-14%) | 0mo | $90,000 | $78 | 40 |
| 2233 E Behrend Dr #17 | 0.73mi | 3/2.0 | 1,512 (+12%) | 6mo | $135,000 | $89 | 40 |
Match score weights: distance 35% · size 25% · config 20% · recency 20%. Top-matched comps best support the ARV.
Projected returns pro-forma
-3.0% appreciation · 0.0% rent growth · sell at horizon
- IRR
- 12.2%
- Equity multiple
- 1.47×
- Total profit
- $18,630
- Equity at exit
- $21,247
- IRR
- 18.6%
- Equity multiple
- 2.34×
- Total profit
- $53,397
- Equity at exit
- $12,321
Cash invested: $39,900 (down + closing). Projections, not guarantees.
Landlord ↔ Tenant lean methodology
- Overall (STATE)
- 87 Strongly Landlord-Friendly
- State Arizona
- 87 Strongly Landlord-Friendly · R+3
- County
- — inherits STATE
- City
- — inherits STATE
ZIP-level market 85022
- Rents YoY
- -1.2%
- Active inventory
- 282
- Price-to-rent
- 5.4×
Monthly cashflow live
- Estimated rent
- $2,203 high interval (Pro) →
- Mortgage (P&I)
- −$747
- Tax est. 1.5%
- −$178 /mo · $2,138/yr
- Insurance
- −$59
- HOA
- −$0
- Vacancy / Maint / Mgmt
- −$463
- Net cashflow
- $756
Break-even live
UW: 25.0% down · 7.5% · 30yr · 1.5% tax · 5.0% vac · 8.0% maint · 8.0% mgmt
Financing live
Cash to close
- Down payment
- $35,625
- Closing costs
- $4,275
- Reserves months
- —
- Total cash needed
- —
Loan-product check · same deal, 3 products live
Conventional
25% down · 7.5% · 30yr
- Down + closing
- —
- Monthly P&I
- —
- Monthly cashflow
- —
- DSCR
- —
- Eligible?
- —
Personal DTI + credit; lowest rate.
DSCR
20% down · 8.5% · 30yr
- Down + closing
- —
- Monthly P&I
- —
- Monthly cashflow
- —
- DSCR
- —
- Eligible?
- —
No personal income docs; deal must DSCR.
Hard money
10% down · 12.0% · 12mo
- Down + closing
- —
- Monthly P&I
- —
- Monthly cashflow
- —
- DSCR
- —
- Eligible?
- —
Short-term bridge; refi at stabilization.
Rent comps 40 comps
| Address | Beds | Baths | Sqft | Rent | $/sqft | DOM | Units | Dist |
|---|---|---|---|---|---|---|---|---|
| 2221 E Union Hills Dr #158 Phoenix, AZ | 3.0 | 2.0 | 1332 | $2,100 | $1.58 | 18d | 1 | 0.15mi |
| 18611 N 22nd St Phoenix, AZ | 3.0 | 3.0 | 1851 | $2,200 | $1.19 | 13d | 1 | 0.20mi |
| 18611 N 22nd St #72 Phoenix, AZ | 3.0 | 2.5 | 1851 | $2,200 | $1.19 | 15d | 1 | 0.20mi |
| 2239 E Morrow Dr Phoenix, AZ | 3.0 | 3.0 | 1545 | $2,199 | $1.42 | 3d | 1 | 0.31mi |
| 18660 N Cave Creek Rd Phoenix, AZ | 1.0–3.0 | 1.0–2.0 | 961 | $1,955 | $2.03 | 2d | 11 | 0.31mi |
| 18416 N Cave Creek Rd Phoenix, AZ | 2.0 | 1.0–2.0 | 786 | $3,000 | $3.81 | 4d | 9 | 0.33mi |
| 1717 E Union Hills Dr Phoenix, AZ | 2.0–3.0 | 2.0 | 1245 | $4,000 | $3.21 | 22d | 4 | 0.36mi |
| 1717 E Union Hills Dr Phoenix, AZ | 2.0–3.0 | 2.0 | 1169 | $4,000 | $3.42 | 3d | 3 | 0.36mi |
| 1717 E Union Hills Dr #1052 Phoenix, AZ | 2.0 | 2.0 | 1160 | $4,000 | $3.45 | 44d | 1 | 0.45mi |
| 2335 E Utopia Rd Unit 16 Phoenix, AZ | 3.0 | 2.5 | 1426 | $2,550 | $1.79 | 18d | 1 | 0.60mi |
| 1702 E Michelle Dr Phoenix, AZ | 2.0 | 2.0 | 1300 | $2,200 | $1.69 | 5d | 1 | 0.61mi |
| 2336 E Utopia Rd Phoenix, AZ | 2.0–3.0 | 2.5 | 1327 | $2,395 | $1.80 | 5d | 1 | 0.63mi |
| 2554 E Villa Rita Dr Phoenix, AZ | 2.0 | 1.0 | 1118 | $2,750 | $2.46 | 24d | 1 | 0.69mi |
| 18633 N 15th St Phoenix, AZ | 3.0 | 2.0 | 1240 | $2,249 | $1.81 | 8d | 1 | 0.73mi |
| 17833 N 26th St Phoenix, AZ | 4.0 | 2.0 | 1220 | $2,397 | $1.96 | 1d | 1 | 0.75mi |
| 2602 E Charleston Ave Phoenix, AZ | 3.0 | 2.0 | 1426 | $2,100 | $1.47 | 24d | 1 | 0.75mi |
| 1506 E Wescott Dr Phoenix, AZ | 3.0 | 2.0 | 1136 | $2,045 | $1.80 | 5d | 1 | 0.76mi |
| 1510 E Taro Ln Phoenix, AZ | 3.0 | 2.0 | 1136 | $2,149 | $1.89 | 24d | 1 | 0.77mi |
| 17606 N 17th Pl Phoenix, AZ | 2.0–3.0 | 2.0–2.5 | 1463 | $2,300 | $1.57 | 2d | 3 | 0.78mi |
| 17606 N 17th Pl Phoenix, AZ | 2.0–3.0 | 2.5 | 1472 | $2,300 | $1.56 | 13d | 3 | 0.78mi |
| 1440 E Renee Dr Phoenix, AZ | 3.0 | 2.0 | 1632 | $2,200 | $1.35 | 24d | 1 | 0.80mi |
| 2030 E Wahalla Ln Phoenix, AZ | 3.0 | 2.0 | 1400 | $2,115 | $1.51 | 3d | 1 | 0.84mi |
| 1814 E Bell Rd Phoenix, AZ | 1.0–2.0 | 1.0–2.0 | 1003 | $1,637 | $1.63 | 2d | 12 | 0.85mi |
| 17150 N 23rd St #135 Phoenix, AZ | 2.0 | 2.5 | 1186 | $1,900 | $1.60 | 14d | 1 | 0.86mi |
| 2755 E Michigan Ave Phoenix, AZ | 3.0 | 2.0 | 1316 | $2,700 | $2.05 | 17d | 1 | 0.86mi |
| 2719 E Charleston Ave Phoenix, AZ | 3.0 | 1.5 | 1670 | $1,891 | $1.13 | 22d | 1 | 0.87mi |
| 19635 N Cave Creek Rd Phoenix, AZ | 3.0 | 1.0–2.0 | 999 | $1,933 | $1.93 | 2d | 22 | 0.88mi |
| 2150 E Bell Rd #1102 Phoenix, AZ | 3.0 | 2.5 | 1462 | $1,945 | $1.33 | 15d | 1 | 0.89mi |
| 20007 N 20th Way Phoenix, AZ | 3.0 | 2.0 | 1251 | $3,900 | $3.12 | 44d | 1 | 0.89mi |
| 1420 E Topeka Dr Phoenix, AZ | 3.0 | 2.5 | 1464 | $2,215 | $1.51 | 8d | 1 | 0.89mi |
| 17435 N 16th Pl Phoenix, AZ | 3.0 | 2.5 | 1614 | $2,280 | $1.41 | 20d | 1 | 0.89mi |
| 17365 N Cave Creek Rd #124 Phoenix, AZ | 3.0 | 2.5 | 1468 | $2,299 | $1.57 | 15d | 1 | 0.91mi |
| 17223 N Cave Creek Rd #7 Phoenix, AZ | 3.0 | 3.0 | 1550 | $1,645 | $1.06 | 22d | 1 | 0.93mi |
| 17223 N Cave Creek Rd #7 Phoenix, AZ | 3.0 | 3.0 | 1550 | $1,745 | $1.13 | 24d | 1 | 0.93mi |
| 17150 N 23rd St Phoenix, AZ | 2.0 | 2.0–2.5 | 1172 | $1,712 | $1.46 | 4d | 2 | 0.94mi |
| 17150 N 23rd St Phoenix, AZ | 2.0 | 2.0–2.5 | 1172 | $1,712 | $1.46 | 5d | 2 | 0.94mi |
| 20050 N Cave Creek Rd Phoenix, AZ | 1.0–2.0 | 1.0–2.0 | 909 | $1,770 | $1.95 | 1d | 10 | 0.95mi |
| 19460 N 27th Pl Phoenix, AZ | 4.0 | 2.0 | 1598 | $3,300 | $2.07 | 44d | 1 | 0.95mi |
| 20053 N 21st Pl Phoenix, AZ | 4.0 | 2.0 | 1754 | $3,300 | $1.88 | 24d | 1 | 0.98mi |
| 2636 E Tonto Ln Phoenix, AZ | 3.0 | 2.0 | 1850 | $2,800 | $1.51 | 24d | 1 | 0.98mi |
Listing history 16 events
-
2026-06-18days on market $142,500 Active 91 DOM
-
2026-06-17days on market $142,500 Active 90 DOM
-
2026-06-16days on market $142,500 Active 89 DOM
-
2026-06-15days on market $142,500 Active 88 DOM
-
2026-06-13days on market $142,500 Active 86 DOM
-
2026-06-13days on market $142,500 Active 85 DOM
-
2026-06-09days on market $142,500 Active 82 DOM
-
2026-06-08days on market $142,500 Active 81 DOM
-
2026-06-07days on market $142,500 Active 80 DOM
-
2026-06-04days on market $142,500 Active 77 DOM
-
2026-06-03days on market $142,500 Active 76 DOM
-
2026-06-02days on market $142,500 Active 75 DOM
-
2026-06-01days on market $142,500 Active 74 DOM
-
2026-05-31days on market $142,500 Active 73 DOM
-
2026-04-17price $142,500 843-char remark
Show marketing remark (843 chars)
Highly Motivated Seller! Amazing opportunity to live in beautiful Buffalo Ridge! Ideally located near restaurants, schools & parks, this home sits at the end of the street with a block wall for added privacy & XL 10x8 storage shed. The property features a 3-car carport & a cozy covered porch. Inside, enjoy vaulted ceilings, laminate flooring, neutral tones & a bright living area flowing into the dining space. The kitchen offers ample storage, tile countertops, and matching appliances. Major upgrades include a whole-house water filtration system which transfers to new owner, energy-efficient double-pane tilt-in windows, and a premium 40-year roof. The primary suite features dual sinks and a walk-in closet. Walk in closets in all bedrooms. Community amenities include a pool, playground, basketball court & dog park
-
2026-03-19$147,500 Active 843-char remark
Show marketing remark (843 chars)
Highly Motivated Seller! Amazing opportunity to live in beautiful Buffalo Ridge! Ideally located near restaurants, schools & parks, this home sits at the end of the street with a block wall for added privacy & XL 10x8 storage shed. The property features a 3-car carport & a cozy covered porch. Inside, enjoy vaulted ceilings, laminate flooring, neutral tones & a bright living area flowing into the dining space. The kitchen offers ample storage, tile countertops, and matching appliances. Major upgrades include a whole-house water filtration system which transfers to new owner, energy-efficient double-pane tilt-in windows, and a premium 40-year roof. The primary suite features dual sinks and a walk-in closet. Walk in closets in all bedrooms. Community amenities include a pool, playground, basketball court & dog park
ⓘ Source: listings_history table (triggers on properties + properties_extension) + one-shot
backfill from property_details.listing_events for pre-trigger history.
Nearby sold comps map
Loading sold comps map…
Walkable amenities ~0.75 mi
Loading nearby amenities…
Taxation est. · year 1
- Rental income
- $26,441
- − Mortgage interest
- −$7,982
- − Property taxes
- −$2,138
- − Insurance
- −$712
- − Repairs & maintenance
- −$2,115
- − Management
- −$2,115
- − Depreciation
- −$4,145
- Taxable income
- $7,233
- Est. tax owed @ 24.0%
- −$1,736
- After-tax cash flow
- $7,335/yr
For passive investors: Depreciation is non-cash, so a rental often shows a tax loss while cash-flowing — sheltering income. Rental losses are passive: they offset passive income freely, and up to $25,000/yr can offset ordinary (W-2) income if you actively participate and your MAGI is under $100k (phasing out to $0 by $150k); unused losses carry forward. On sale, claimed depreciation is recaptured at up to 25%, and gains may owe capital-gains tax (a 1031 exchange can defer both). Figures are a year-1 estimate at your 24.0% rate — not tax advice; consult a CPA.
Condition & rehab AI · 12 photos
This manufactured home is in good condition with minor cosmetic updates needed to enhance its resale and rental value.
Value-add opportunities
- Resale Paint the exterior walls — Fresh paint can make the home look more appealing to potential buyers.
- Both Replace the ceiling fans — New ceiling fans can improve the home's energy efficiency and add to the overall comfort.
- Both Clean the windows — Clean windows can make the home look more inviting and increase its curb appeal.
Renovation cost estimate screening
Value-add ROI direction
- Resale Paint the exterior walls — Fresh paint can make the home look more appealing to potential buyers. ↑
- Both Replace the ceiling fans — New ceiling fans can improve the home's energy efficiency and add to the overall comfort. ↑
- Both Clean the windows — Clean windows can make the home look more inviting and increase its curb appeal. ↑
ⓘ Cost ranges are severity-bucket heuristics (US national rule-of-thumb). Get contractor quotes + a written scope before underwriting a rehab budget.
Schools (NCES district)
- District
- Paradise Valley Unified District (4241)
- NCES district ID
- 0405930
- Math proficiency
- 39% ▼ -11.00%
- Reading proficiency
- 46% ▼ -7.00%
- Median HH income
- $64,106
- Composite
- 37.89/100
- National rank
- #4316
- State rank
- #56 of 249 in AZ
Livability — Phoenix
- Score
- 75/100
- State rank
- #16
- US rank
- #3924
Category grades
Schools grade is shown separately in the Schools card above.
Census & demographics
- Census place
- Phoenix, AZ
- County
- Maricopa County · 4,537,380 people
- City population
- 1,500,198
- Metro
- Phoenix-Mesa-Chandler, AZ
- Population (ZIP)
- 53,811
- Household income
- $69,927
- Rent vs Own
- Severe rent burden
- 2976.0
Population outlook (Maricopa County) Hauer SSP2
- Today (2025)
- 4,979,203 people
- By 2030
- 5,378,229 · +8.0%
- By 2040
- 6,156,598 · +23.6%
- By 2050
- 6,872,376 · +38.0%
- By 2075
- 8,401,270 · +68.7%
- By 2100
- 9,247,439 · +85.7%
Race, ethnicity, and origin ACS 2023
- Neighborhood character
- Diverse neighborhood (Simpson 0.59)
- Race & ethnicity
- White 59% Hispanic / Latino 22% Two or more races 11% Black 10% Asian 3% Native American 3%
- Hispanic origin (detail)
- Mexican 18%
- Common ancestry
- Romanian 3% Lithuanian 2% Italian 1%
- Foreign-born
- 14% · Canada, China, Vietnam
- Languages at home
- 79% English-only · Spanish 13% Other Indo-European 2% Russian/Polish/Slavic 1%
Political lean MEDSL · Maricopa
- 2024 margin
- Toss-up / Even · D 47.7% · R 51.2% · Other 1.1%
- 2008→2024 swing
- +7.1pp toward D · 2008: -10.6pp · 2024: -3.5pp
- All cycles
- 2024: R+3.5 2020: D+2.2 2016: R+3.5 2012: R+12.0 2008: R+10.6
Not yet ingested
- Civics
- —
Market trends
- HPI YoY
- ▼ -329.75%
- Current HPI
- 313.5085
- Rent YoY
- ▼ -1.21%
- Metro
- Phoenix-Mesa-Chandler, AZ
- State GDP YoY
- ▲ 4.54%
- F500 in state
- 20
Industry mix (Fortune 500 HQ in AZ)
| Industry | F500 HQs | Revenue |
|---|---|---|
| Technology | 2 | $13B |
|
||
| Mining / Metals | 1 | $23B |
|
||
| Environmental Services | 1 | $16B |
|
||
| Metals / Steel | 1 | $14B |
|
||
| Technology Distribution | 1 | $9B |
|
||
| Homebuilding | 1 | $8B |
|
||
Price history
-3.4% since first listed2 events — show timeline
- 2026-04-17 Price Changed $142,500 ARMLS
- 2026-03-19 Listed $147,500 ARMLS
Cash-flow waterfall
monthlySold comps — $/sqft
last 12 mo · ≤1 miLoading sold comps…