 12-Plex
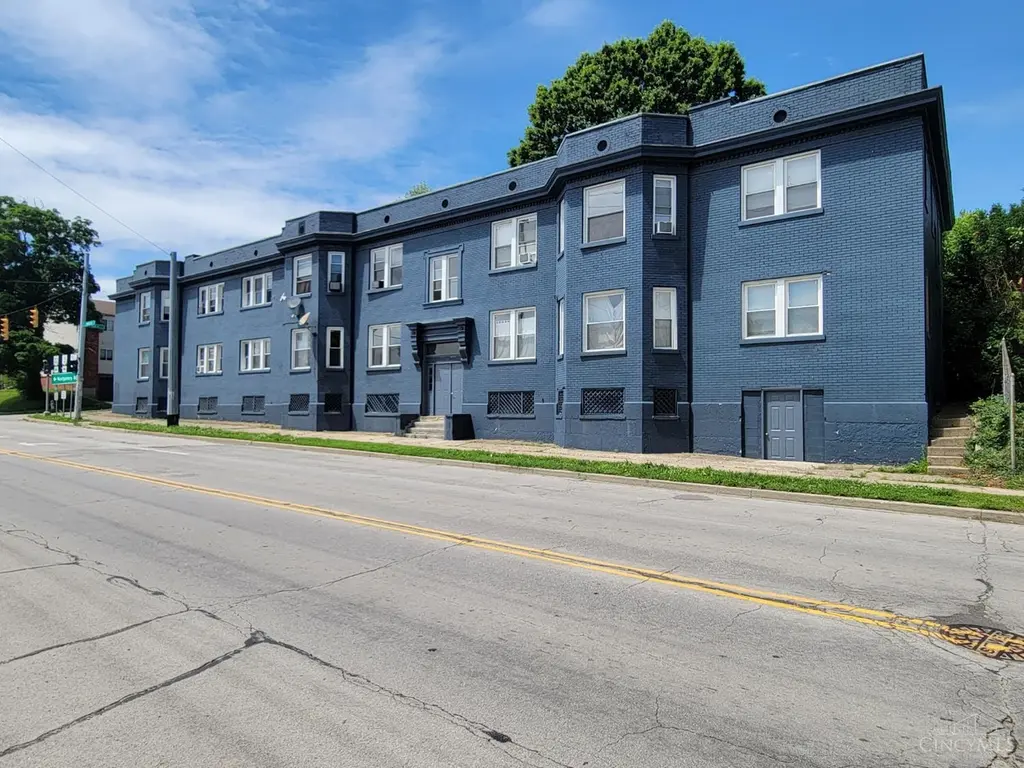
2326 Norwood Ave · Norwood, OH
Flood risk 1/10 · Minimal
- FEMA flood zone
- X (unshaded)
- Chance of flooding over 30 yrs
- 0.0%
- Est. flood insurance / yr
- $507 – $1,088
Fire risk 1/10 · Minimal
- Est. fire insurance / yr
- $713 – $1,323
Heat risk 5/10 · Moderate
- Hot days now (above 103°F)
- 7 days/yr
- Hot days in 30 yrs
- 19 days/yr
Wind risk 2/10 · Minimal
- Chance of severe wind over 30 yrs
- 1.0%
Air-quality risk 4/10 · Minor
- Unhealthy air days now
- 4 days/yr
- Unhealthy air days in 30 yrs
- 5 days/yr
Risk factors via First Street. Map © Google.
Why this score? — see what drove the B- grade
The composite is a weighted blend of 9 inputs, each scored 0–100. Each bar is that input's sub-score; the figure is the points it added to the 100-point composite (weight × sub-score).
- Cash flow +27.1/30.0
- ARV discount +13.7/15.0
- DSCR +9.4/10.0
- 1% rule +6.9/10.0
- Livability +4.0/5.0
- Schools +3.7/10.0
- Rent growth +2.6/5.0
- Condition / age +2.5/5.0
- Appreciation +0.0/10.0
$1,145,000
🖨 Deal sheet 📄 Offer letter ✓ Due diligence
Multi-family units
County records classify this as Multi-Family (5+ Unit). Listing-text estimate: 12 units. confirmed
5+ unit building — per-unit beds/baths from public records are typically unavailable; the breakdown below (if shown) is an estimate from the listing text.
Listing remarks MLS
Money Making 12 unit in Norwood just off the lateral! 11-1bed units and 1-2bed with equity increase opportunity by converting 1bds into 2bds. Many improvements including rubber roof 21, Boiler replaced 16, window AC by tenants, coin laundry split, all new gas stoves last 4 years, windows/exterior paint 20. Units remodeled in 21 including cabinets, granite countertops, flooring, vanities, toilets. Water/heat paid by landlord
Key facts
- Coin laundry
- New gas stoves
- Boiler replaced
Tags
Neighborhood map
What this means for you Summary
Snapshot
- This is a 11×1bd/1ba + 1×2bd/1ba units multifamily listed at $1.15M.
Deal economics
- At list price, monthly cash flow is $3k ($39k/yr) — positive. Per door: $270/mo.
- The deal already cash-flows at list — no discount required.
- Meets the 1% rule at list price ($14k rent vs $1.15M).
- Recommended offer: $1.08M (6.0% below list) — sets the bar for market timing.
- Cap rate 9.7% vs local median 4.7% in Norwood — top-decile yield for the area; either an underpriced asset or a hidden risk that comps aren't pricing in. Stress-test before assuming the spread holds.
Location & tenants
- Location reads 79/100 on livability (#154 in OH, #2,322 nationally) — a middle-class / working-renter tenant base. Strengths: commute A+, cost of living A+, housing A+; Watch: crime C-, employment C-, amenities D+.
- Norwood City (suburban): math 35% / reading 53% proficiency, ranked #513 of 656 in OH (top 78%) — families likely to look elsewhere, expect single-tenant / working-renter base with shorter leases; 62% free/reduced lunch — lower-income household profile, screen leases tightly.
- Market conditions: Rents flat; 56 active listings in the ZIP; 801 units permitted in Hamilton County in 2024 (190 in 5+ unit buildings).
- At $13,592/mo this rent would consume 225% of the median local household income ($72k/yr) (locally 1192% of renters already pay >50% of income on rent) — very limited rent-growth headroom before tenants either downsize or default.
Forward outlook
- Local home prices are declining (-3.0%/yr); year-one equity from $8k of loan paydown is wiped out by about $34k of value loss. Plan a longer hold.
Negotiation context
- It's been on market 65 days — a 6% lower offer ($1.08M) is reasonable based on typical stale-listing flexibility.
- 4 sale attempts since 22y ago; this cycle's ask has dropped $105k (8%) from the opening price — seller is motivated, your offer sets the floor, not the list.
- Current owner paid $140k; list at $1.15M implies a 717% gain — meaningful room to come down on a strong offer.
Risks & watch-outs
- Watch-outs: built in 1915 — expect roof / HVAC / electrical / plumbing capex.
- Climate carrying-cost: extreme-heat days projected 7→19/yr by 2055 (HVAC capex compounding) — expect insurance premiums to compound above CPI over the hold.
Questions for the listing agent
- It's been on market 65 days. Have you received any prior offers? Is the seller open to a 6% concession, seller financing, or rate buy-down credit?
- Can we see the unit-by-unit rent roll, current vacancy, and any below-market leases? What's the average tenancy length?
- What capital expenditures (roof, boiler, parking lot, exteriors) have been made in the last 5 years, and what's planned in the next 2?
- Built in 1915 — when were the roof, HVAC, electrical panel, plumbing, and water heater last replaced?
- Why hasn't it sold? Are there any deal-killer items the seller is aware of (foundation, flood, title, zoning, code violations)?
- Is there a deadline driving the sale (1031 exchange, divorce, estate, relocation)? That informs how much negotiation room exists.
- Schools are B-rated — typically a magnet for longer-tenancy family renters. What's the average tenant stay here, and is there a school-zone premium baked into asking?
- What's the average days-on-market for RENTAL listings here right now (not sales)? A rising rental-DOM trend means longer vacancies and softer asking-rent achievability than the comps imply.
- What's the recent tenant-quality profile in this submarket — average credit score on applications, eviction rate, late-payment / NSF rate, and stable-employment percentage? A property-management company in the area should have these aggregated.
- How much new apartment / multifamily construction is in the pipeline within 1–3 miles? Heavy new supply (>2% of stock underway) typically softens rents 12–24 months out; light construction supports rent growth.
Investment metrics
- 1% rule
- 1.19% ✓
- Cap rate
- 9.69%
- Cash-on-cash
- 12.13%
- DSCR
- 1.54
- GRM
- 7.0
CMA / ARV
- ARV (median comp)
- $1,326,257
- List price
- $1,145,000
- Delta
- -13.67%
- Verdict
- UNDERPRICED
- Comps
- 1 within 2.0 mi
Projected returns pro-forma
-3.0% appreciation · 0.21% rent growth · sell at horizon
- IRR
- -1.4%
- Equity multiple
- 0.95×
- Total profit
- $-16,312
- Equity at exit
- $170,723
- IRR
- 5.2%
- Equity multiple
- 1.33×
- Total profit
- $107,309
- Equity at exit
- $98,999
Cash invested: $320,600 (down + closing). Projections, not guarantees.
Landlord ↔ Tenant lean methodology
- Overall (STATE)
- 73 Landlord-Friendly
- State Ohio
- 73 Landlord-Friendly · R+6
- County
- — inherits STATE
- City
- — inherits STATE
ZIP-level market 45212
- Rents YoY
- 0.2%
- Active inventory
- 56
- Price-to-rent
- 84.7×
Monthly cashflow live
- Estimated rent
- $13,592 high interval (Pro) →
- Mortgage (P&I)
- −$6,005
- Tax from tax record
- −$1,015 /mo · $12,185/yr
- Insurance
- −$477
- HOA
- −$0
- Vacancy / Maint / Mgmt
- −$2,854
- Net cashflow
- $3,241
Break-even live
12-unit breakdown (identical units grouped — click to expand)
| Units | Beds | Baths | Est. rent |
|---|---|---|---|
| 11× units | 1 | 1 | $12,397 |
| #1 | 1 | 1 | $1,127 |
| #2 | 1 | 1 | $1,127 |
| #3 | 1 | 1 | $1,127 |
| #4 | 1 | 1 | $1,127 |
| #5 | 1 | 1 | $1,127 |
| #6 | 1 | 1 | $1,127 |
| #7 | 1 | 1 | $1,127 |
| #8 | 1 | 1 | $1,127 |
| #9 | 1 | 1 | $1,127 |
| #10 | 1 | 1 | $1,127 |
| #11 | 1 | 1 | $1,127 |
| 1× unit | 2 | 1 | $1,199 |
| Total (12 units) | $13,592 | ||
UW: 25.0% down · 7.5% · 30yr · 1.5% tax · 5.0% vac · 8.0% maint · 8.0% mgmt
Financing live
Cash to close
- Down payment
- $286,250
- Closing costs
- $34,350
- Reserves months
- —
- Total cash needed
- —
Loan-product check · same deal, 3 products live
Conventional
25% down · 7.5% · 30yr
- Down + closing
- —
- Monthly P&I
- —
- Monthly cashflow
- —
- DSCR
- —
- Eligible?
- —
Personal DTI + credit; lowest rate.
DSCR
20% down · 8.5% · 30yr
- Down + closing
- —
- Monthly P&I
- —
- Monthly cashflow
- —
- DSCR
- —
- Eligible?
- —
No personal income docs; deal must DSCR.
Hard money
10% down · 12.0% · 12mo
- Down + closing
- —
- Monthly P&I
- —
- Monthly cashflow
- —
- DSCR
- —
- Eligible?
- —
Short-term bridge; refi at stabilization.
Listing history 21 events
-
2026-06-18days on market $1,145,000 Active 65 DOM
-
2026-06-17days on market $1,145,000 Active 64 DOM
-
2026-06-16days on market $1,145,000 Active 63 DOM
-
2026-06-15days on market $1,145,000 Active 62 DOM
-
2026-06-13days on market $1,145,000 Active 60 DOM
-
2026-06-09days on market $1,145,000 Active 56 DOM
-
2026-06-08days on market $1,145,000 Active 55 DOM
-
2026-06-07days on market $1,145,000 Active 54 DOM
-
2026-06-03days on market $1,145,000 Active 50 DOM
-
2026-06-02days on market $1,145,000 Active 49 DOM
-
2026-06-01days on market $1,145,000 Active 48 DOM
-
2026-05-31days on market $1,145,000 Active 47 DOM
-
2026-05-01price $1,195,000 429-char remark
Show marketing remark (429 chars)
Money Making 12 unit in Norwood just off the lateral! 11-1bed units and 1-2bed with equity increase opportunity by converting 1bds into 2bds. Many improvements including rubber roof 21, Boiler replaced 16, window AC by tenants, coin laundry split, all new gas stoves last 4 years, windows/exterior paint 20. Units remodeled in 21 including cabinets, granite countertops, flooring, vanities, toilets. Water/heat paid by landlord
-
2026-04-14$1,250,000 Active 429-char remark
Show marketing remark (429 chars)
Money Making 12 unit in Norwood just off the lateral! 11-1bed units and 1-2bed with equity increase opportunity by converting 1bds into 2bds. Many improvements including rubber roof 21, Boiler replaced 16, window AC by tenants, coin laundry split, all new gas stoves last 4 years, windows/exterior paint 20. Units remodeled in 21 including cabinets, granite countertops, flooring, vanities, toilets. Water/heat paid by landlord
-
2011-02-22soldstatus $140,101 170-char remark
Show marketing remark (170 chars)
Bank owned. Price significantly reduced by nearly 40%! 12 large - 1 BR units located right off of Norwood Lateral. Excellent value-add opportunity in Norwood. Sold as is.
-
2010-09-30$145,000 170-char remark
Show marketing remark (170 chars)
Bank owned. Price significantly reduced by nearly 40%! 12 large - 1 BR units located right off of Norwood Lateral. Excellent value-add opportunity in Norwood. Sold as is.
-
2010-07-15historical
-
2009-07-15$239,000
-
2004-10-12soldstatus $260,000
-
2004-10-08soldstatus $260,000
-
2004-08-02$279,900
ⓘ Source: listings_history table (triggers on properties + properties_extension) + one-shot
backfill from property_details.listing_events for pre-trigger history.
Tax reassessment forecast OH · Partial reset (capped growth)
- Current annual tax
- $12,185 · $1,015/mo
- Projected year-2 tax
- $15,024 · $1,252/mo
- Expected delta
- +$2,838/yr (+$237/mo · 23.3%)
ⓘ Screening estimate from a state-policy table — verify with the county assessor before closing.
Climate risk First Street
- Flood 1/10 Low FEMA zone X (unshaded) · 0% chance over 30 yrs
- Wildfire 1/10 Low
- Heat 5/10 Major 7 d/yr ≥103°F today · 19 d/yr by 30 yrs out
- Wind 2/10 Low 100% chance of damaging wind over 30 yrs
- Air quality 4/10 Moderate 4 unhealthy d/yr today · 5 by 30 yrs out
Nearby sold comps map
Loading sold comps map…
Walkable amenities ~0.75 mi
Loading nearby amenities…
Taxation est. · year 1
- Rental income
- $163,104
- − Mortgage interest
- −$64,138
- − Property taxes
- −$12,185
- − Insurance
- −$5,725
- − Repairs & maintenance
- −$13,048
- − Management
- −$13,048
- − Depreciation
- −$33,309
- Taxable income
- $21,650
- Est. tax owed @ 24.0%
- −$5,196
- After-tax cash flow
- $33,692/yr
For passive investors: Depreciation is non-cash, so a rental often shows a tax loss while cash-flowing — sheltering income. Rental losses are passive: they offset passive income freely, and up to $25,000/yr can offset ordinary (W-2) income if you actively participate and your MAGI is under $100k (phasing out to $0 by $150k); unused losses carry forward. On sale, claimed depreciation is recaptured at up to 25%, and gains may owe capital-gains tax (a 1031 exchange can defer both). Figures are a year-1 estimate at your 24.0% rate — not tax advice; consult a CPA.
Schools (NCES district)
- District
- Norwood City
- NCES district ID
- 3904457
- Math proficiency
- 35% ▼ -24.00%
- Reading proficiency
- 53% ▼ -11.00%
- Median HH income
- $38,750
- Composite
- 36.66/100
- National rank
- #4614
- State rank
- #513 of 656 in OH
Livability — Norwood
- Score
- 79/100
- State rank
- #154
- US rank
- #2322
Category grades
Schools grade is shown separately in the Schools card above.
Census & demographics
- Census place
- Norwood, OH
- County
- Hamilton County · 701,295 people
- City population
- 21,526
- Metro
- Cincinnati, OH-KY-IN
- Population (ZIP)
- 21,526
- Household income
- $72,422
- Rent vs Own
- Severe rent burden
- 1192.0
Population outlook (Hamilton County) Hauer SSP2
- Today (2025)
- 826,054 people
- By 2030
- 830,947 · +0.6%
- By 2040
- 832,319 · +0.8%
- By 2050
- 822,428 · -0.4%
- By 2075
- 788,688 · -4.5%
- By 2100
- 710,674 · -14.0%
Race, ethnicity, and origin ACS 2023
- Neighborhood character
- Predominantly White (73%)
- Race & ethnicity
- White 73% Black 15% Hispanic / Latino 8% Two or more races 5% Asian 1%
- Hispanic origin (detail)
- Mexican 3%
- Common ancestry
- Romanian 2% Lithuanian 1% Slovak 1%
- Foreign-born
- 5% · Canada, China
- Languages at home
- 92% English-only · Spanish 6% Arabic 1% Russian/Polish/Slavic 1%
Political lean MEDSL · Hamilton
- 2024 margin
- D (+14.9) · D 57.0% · R 42.1%
- 2008→2024 swing
- +7.9pp toward D · 2008: 7.0pp · 2024: 14.9pp
- All cycles
- 2024: D+14.9 2020: D+15.9 2016: D+9.5 2012: D+4.9 2008: D+7.0
Not yet ingested
- Civics
- —
Market trends
- HPI YoY
- ▼ -209.95%
- Current HPI
- 295.7088
- Rent YoY
- ▲ 0.21%
- Metro
- Cincinnati, OH-KY-IN
- State GDP YoY
- ▲ 1.98%
- F500 in state
- 48
Industry mix (Fortune 500 HQ in OH)
| Industry | F500 HQs | Revenue |
|---|---|---|
| Insurance | 3 | $145B |
|
||
| Industrial Machinery | 3 | $49B |
|
||
| Financial Services | 3 | $24B |
|
||
| Consumer Goods | 2 | $93B |
|
||
| Aerospace / Defense | 2 | $47B |
|
||
| Utilities | 2 | $33B |
|
||
Price history
+326.9% since first listed9 events — show timeline
- 2026-05-01 Price Changed $1,195,000 Cincy MLS
- 2026-04-14 Listed $1,250,000 Cincy MLS
- 2011-02-22 Sold (MLS) $140,101 Cincy MLS
- 2010-09-30 Listed $145,000 Cincy MLS
- 2010-07-15 Listing Removed — Cincy MLS
- 2009-07-15 Listed $239,000 Cincy MLS
- 2004-10-12 Sold (Public Records) $260,000 Public Records
- 2004-10-08 Sold (MLS) $260,000 Cincy MLS
- 2004-08-02 Listed $279,900 Cincy MLS
Property tax history
+12.1%/yrLatest (2025): $12,185 · +0.3% YoY. Source: county tax records.
Cash-flow waterfall
monthlySold comps — $/sqft
last 12 mo · ≤1 miLoading sold comps…