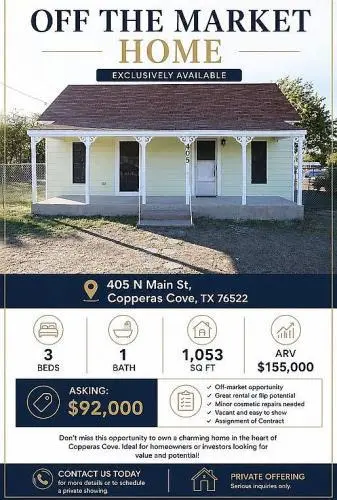
405 N Main St · Copperas Cove, TX
Flood risk 1/10 · Minimal
- FEMA flood zone
- X (unshaded)
- Chance of flooding over 30 yrs
- 0.0%
- Est. flood insurance / yr
- $507 – $1,088
Fire risk 5/10 · Moderate
- Est. fire insurance / yr
- $1,222 – $2,270
Heat risk 7/10 · Major
- Hot days now (above 106°F)
- 7 days/yr
- Hot days in 30 yrs
- 24 days/yr
Wind risk 6/10 · Moderate
- Chance of severe wind over 30 yrs
- 50.0%
Air-quality risk 1/10 · Minimal
- Unhealthy air days now
- 0 days/yr
- Unhealthy air days in 30 yrs
- 0 days/yr
Risk factors via First Street. Map © Google.
Why this score? — see what drove the C grade
The composite is a weighted blend of 9 inputs, each scored 0–100. Each bar is that input's sub-score; the figure is the points it added to the 100-point composite (weight × sub-score).
- Cash flow +18.6/30.0
- ARV discount +15.0/15.0
- 1% rule +6.3/10.0
- DSCR +5.8/10.0
- Schools +3.6/10.0
- Livability +3.2/5.0
- Condition / age +2.5/5.0
- Rent growth +2.4/5.0
- Appreciation +0.0/10.0
$88,000
🖨 Deal sheet 📄 Offer letter ✓ Due diligence
Listing remarks MLS
??PRICE DROP?? ?? 405 N Main St, Copperas Cove, TX ?? 3 Bed | ?? 1 Bath | ?? 1,053 Sq Ft ? Furnished ? Vacant by June 1st ? Livable condition ? Cosmetic value-add opportunity ? Strong upside potential ? Rent for $1,156 ?? Asking: $88,000 OBO ?? Estimated ARV: $155,000 Property is in solid condition but could be updated further to maximize resale value or rental income. Perfect for: • fix & flip • BRRRR strategy • rental investors • first-time investors Assignment of contract. Message for photos, walkthrough, and details. I could also be contacted at +1 813-816-0579
Key facts
- Garage
- Built 1952
- Listed 28 days
Neighborhood map
What this means for you Summary
Snapshot
- This is a 3-bed/1.0-bath single-family listed at $88k.
Deal economics
- At list price, monthly cash flow is $85 ($1k/yr) — positive.
- The deal already cash-flows at list — no discount required.
- Meets the 1% rule at list price ($997 rent vs $88k).
- Recommended offer: $87k (1.5% below list) — sets the bar for market timing.
- Cap rate 7.5% vs local median 3.4% in Copperas Cove — top-decile yield for the area; either an underpriced asset or a hidden risk that comps aren't pricing in. Stress-test before assuming the spread holds.
Location & tenants
- Location reads 65/100 on livability (#706 in TX) — a middle-class / working-renter tenant base. Strengths: cost of living A+, housing A+; Watch: schools C-, employment D+, amenities F.
- Copperas Cove ISD (suburban): math 41% / reading 42% proficiency, ranked #340 of 826 in TX (top 41%) — families likely to look elsewhere, expect single-tenant / working-renter base with shorter leases.
- Market conditions: Rents soft (-0.2%/yr); 605 active listings in the ZIP; 40 comparable units currently listed for rent nearby; rentals lingering (median 44d on market — plan ~5-8 weeks vacancy on turnover, expect pricing pressure); 68% of comp listings sitting > 30 days — soft ceiling on asking rent; 386 units permitted in Coryell County in 2024 (0 in 5+ unit buildings).
- This rent is only 17% of the median local income ($72k/yr) — well below the 30% rent-burden line; pricing power to push rent on renewal without tenant pushback.
Forward outlook
- Local home prices are declining (-3.0%/yr); year-one equity from $608 of loan paydown is wiped out by about $3k of value loss. Plan a longer hold.
Negotiation context
- It's been on market 28 days — a 2% lower offer ($87k) is reasonable based on typical stale-listing flexibility.
- 6 sale attempts since 8y ago with the ask held roughly flat each time — persistent listings suggest the price (not the market) is what's stuck; bring a comps-based counter.
Risks & watch-outs
- Watch-outs: property tax is 2.8% of price; built in 1952 — expect roof / HVAC / electrical / plumbing capex.
- Climate carrying-cost: major wind risk, 50% chance of damaging wind over 30y; moderate wildfire risk; extreme-heat days projected 7→24/yr by 2055 (HVAC capex compounding) — expect insurance premiums to compound above CPI over the hold.
Questions for the listing agent
- Built in 1952 — when were the roof, HVAC, electrical panel, plumbing, and water heater last replaced?
- Property tax is high relative to price — has the assessment been appealed recently, and will the sale trigger a re-assessment?
- Is there a deadline driving the sale (1031 exchange, divorce, estate, relocation)? That informs how much negotiation room exists.
- What's the average days-on-market for RENTAL listings here right now (not sales)? A rising rental-DOM trend means longer vacancies and softer asking-rent achievability than the comps imply.
- What's the recent tenant-quality profile in this submarket — average credit score on applications, eviction rate, late-payment / NSF rate, and stable-employment percentage? A property-management company in the area should have these aggregated.
- How much new for-sale + rental construction is in the pipeline within 1–3 miles? Heavy new supply typically softens prices + rents 12–24 months out; constrained supply supports both.
Investment metrics
- 1% rule
- 1.13% ✓
- Cap rate
- 7.45%
- Cash-on-cash
- 4.15%
- DSCR
- 1.18
- GRM
- 7.4
CMA / ARV
- ARV (on-the-fly)
- $152,685
- Comps found
- 12
Show comp detail 12 sales within ~0.75 mi
| Address | Dist | Beds/Ba | Sqft | Sold | Price | $/sf | Match |
|---|---|---|---|---|---|---|---|
| 102 E Robertson Ave | 0.54mi | 3/1.0 | 1,008 (-4%) | 1mo | $157,500 | $156 | 67 |
| 309 Elm St | 0.69mi | 3/1.0 | 1,071 (+2%) | 2mo | $99,000 | $92 | 63 |
| 110 Kiefer Cir | 0.43mi | 3/1.5 | 1,124 (+7%) | 6mo | $185,000 | $165 | 62 |
| 506 Veterans Ave | 0.75mi | 3/1.0 | 1,034 (-2%) | 3mo | $150,000 | $145 | 60 |
| 707 S 5th St | 0.67mi | 3/1.0 | 1,112 (+6%) | 1mo | $116,000 | $104 | 59 |
| 810 N 19th St | 0.72mi | 3/1.5 | 1,056 (+0%) | 7mo | $130,000 | $123 | 58 |
| 501 Hill St | 0.33mi | 2/1.0 (-1) | 944 (-10%) | 7mo | $120,000 | $127 | 57 |
| 612 N 13th St | 0.53mi | 3/1.5 | 1,152 (+9%) | 2mo | $168,350 | $146 | 56 |
| 413 W Lincoln Ave | 0.27mi | 3/2.0 | 1,200 (+14%) | 6mo | $187,000 | $156 | 56 |
| 904 N 4th St | 0.33mi | 2/1.0 (-1) | 921 (-12%) | 9mo | $148,000 | $161 | 52 |
| 401 Veterans Ave | 0.64mi | 2/1.0 (-1) | 912 (-13%) | 2mo | $98,000 | $107 | 41 |
| 319 Elm St | 0.73mi | 2/1.0 (-1) | 936 (-11%) | 7mo | $40,000 | $43 | 36 |
Match score weights: distance 35% · size 25% · config 20% · recency 20%. Top-matched comps best support the ARV.
Projected returns pro-forma
-3.0% appreciation · 0.0% rent growth · sell at horizon
- IRR
- -13.7%
- Equity multiple
- 0.53×
- Total profit
- $-11,689
- Equity at exit
- $13,121
- IRR
- -11.4%
- Equity multiple
- 0.42×
- Total profit
- $-14,197
- Equity at exit
- $7,609
Cash invested: $24,640 (down + closing). Projections, not guarantees.
Landlord ↔ Tenant lean methodology
- Overall (STATE)
- 87 Strongly Landlord-Friendly
- State Texas
- 87 Strongly Landlord-Friendly · R+5
- County
- — inherits STATE
- City
- — inherits STATE
ZIP-level market 76522
- Home prices YoY
- -22.4%
- Rents YoY
- -0.2%
- Active inventory
- 605
- Price-to-rent
- 7.4×
Monthly cashflow live
- Estimated rent
- $997 high interval (Pro) →
- Mortgage (P&I)
- −$461
- Tax from tax record
- −$205 /mo · $2,457/yr
- Insurance
- −$37
- HOA
- −$0
- Vacancy / Maint / Mgmt
- −$209
- Net cashflow
- $85
Break-even live
UW: 25.0% down · 7.5% · 30yr · 1.5% tax · 5.0% vac · 8.0% maint · 8.0% mgmt
Financing live
Cash to close
- Down payment
- $22,000
- Closing costs
- $2,640
- Reserves months
- —
- Total cash needed
- —
Loan-product check · same deal, 3 products live
Conventional
25% down · 7.5% · 30yr
- Down + closing
- —
- Monthly P&I
- —
- Monthly cashflow
- —
- DSCR
- —
- Eligible?
- —
Personal DTI + credit; lowest rate.
DSCR
20% down · 8.5% · 30yr
- Down + closing
- —
- Monthly P&I
- —
- Monthly cashflow
- —
- DSCR
- —
- Eligible?
- —
No personal income docs; deal must DSCR.
Hard money
10% down · 12.0% · 12mo
- Down + closing
- —
- Monthly P&I
- —
- Monthly cashflow
- —
- DSCR
- —
- Eligible?
- —
Short-term bridge; refi at stabilization.
Rent comps 40 comps
| Address | Beds | Baths | Sqft | Rent | $/sqft | DOM | Units | Dist |
|---|---|---|---|---|---|---|---|---|
| 102 E Truman Ave Copperas Cove, TX | 2.0 | 1.0 | 854 | $725 | $0.85 | 44d | 1 | 0.08mi |
| 505 Hackberry St Unit 18 Copperas Cove, TX | 2.0 | 1.0 | 750 | $675 | $0.90 | 14d | 1 | 0.09mi |
| 505 Hackberry St Unit 25 Copperas Cove, TX | 2.0 | 1.0 | 758 | $675 | $0.89 | 44d | 1 | 0.09mi |
| 604 N Main St Apt C Copperas Cove, TX | 2.0 | 1.5 | 1000 | $750 | $0.75 | 44d | 1 | 0.12mi |
| 604 N Main St Apt D Copperas Cove, TX | 3.0 | 1.5 | 1100 | $900 | $0.82 | 44d | 1 | 0.12mi |
| 401 N 4th St Apt E Copperas Cove, TX | 2.0 | 1.0 | 750 | $700 | $0.93 | 23d | 1 | 0.13mi |
| 204 W Truman Ave Unit D Copperas Cove, TX | 2.0 | 1.0 | 895 | $800 | $0.89 | 44d | 1 | 0.17mi |
| 401 W Lincoln Ave Unit 2 Copperas Cove, TX | 2.0 | 1.0 | 740 | $850 | $1.15 | 23d | 1 | 0.23mi |
| 402 Hill St Unit A Copperas Cove, TX | 2.0 | 1.0 | 800 | $750 | $0.94 | 44d | 1 | 0.24mi |
| 802 Hackberry St Unit B Copperas Cove, TX | 2.0 | 1.0 | 800 | $850 | $1.06 | 44d | 1 | 0.26mi |
| 806 N 3rd St Unit A Copperas Cove, TX | 3.0 | 2.0 | 1130 | $1,150 | $1.02 | 44d | 1 | 0.29mi |
| 412 West Avenue C Unit C Copperas Cove, TX | 3.0 | 2.0 | 1343 | $1,600 | $1.19 | 21d | 1 | 0.31mi |
| 414 West Avenue C Unit C Copperas Cove, TX | 3.0 | 2.0 | 1343 | $1,600 | $1.19 | 44d | 1 | 0.32mi |
| 204 West Avenue F Unit B Copperas Cove, TX | 2.0 | 1.0 | 895 | $705 | $0.79 | 44d | 1 | 0.36mi |
| 807 N 3rd St Unit A Copperas Cove, TX | 2.0 | 1.0 | 800 | $800 | $1.00 | 14d | 1 | 0.36mi |
| 204 West Avenue F Unit A Copperas Cove, TX | 2.0 | 1.0 | 895 | $725 | $0.81 | 44d | 1 | 0.36mi |
| 509 West Avenue B Copperas Cove, TX | 3.0 | 2.0 | 1339 | $1,175 | $0.88 | 23d | 1 | 0.37mi |
| 309 Erby Ave Unit A Copperas Cove, TX | 2.0 | 1.0 | 800 | $824 | $1.03 | 23d | 1 | 0.37mi |
| 306 Erby Ave Unit A Copperas Cove, TX | 2.0 | 1.0 | 795 | $695 | $0.87 | 44d | 1 | 0.39mi |
| 308 Erby Ave Unit C Copperas Cove, TX | 2.0 | 1.0 | 795 | $900 | $1.13 | 44d | 1 | 0.39mi |
| 212 Erby Ave Unit B Copperas Cove, TX | 2.0 | 1.0 | 795 | $850 | $1.07 | 44d | 1 | 0.39mi |
| 811 N 5th St Unit B Copperas Cove, TX | 2.0 | 1.0 | 815 | $675 | $0.83 | 23d | 1 | 0.40mi |
| 204 South Dr Unit A Copperas Cove, TX | 2.0 | 1.0 | 895 | $999 | $1.12 | 44d | 1 | 0.41mi |
| 107 Jason Dr Unit A Copperas Cove, TX | 2.0 | 1.0 | 734 | $925 | $1.26 | 44d | 1 | 0.44mi |
| 201 Jason Dr Unit B Copperas Cove, TX | 2.0 | 1.0 | 814 | $850 | $1.04 | 44d | 1 | 0.47mi |
| 304 Carpenter St Unit 1 Copperas Cove, TX | 2.0 | 1.0 | 850 | $775 | $0.91 | 44d | 1 | 0.48mi |
| 304 Carpenter St Unit 7 Copperas Cove, TX | 2.0 | 1.0 | 850 | $775 | $0.91 | 23d | 1 | 0.48mi |
| 402 Mary St Apt 204 Copperas Cove, TX | 2.0 | 1.0 | 850 | $725 | $0.85 | 44d | 1 | 0.49mi |
| 101 Meggs St Unit F Copperas Cove, TX | 2.0 | 1.0 | 725 | $695 | $0.96 | 44d | 1 | 0.49mi |
| 403 S 7th St Copperas Cove, TX | 3.0 | 1.0 | 910 | $1,100 | $1.21 | 44d | 1 | 0.50mi |
| 605 N 11th St Copperas Cove, TX | 3.0 | 2.0 | 1432 | $1,575 | $1.10 | 44d | 1 | 0.50mi |
| 907 N 7th St Apt B Copperas Cove, TX | 2.0 | 1.0 | 735 | $650 | $0.88 | 23d | 1 | 0.53mi |
| 502 S 9th St Copperas Cove, TX | 3.0 | 1.5 | 1479 | $1,150 | $0.78 | 44d | 1 | 0.54mi |
| 907 North Dr Unit B Copperas Cove, TX | 2.0 | 1.0 | 725 | $850 | $1.17 | 44d | 1 | 0.55mi |
| 208 Veterans Ave Unit 106 Copperas Cove, TX | 2.0 | 1.0 | 829 | $650 | $0.78 | 23d | 1 | 0.57mi |
| 211 E Hogan Dr Copperas Cove, TX | 3.0 | 2.0 | 1372 | $1,400 | $1.02 | 14d | 1 | 0.58mi |
| 114 Nelson Dr Copperas Cove, TX | 3.0 | 2.0 | 1448 | $1,400 | $0.97 | 44d | 1 | 0.60mi |
| 137 Wolfe Rd Apt C Copperas Cove, TX | 2.0 | 1.0 | 768 | $650 | $0.85 | 44d | 1 | 0.64mi |
| 604 S 11th St Copperas Cove, TX | 3.0 | 2.0 | 1119 | $1,300 | $1.16 | 44d | 1 | 0.66mi |
| 910 Hill St Copperas Cove, TX | 3.0 | 1.0 | 1036 | $995 | $0.96 | 23d | 1 | 0.67mi |
Listing history 28 events
-
2026-06-18days on market $88,000 Active 28 DOM
-
2026-06-17days on market $88,000 Active 27 DOM
-
2026-06-16days on market $88,000 Active 26 DOM
-
2026-06-15days on market $88,000 Active 25 DOM
-
2026-06-14days on market $88,000 Active 23 DOM
-
2026-06-13days on market $88,000 Active 22 DOM
-
2026-06-10days on market $88,000 Active 20 DOM
-
2026-06-09days on market $88,000 Active 19 DOM
-
2026-06-08days on market $88,000 Active 18 DOM
-
2026-06-07days on market $88,000 Active 17 DOM
-
2026-06-05days on market $88,000 Active 14 DOM
-
2026-06-03days on market $88,000 Active 13 DOM
-
2026-06-02days on market $88,000 Active 12 DOM
-
2026-06-01days on market $88,000 Active 11 DOM
-
2026-05-31days on market $88,000 Active 10 DOM
-
2026-05-30days on market $88,000 Active 9 DOM
-
2026-05-20$88,000 Active
-
2026-05-17$88,000 Active 660-char remark
Show marketing remark (660 chars)
??PRICE DROP?? ?? 405 N Main St, Copperas Cove, TX ?? 3 Bed | ?? 1 Bath | ?? 1,053 Sq Ft ? Furnished ? Vacant by June 1st ? Livable condition ? Cosmetic value-add opportunity ? Strong upside potential ? Rent for $1,156 ?? Asking: $88,000 OBO ?? Estimated ARV: $155,000 Property is in solid condition but could be updated further to maximize resale value or rental income. Perfect for: • fix & flip • BRRRR strategy • rental investors • first-time investors Assignment of contract. Message for photos, walkthrough, and details. I could also be contacted at +1 813-816-0579
-
2026-04-08historical
-
2025-12-02price $115,000
-
2025-11-10price $120,000
-
2025-11-05price $128,000
-
2025-10-24price $134,000
-
2025-10-17$144,900 Active
-
2020-03-26soldstatus
-
2020-03-18$68,000
-
2019-09-13$68,000
-
2018-10-24$45,000
ⓘ Source: listings_history table (triggers on properties + properties_extension) + one-shot
backfill from property_details.listing_events for pre-trigger history.
Tax reassessment forecast TX · Resets to sale price
- Current annual tax
- $2,457 · $205/mo
- Projected year-2 tax
- $2,457 · $205/mo
- Expected delta
- $0/yr ($0/mo · 0.0%)
ⓘ Screening estimate from a state-policy table — verify with the county assessor before closing.
Climate risk First Street
- Flood 1/10 Low FEMA zone X (unshaded) · 0% chance over 30 yrs
- Wildfire 5/10 Major
- Heat 7/10 Severe 7 d/yr ≥106°F today · 24 d/yr by 30 yrs out
- Wind 6/10 Major 50% chance of damaging wind over 30 yrs
- Air quality 1/10 Low 0 unhealthy d/yr today · 0 by 30 yrs out
Nearby sold comps map
Loading sold comps map…
Walkable amenities ~0.75 mi
Loading nearby amenities…
Taxation est. · year 1
- Rental income
- $11,969
- − Mortgage interest
- −$4,929
- − Property taxes
- −$2,457
- − Insurance
- −$440
- − Repairs & maintenance
- −$958
- − Management
- −$958
- − Depreciation
- −$2,560
- Taxable loss
- −$332
- Est. tax savings @ 24.0%
- +$80
- After-tax cash flow
- $1,101/yr
For passive investors: Depreciation is non-cash, so a rental often shows a tax loss while cash-flowing — sheltering income. Rental losses are passive: they offset passive income freely, and up to $25,000/yr can offset ordinary (W-2) income if you actively participate and your MAGI is under $100k (phasing out to $0 by $150k); unused losses carry forward. On sale, claimed depreciation is recaptured at up to 25%, and gains may owe capital-gains tax (a 1031 exchange can defer both). Figures are a year-1 estimate at your 24.0% rate — not tax advice; consult a CPA.
Schools (NCES district)
- District
- Copperas Cove ISD
- NCES district ID
- 4815240
- Math proficiency
- 41% ▼ -6.00%
- Reading proficiency
- 42% ▼ -2.00%
- Median HH income
- $51,072
- Composite
- 35.85/100
- National rank
- #4822
- State rank
- #340 of 826 in TX
Livability — Copperas Cove
- Score
- 65/100
- State rank
- #706
- US rank
- #13158
Category grades
Schools grade is shown separately in the Schools card above.
Census & demographics
- Census place
- Copperas Cove, TX
- County
- Coryell County · 61,053 people
- City population
- 42,118
- Metro
- Killeen-Temple, TX
- Population (ZIP)
- 42,118
- Household income
- $72,206
- Rent vs Own
- Severe rent burden
- 1019.0
Population outlook (Coryell County) Hauer SSP2
- Today (2025)
- 75,485 people
- By 2030
- 75,627 · +0.2%
- By 2040
- 74,898 · -0.8%
- By 2050
- 74,221 · -1.7%
- By 2075
- 72,688 · -3.7%
- By 2100
- 66,862 · -11.4%
Race, ethnicity, and origin ACS 2023
- Neighborhood character
- Diverse neighborhood (Simpson 0.66)
- Race & ethnicity
- White 53% Hispanic / Latino 21% Two or more races 20% Black 14% Asian 2%
- Hispanic origin (detail)
- Mexican 11% Puerto Rican 6%
- Common ancestry
- Romanian 2% Italian 2% Lithuanian 2%
- Foreign-born
- 7% · Canada, South Korea
- Languages at home
- 85% English-only · Spanish 10% German/W. Germanic 2% Other Asian/Pacific 1%
Political lean MEDSL · Coryell
- 2024 margin
- Solid R (+40.7) · D 29.1% · R 69.8% · Other 1.1%
- 2008→2024 swing
- -13.8pp toward R · 2008: -26.9pp · 2024: -40.7pp
- All cycles
- 2024: R+40.7 2020: R+33.5 2016: R+39.5 2012: R+36.6 2008: R+26.9
Not yet ingested
- Civics
- —
Market trends
- HPI YoY
- ▼ -53.11%
- Current HPI
- 183.9452
- Rent YoY
- ▼ -0.25%
- Metro
- Killeen-Temple, TX
- State GDP YoY
- ▲ 3.95%
- F500 in state
- 110
Industry mix (Fortune 500 HQ in TX)
| Industry | F500 HQs | Revenue |
|---|---|---|
| Energy | 16 | $1,198B |
|
||
| Technology | 5 | $198B |
|
||
| Engineering / Construction | 4 | $72B |
|
||
| Energy Services | 3 | $60B |
|
||
| Utilities | 3 | $41B |
|
||
| Healthcare | 2 | $330B |
|
||
Price history
+95.6% since first listed12 events — show timeline
- 2026-05-20 Listed $88,000 Fizber.com
- 2026-05-17 Listed $88,000 FSBO.com
- 2026-04-08 Listing Removed — CTXMLS
- 2025-12-02 Price Changed $115,000 CTXMLS
- 2025-11-10 Price Changed $120,000 CTXMLS
- 2025-11-05 Price Changed $128,000 CTXMLS
- 2025-10-24 Price Changed $134,000 CTXMLS
- 2025-10-17 Listed $144,900 CTXMLS
- 2020-03-26 Sold (MLS) — Unlock MLS
- 2020-03-18 Listed $68,000 Unlock MLS
- 2019-09-13 Listed $68,000 CTXMLS
- 2018-10-24 Listed $45,000 CTXMLS
Property tax history
+4.5%/yrLatest (2025): $2,457 · +10.6% YoY. Source: county tax records.
Cash-flow waterfall
monthlySold comps — $/sqft
last 12 mo · ≤1 miLoading sold comps…