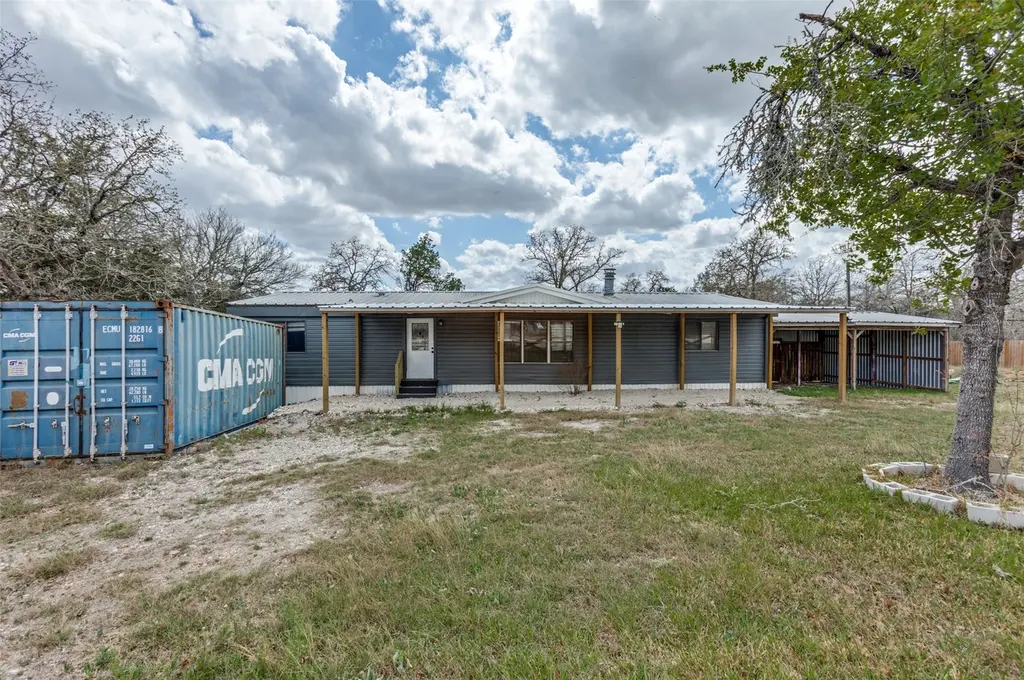
133 Deer Run · Smithville, TX
Flood risk 1/10 · Minimal
- FEMA flood zone
- X (unshaded)
- Chance of flooding over 30 yrs
- 0.0%
- Est. flood insurance / yr
- $507 – $1,088
Fire risk 4/10 · Minor
- Est. fire insurance / yr
- $1,222 – $2,270
Heat risk 8/10 · Major
- Hot days now (above 110°F)
- 7 days/yr
- Hot days in 30 yrs
- 22 days/yr
Wind risk 8/10 · Major
- Chance of severe wind over 30 yrs
- 90.0%
Air-quality risk 1/10 · Minimal
- Unhealthy air days now
- 0 days/yr
- Unhealthy air days in 30 yrs
- 0 days/yr
Risk factors via First Street. Map © Google.
Why this score? — see what drove the C- grade
The composite is a weighted blend of 9 inputs, each scored 0–100. Each bar is that input's sub-score; the figure is the points it added to the 100-point composite (weight × sub-score).
- Cash flow +15.2/30.0
- ARV discount +15.0/15.0
- DSCR +4.7/10.0
- 1% rule +3.9/10.0
- Schools +3.6/10.0
- Livability +3.4/5.0
- Rent growth +2.5/5.0
- Condition / age +2.5/5.0
- Appreciation +0.0/10.0
$175,000
🖨 Deal sheet 📄 Offer letter ✓ Due diligence
Listing remarks MLS
Welcome to 133 Deer Run, a peaceful retreat nestled among mature trees in the heart of Smithville. This property offers a spacious layout filled with natural light, creating a warm and inviting atmosphere. Enjoy the large outdoor space—perfect for relaxing, entertaining, or enjoying the quiet surroundings. Conveniently located near local shops, dining, and major highways, this home offers the ideal balance of comfort and convenience. A great opportunity for a primary home, weekend getaway, or investment property!
Key facts
- Large outdoor space
- Dining
- Local shops
Tags
Neighborhood map
What this means for you Summary
Snapshot
- This is a 3-bed/2.0-bath manufactured listed at $175k.
Deal economics
- At list price, monthly cash flow is $62 ($738/yr) — positive.
- The deal already cash-flows at list — no discount required.
- To meet the 1% rule (rent ≥ 1% of price), the offer needs to be $155k (11.5% below list).
- Recommended offer: $155k (11.5% below list) — sets the bar for 1% rule.
- Cap rate 6.7% vs local median 3.0% in Smithville — top-decile yield for the area; either an underpriced asset or a hidden risk that comps aren't pricing in. Stress-test before assuming the spread holds.
Location & tenants
- Location reads 67/100 on livability (#577 in TX) — a middle-class / working-renter tenant base. Strengths: crime A+, cost of living A+, housing A+; Watch: schools D, amenities F, commute F.
- Smithville ISD (town): math 42% / reading 42% proficiency, ranked #333 of 826 in TX (top 40%) — families likely to look elsewhere, expect single-tenant / working-renter base with shorter leases.
- Market conditions: 250 active listings in the ZIP; 2 comparable units currently listed for rent nearby; 1,841 units permitted in Bastrop County in 2024 (150 in 5+ unit buildings).
Forward outlook
- Local home prices are declining (-3.0%/yr); year-one equity from $1k of loan paydown is wiped out by about $5k of value loss. Plan a longer hold.
- Bastrop County population projected at +37% by 2050 — long-run rental-demand tailwind backs the buy-and-hold thesis.
Negotiation context
- It's been on market 78 days — a 6% lower offer ($164k) is reasonable based on typical stale-listing flexibility.
- 17 sale attempts since 24y ago; this cycle's ask has dropped $10k (5%) from the opening price — seller is motivated, your offer sets the floor, not the list.
Risks & watch-outs
- Climate carrying-cost: severe wind risk, 90% chance of damaging wind over 30y; extreme-heat days projected 7→22/yr by 2055 (HVAC capex compounding) — expect insurance premiums to compound above CPI over the hold.
Questions for the listing agent
- It's been on market 78 days. Have you received any prior offers? Is the seller open to a 11% concession, seller financing, or rate buy-down credit?
- What does the HOA fee cover, when was the last increase, and are there any pending special assessments or reserve-fund shortfalls?
- Why hasn't it sold? Are there any deal-killer items the seller is aware of (foundation, flood, title, zoning, code violations)?
- Is there a deadline driving the sale (1031 exchange, divorce, estate, relocation)? That informs how much negotiation room exists.
- Schools are D-rated, which usually means shorter tenancies and higher turnover. Who's the typical renter profile here, and what's been the actual vacancy rate?
- What's the average days-on-market for RENTAL listings here right now (not sales)? A rising rental-DOM trend means longer vacancies and softer asking-rent achievability than the comps imply.
- What's the recent tenant-quality profile in this submarket — average credit score on applications, eviction rate, late-payment / NSF rate, and stable-employment percentage? A property-management company in the area should have these aggregated.
- How much new for-sale + rental construction is in the pipeline within 1–3 miles? Heavy new supply typically softens prices + rents 12–24 months out; constrained supply supports both.
Investment metrics
- 1% rule
- 0.89% ✗
- Cap rate
- 6.71%
- Cash-on-cash
- 1.51%
- DSCR
- 1.07
- GRM
- 9.4
CMA / ARV
- ARV (median comp)
- $235,000
- List price
- $175,000
- Delta
- -25.53%
- Verdict
- UNDERPRICED
- Comps
- 3 within 2.0 mi
Show comp detail 2 sales within ~0.75 mi
| Address | Dist | Beds/Ba | Sqft | Sold | Price | $/sf | Match |
|---|---|---|---|---|---|---|---|
| 107 Chief | 0.15mi | 3/2.0 | 1,680 (+5%) | 11mo | $249,999 | $149 | 76 |
| 101 Laguna Dr | 0.57mi | 3/2.0 | 1,372 (-14%) | 24mo | $214,000 | $156 | 30 |
Match score weights: distance 35% · size 25% · config 20% · recency 20%. Top-matched comps best support the ARV.
Projected returns pro-forma
-3.0% appreciation · 3.0% rent growth · sell at horizon
- IRR
- -13.9%
- Equity multiple
- 0.50×
- Total profit
- $-24,444
- Equity at exit
- $26,093
- IRR
- -5.1%
- Equity multiple
- 0.67×
- Total profit
- $-16,261
- Equity at exit
- $15,131
Cash invested: $49,000 (down + closing). Projections, not guarantees.
Landlord ↔ Tenant lean methodology
- Overall (STATE)
- 87 Strongly Landlord-Friendly
- State Texas
- 87 Strongly Landlord-Friendly · R+5
- County
- — inherits STATE
- City
- — inherits STATE
ZIP-level market 78957
- Home prices YoY
- -22.3%
- Active inventory
- 250
- Price-to-rent
- 9.4×
Monthly cashflow live
- Estimated rent
- $1,549 medium interval (Pro) →
- Mortgage (P&I)
- −$918
- Tax from tax record
- −$159 /mo · $1,907/yr
- Insurance
- −$73
- HOA
- −$13
- Vacancy / Maint / Mgmt
- −$325
- Net cashflow
- $62
Break-even live
Sensitivity live
| Price | -10% $161 | -5% $111 | +0% $62 | +5% $12 | +10% $-38 |
|---|---|---|---|---|---|
| Rent | -10% $-61 | -5% $0 | +0% $62 | +5% $123 | +10% $184 |
| Rate | -1.0pp $150 | -0.5pp $106 | base $62 | +0.5pp $16 | +1.0pp $-30 |
UW: 25.0% down · 7.5% · 30yr · 1.5% tax · 5.0% vac · 8.0% maint · 8.0% mgmt
Financing live
Cash to close
- Down payment
- $43,750
- Closing costs
- $5,250
- Reserves months
- —
- Total cash needed
- —
Loan-product check · same deal, 3 products live
Conventional
25% down · 7.5% · 30yr
- Down + closing
- —
- Monthly P&I
- —
- Monthly cashflow
- —
- DSCR
- —
- Eligible?
- —
Personal DTI + credit; lowest rate.
DSCR
20% down · 8.5% · 30yr
- Down + closing
- —
- Monthly P&I
- —
- Monthly cashflow
- —
- DSCR
- —
- Eligible?
- —
No personal income docs; deal must DSCR.
Hard money
10% down · 12.0% · 12mo
- Down + closing
- —
- Monthly P&I
- —
- Monthly cashflow
- —
- DSCR
- —
- Eligible?
- —
Short-term bridge; refi at stabilization.
Rent comps 2 comps
| Address | Beds | Baths | Sqft | Rent | $/sqft | DOM | Units | Dist |
|---|---|---|---|---|---|---|---|---|
| 175 Shawnee Dr Unit A Smithville, TX | 3.0 | 2.0 | 1700 | $1,650 | $0.97 | 8d | 1 | 1.33mi |
| 104 Shoshoni Dr Smithville, TX | 3.0 | 2.0 | 1100 | $1,400 | $1.27 | 18d | 1 | 1.46mi |
HOA detail
- Monthly dues
- $13 · $156/yr
Listing history 50 events
-
2026-06-09days on market $175,000 Active 78 DOM
-
2026-06-08days on market $175,000 Active 77 DOM
-
2026-06-07days on market $175,000 Active 76 DOM
-
2026-06-05days on market $175,000 Active 73 DOM
-
2026-06-03days on market $175,000 Active 72 DOM
-
2026-06-02days on market $175,000 Active 71 DOM
-
2026-06-01days on market $175,000 Active 70 DOM
-
2026-05-31days on market $175,000 Active 69 DOM
-
2026-04-30price $175,000 524-char remark
Show marketing remark (524 chars)
Welcome to 133 Deer Run, a peaceful retreat nestled among mature trees in the heart of Smithville. This property offers a spacious layout filled with natural light, creating a warm and inviting atmosphere. Enjoy the large outdoor space—perfect for relaxing, entertaining, or enjoying the quiet surroundings. Conveniently located near local shops, dining, and major highways, this home offers the ideal balance of comfort and convenience. A great opportunity for a primary home, weekend getaway, or investment property!
-
2026-03-23$185,000 Active 524-char remark
Show marketing remark (524 chars)
Welcome to 133 Deer Run, a peaceful retreat nestled among mature trees in the heart of Smithville. This property offers a spacious layout filled with natural light, creating a warm and inviting atmosphere. Enjoy the large outdoor space—perfect for relaxing, entertaining, or enjoying the quiet surroundings. Conveniently located near local shops, dining, and major highways, this home offers the ideal balance of comfort and convenience. A great opportunity for a primary home, weekend getaway, or investment property!
-
2025-06-25price
-
2025-05-15price
-
2025-04-19Active
-
2023-08-03soldstatus Closed
-
2023-07-25status Pending
-
2023-06-28price $110,000
-
2023-05-17price $135,000
-
2023-04-11$145,000 Active
-
2022-10-26price
-
2022-09-27status Active
-
2022-09-22historical Active Under Contract
-
2022-07-15Active
-
2014-05-09soldstatus
-
2014-04-21soldstatus Sold
-
2014-03-29status Pending - Taking Backups
-
2013-12-12price $59,900
-
2013-10-10price $49,900
-
2013-04-02$59,900 Active
-
2012-09-04historical Expired
-
2012-05-27price
-
2011-02-08price
-
2010-07-03Active
-
2008-07-18historical
-
2008-03-14historical
-
2008-01-18
-
2007-09-14
-
2007-09-08historical
-
2007-03-08
-
2006-10-10historical
-
2006-04-12
-
2005-11-03historical
-
2005-05-03
-
2005-04-05historical
-
2004-10-05
-
2004-09-30historical
-
2004-02-19
-
2004-02-18historical
-
2003-08-05
-
2003-05-08historical
-
2002-11-08
ⓘ Source: listings_history table (triggers on properties + properties_extension) + one-shot
backfill from property_details.listing_events for pre-trigger history.
Tax reassessment forecast TX · Resets to sale price
- Current annual tax
- $1,907 · $159/mo
- Projected year-2 tax
- $3,202 · $267/mo
- Expected delta
- +$1,296/yr (+$108/mo · 67.9%)
ⓘ Screening estimate from a state-policy table — verify with the county assessor before closing.
Climate risk First Street
- Flood 1/10 Low FEMA zone X (unshaded) · 0% chance over 30 yrs
- Wildfire 4/10 Moderate
- Heat 8/10 Severe 7 d/yr ≥110°F today · 22 d/yr by 30 yrs out
- Wind 8/10 Severe 90% chance of damaging wind over 30 yrs
- Air quality 1/10 Low 0 unhealthy d/yr today · 0 by 30 yrs out
Nearby sold comps map
Loading sold comps map…
Walkable amenities ~0.75 mi
Loading nearby amenities…
Taxation est. · year 1
- Rental income
- $18,594
- − Mortgage interest
- −$9,803
- − Property taxes
- −$1,907
- − Insurance
- −$875
- − Repairs & maintenance
- −$1,487
- − Management
- −$1,487
- − HOA
- −$156
- − Depreciation
- −$5,091
- Taxable loss
- −$2,213
- Est. tax savings @ 24.0%
- +$531
- After-tax cash flow
- $1,269/yr
For passive investors: Depreciation is non-cash, so a rental often shows a tax loss while cash-flowing — sheltering income. Rental losses are passive: they offset passive income freely, and up to $25,000/yr can offset ordinary (W-2) income if you actively participate and your MAGI is under $100k (phasing out to $0 by $150k); unused losses carry forward. On sale, claimed depreciation is recaptured at up to 25%, and gains may owe capital-gains tax (a 1031 exchange can defer both). Figures are a year-1 estimate at your 24.0% rate — not tax advice; consult a CPA.
Schools (NCES district)
- District
- Smithville ISD
- NCES district ID
- 4840550
- Math proficiency
- 42% ▼ -2.00%
- Reading proficiency
- 42% ▼ -4.00%
- Median HH income
- $48,794
- Composite
- 36.04/100
- National rank
- #4776
- State rank
- #333 of 826 in TX
Livability — Smithville
- Score
- 67/100
- State rank
- #577
- US rank
- #11003
Category grades
Schools grade is shown separately in the Schools card above.
Census & demographics
- Population (ZIP)
- 10,282
Population outlook (Bastrop County) Hauer SSP2
- Today (2025)
- 94,260 people
- By 2030
- 101,355 · +7.5%
- By 2040
- 115,578 · +22.6%
- By 2050
- 129,464 · +37.3%
- By 2075
- 168,068 · +78.3%
- By 2100
- 194,857 · +106.7%
Race, ethnicity, and origin ACS 2023
- Neighborhood character
- Predominantly White (65%)
- Race & ethnicity
- White 65% Hispanic / Latino 21% Two or more races 19% Black 8%
- Hispanic origin (detail)
- Mexican 18%
- Common ancestry
- Slovak 4% Iranian 2% Serbian 1%
- Foreign-born
- 8% · Canada
- Languages at home
- 86% English-only · Spanish 13%
Political lean MEDSL · Bastrop
- 2024 margin
- R (+18.4) · D 40.2% · R 58.6% · Other 1.2%
- 2008→2024 swing
- -10.2pp toward R · 2008: -8.2pp · 2024: -18.4pp
- All cycles
- 2024: R+18.4 2020: R+13.8 2016: R+20.4 2012: R+17.0 2008: R+8.2
Not yet ingested
- Civics
- —
Market trends
- HPI YoY
- ▼ -79.22%
- Current HPI
- 275.3765
- Rent YoY
- —
- Metro
- —
- State GDP YoY
- ▲ 3.95%
- F500 in state
- 110
Industry mix (Fortune 500 HQ in TX)
| Industry | F500 HQs | Revenue |
|---|---|---|
| Energy | 16 | $1,198B |
|
||
| Technology | 5 | $198B |
|
||
| Engineering / Construction | 4 | $72B |
|
||
| Energy Services | 3 | $60B |
|
||
| Utilities | 3 | $41B |
|
||
| Healthcare | 2 | $330B |
|
||
Price history
+257.1% since first listed45 events — show timeline
- 2026-04-30 Price Changed $175,000 Unlock MLS
- 2026-03-23 Listed $185,000 Unlock MLS
- 2025-06-25 Price Changed — Unlock MLS
- 2025-05-15 Price Changed — Unlock MLS
- 2025-04-19 Listed — Unlock MLS
- 2023-08-03 Sold (MLS) — Unlock MLS
- 2023-07-25 Pending — Unlock MLS
- 2023-06-28 Price Changed $110,000 Unlock MLS
- 2023-05-17 Price Changed $135,000 Unlock MLS
- 2023-04-11 Listed $145,000 Unlock MLS
- 2022-10-26 Price Changed — Unlock MLS
- 2022-09-27 Relisted — Unlock MLS
- 2022-09-22 Contingent — Unlock MLS
- 2022-07-15 Listed — Unlock MLS
- 2014-05-09 Sold (Public Records) — Public Records
- 2014-04-21 Sold (MLS) — Unlock MLS
- 2014-03-29 Pending — Unlock MLS
- 2013-12-12 Price Changed $59,900 Unlock MLS
- 2013-10-10 Price Changed $49,900 Unlock MLS
- 2013-04-02 Listed $59,900 Unlock MLS
- 2012-09-04 Delisted — Unlock MLS
- 2012-05-27 Price Changed — Unlock MLS
- 2011-02-08 Price Changed — Unlock MLS
- 2010-07-03 Listed — Unlock MLS
- 2008-07-18 Delisted — Unlock MLS
- 2008-03-14 Delisted — Unlock MLS
- 2008-01-18 Listed — Unlock MLS
- 2007-09-14 Listed — Unlock MLS
- 2007-09-08 Delisted — Unlock MLS
- 2007-03-08 Listed — Unlock MLS
- 2006-10-10 Delisted — Unlock MLS
- 2006-04-12 Listed — Unlock MLS
- 2005-11-03 Delisted — Unlock MLS
- 2005-05-03 Listed — Unlock MLS
- 2005-04-05 Delisted — Unlock MLS
- 2004-10-05 Listed — Unlock MLS
- 2004-09-30 Delisted — Unlock MLS
- 2004-02-19 Listed — Unlock MLS
- 2004-02-18 Delisted — Unlock MLS
- 2003-08-05 Listed — Unlock MLS
- 2003-05-08 Delisted — Unlock MLS
- 2002-11-08 Listed — Unlock MLS
- 2002-08-13 Sold (MLS) — Unlock MLS
- 2002-07-23 Delisted — Unlock MLS
- 2002-02-06 Listed $49,000 Unlock MLS
Property tax history
+7.9%/yrLatest (2025): $1,907 · +7.4% YoY. Source: county tax records.
Cash-flow waterfall
monthlySold comps — $/sqft
last 12 mo · ≤1 miLoading sold comps…