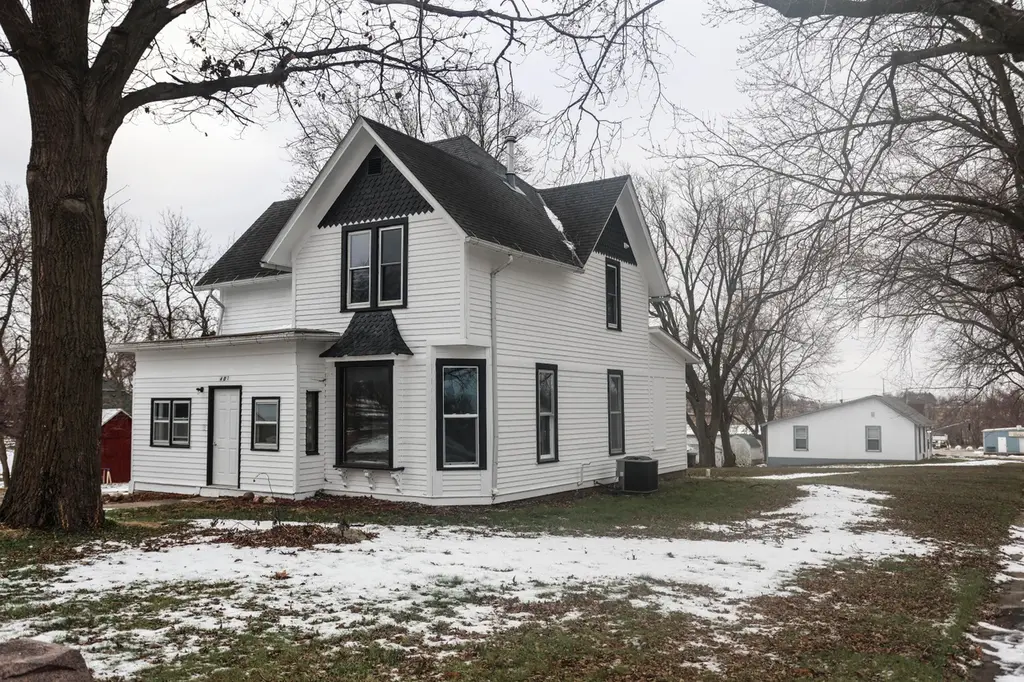
401 Highland St · Walnut, IA
Flood risk 1/10 · Minimal
- FEMA flood zone
- X (unshaded)
- Chance of flooding over 30 yrs
- 0.0%
- Est. flood insurance / yr
- $507 – $1,088
Fire risk 1/10 · Minimal
- Est. fire insurance / yr
- $902 – $1,676
Heat risk 3/10 · Minor
- Hot days now (above 103°F)
- 7 days/yr
- Hot days in 30 yrs
- 15 days/yr
Wind risk 2/10 · Minimal
- Chance of severe wind over 30 yrs
- —
Air-quality risk 2/10 · Minimal
- Unhealthy air days now
- 0 days/yr
- Unhealthy air days in 30 yrs
- 1 days/yr
Risk factors via First Street. Map © Google.
Why this score? — see what drove the C+ grade
The composite is a weighted blend of 9 inputs, each scored 0–100. Each bar is that input's sub-score; the figure is the points it added to the 100-point composite (weight × sub-score).
- Cash flow +16.7/30.0
- ARV discount +15.0/15.0
- Appreciation +8.4/10.0
- Schools +6.3/10.0
- DSCR +5.2/10.0
- 1% rule +3.4/10.0
- Livability +3.2/5.0
- Rent growth +2.5/5.0
- Condition / age +2.5/5.0
$114,500
🖨 Deal sheet 📄 Offer letter ✓ Due diligence
Listing remarks
This charming two-story home features original woodwork, hardwood floors, and generously sized bedrooms, offering timeless character throughout. Situated on a shaded double lot totaling more than half an acre, the property offers a large yard for kids or pets to enjoy, all while situated in the heart of Iowa's antique city. An affordable opportunity for buyers looking to add sweat equity and personalize a home to their taste. Major mechanical updates include a new furnace, air conditioner, and water heater have all replaced within the last two years.
Key facts
- Shaded double lot
- New furnace
- Large yard
Tags
Property features AI
Exterior
- Parking: 1-car garage
- Utilities: Natural gas available; Electricity available; Public sewer
- Home design: Single-family residence; 2-story
- Construction: Frame construction; Composition roof
- Exterior features: Corner lot; Asphalt road frontage; Sidewalks; Storage structure
Interior
- Bedrooms: Bedroom(s) on main level
- Flooring: Wood
- Heating & cooling: Natural gas heating with forced air; Electric central air conditioning
- Interior features: Wood flooring; Partial unfinished basement
- Laundry & utility: Washer hookup; Electric dryer hookup; Laundry on main level
Neighborhood map
What this means for you Summary
Snapshot
- This is a 3-bed/1.0-bath single-family listed at $114k.
Deal economics
- At list price, monthly cash flow is $72 ($865/yr) — positive.
- The deal already cash-flows at list — no discount required.
- To meet the 1% rule (rent ≥ 1% of price), the offer needs to be $96k (16.1% below list).
- Recommended offer: $96k (16.1% below list) — sets the bar for 1% rule.
Location & tenants
- Location reads 64/100 on livability (#642 in IA) — a middle-class / working-renter tenant base. Strengths: cost of living A+, housing A+; Watch: employment C-, schools F, amenities F.
- Ahstw Community School District (rural): math 75% / reading 74% proficiency, ranked #76 of 289 in IA (top 26%) — strong family-tenant draw, lease renewals of 3-5y typical.
- Market conditions: 8 active listings in the ZIP; 679 units permitted in Pottawattamie County in 2024 (566 in 5+ unit buildings).
Forward outlook
- In year one you build about $9k of equity ($792 loan paydown + $8k appreciation (6.8% local appreciation)).
- Pottawattamie County population projected to shrink 7% by 2050 — rents likely to lag national; underwrite the cash flow, not the appreciation.
- At projected returns (6.8% appreciation + 3.0% rent growth), your $32k cash investment doubles in ~4 years — after that, you're playing with house money.
- By year 5, paydown + projected appreciation supports a ~$38k cash-out refi (75% LTV) — recoverable capital for the next deal without selling this one.
Negotiation context
- It's been on market 29 days — a 2% lower offer ($113k) is reasonable based on typical stale-listing flexibility.
- 3 sale attempts with the ask held roughly flat each time — persistent listings suggest the price (not the market) is what's stuck; bring a comps-based counter.
Risks & watch-outs
- Watch-outs: built in 1900 — expect roof / HVAC / electrical / plumbing capex.
Questions for the listing agent
- Built in 1900 — when were the roof, HVAC, electrical panel, plumbing, and water heater last replaced?
- Is there a deadline driving the sale (1031 exchange, divorce, estate, relocation)? That informs how much negotiation room exists.
- Schools are F-rated, which usually means shorter tenancies and higher turnover. Who's the typical renter profile here, and what's been the actual vacancy rate?
- What's the average days-on-market for RENTAL listings here right now (not sales)? A rising rental-DOM trend means longer vacancies and softer asking-rent achievability than the comps imply.
- What's the recent tenant-quality profile in this submarket — average credit score on applications, eviction rate, late-payment / NSF rate, and stable-employment percentage? A property-management company in the area should have these aggregated.
- How much new for-sale + rental construction is in the pipeline within 1–3 miles? Heavy new supply typically softens prices + rents 12–24 months out; constrained supply supports both.
Investment metrics
- 1% rule
- 0.84% ✗
- Cap rate
- 7.05%
- Cash-on-cash
- 2.70%
- DSCR
- 1.12
- GRM
- 9.9
CMA / ARV
- ARV (median comp)
- $151,089
- List price
- $114,500
- Delta
- -24.22%
- Verdict
- UNDERPRICED
- Comps
- 9 within 1.0 mi
Projected returns pro-forma
6.82% appreciation · 3.0% rent growth · sell at horizon
- IRR
- 19.4%
- Equity multiple
- 2.35×
- Total profit
- $43,220
- Equity at exit
- $77,957
- IRR
- 18.5%
- Equity multiple
- 4.81×
- Total profit
- $122,235
- Equity at exit
- $146,842
Cash invested: $32,060 (down + closing). Projections, not guarantees.
Landlord ↔ Tenant lean methodology
- Overall (STATE)
- 83 Strongly Landlord-Friendly
- State Iowa
- 83 Strongly Landlord-Friendly · R+6
- County
- — inherits STATE
- City
- — inherits STATE
ZIP-level market 51577
- Home prices YoY
- 2.7%
- Active inventory
- 8
- Price-to-rent
- 9.9×
Monthly cashflow live
- Estimated rent
- $960 medium interval (Pro) →
- Mortgage (P&I)
- −$600
- Tax from tax record
- −$38 /mo · $462/yr
- Insurance
- −$48
- HOA
- −$0
- Vacancy / Maint / Mgmt
- −$202
- Net cashflow
- $72
Break-even live
UW: 25.0% down · 7.5% · 30yr · 1.5% tax · 5.0% vac · 8.0% maint · 8.0% mgmt
Financing live
Cash to close
- Down payment
- $28,625
- Closing costs
- $3,435
- Reserves months
- —
- Total cash needed
- —
Loan-product check · same deal, 3 products live
Conventional
25% down · 7.5% · 30yr
- Down + closing
- —
- Monthly P&I
- —
- Monthly cashflow
- —
- DSCR
- —
- Eligible?
- —
Personal DTI + credit; lowest rate.
DSCR
20% down · 8.5% · 30yr
- Down + closing
- —
- Monthly P&I
- —
- Monthly cashflow
- —
- DSCR
- —
- Eligible?
- —
No personal income docs; deal must DSCR.
Hard money
10% down · 12.0% · 12mo
- Down + closing
- —
- Monthly P&I
- —
- Monthly cashflow
- —
- DSCR
- —
- Eligible?
- —
Short-term bridge; refi at stabilization.
Listing history 7 events
-
2026-04-28$114,500 Active 556-char remark
-
2026-04-16historical Active Under Contract
-
2026-03-16$124,500 Active
-
2026-03-02price $124,900
-
2026-02-06price $126,500
-
2026-01-08price $129,900
-
2025-12-12$139,900 Active
ⓘ Source: listings_history table (triggers on properties + properties_extension) + one-shot
backfill from property_details.listing_events for pre-trigger history.
Tax reassessment forecast IA · Partial reset (capped growth)
- Current annual tax
- $462 · $38/mo
- Projected year-2 tax
- $1,130 · $94/mo
- Expected delta
- +$668/yr (+$56/mo · 144.6%)
ⓘ Screening estimate from a state-policy table — verify with the county assessor before closing.
Climate risk First Street
- Flood 1/10 Low FEMA zone X (unshaded) · 0% chance over 30 yrs
- Wildfire 1/10 Low
- Heat 3/10 Moderate 7 d/yr ≥103°F today · 15 d/yr by 30 yrs out
- Wind 2/10 Low
- Air quality 2/10 Low 0 unhealthy d/yr today · 1 by 30 yrs out
Nearby sold comps map
Loading sold comps map…
Walkable amenities ~0.75 mi
Loading nearby amenities…
Taxation est. · year 1
- Rental income
- $11,526
- − Mortgage interest
- −$6,414
- − Property taxes
- −$462
- − Insurance
- −$572
- − Repairs & maintenance
- −$922
- − Management
- −$922
- − Depreciation
- −$3,331
- Taxable loss
- −$1,098
- Est. tax savings @ 24.0%
- +$263
- After-tax cash flow
- $1,129/yr
For passive investors: Depreciation is non-cash, so a rental often shows a tax loss while cash-flowing — sheltering income. Rental losses are passive: they offset passive income freely, and up to $25,000/yr can offset ordinary (W-2) income if you actively participate and your MAGI is under $100k (phasing out to $0 by $150k); unused losses carry forward. On sale, claimed depreciation is recaptured at up to 25%, and gains may owe capital-gains tax (a 1031 exchange can defer both). Figures are a year-1 estimate at your 24.0% rate — not tax advice; consult a CPA.
Schools (NCES district)
- District
- Ahstw Community School District
- NCES district ID
- 1904080
- Math proficiency
- 75% ▼ -6.00%
- Reading proficiency
- 74% ▲ 1.00%
- Median HH income
- $52,045
- Composite
- 63.31/100
- National rank
- #628
- State rank
- #76 of 289 in IA
Livability — Walnut
- Score
- 64/100
- State rank
- #642
- US rank
- #14828
Category grades
Schools grade is shown separately in the Schools card above.
Census & demographics
- Census place
- Walnut, IA
- Population (ZIP)
- 1,637
Population outlook (Pottawattamie County) Hauer SSP2
- Today (2025)
- 93,683 people
- By 2030
- 92,772 · -1.0%
- By 2040
- 89,917 · -4.0%
- By 2050
- 86,994 · -7.1%
- By 2075
- 82,756 · -11.7%
- By 2100
- 79,097 · -15.6%
Race, ethnicity, and origin ACS 2023
- Neighborhood character
- Predominantly White (96%)
- Race & ethnicity
- White 96% Hispanic / Latino 3% Two or more races 3%
- Common ancestry
- Iranian 1% Portuguese 1%
- Foreign-born
- 1% · Canada
- Languages at home
- 99% English-only · Spanish 1%
Political lean MEDSL · Pottawattamie
- 2024 margin
- R (+20.0) · D 39.3% · R 59.3% · Other 1.4%
- 2008→2024 swing
- -18.1pp toward R · 2008: -1.9pp · 2024: -20.0pp
- All cycles
- 2024: R+20.0 2020: R+16.8 2016: R+21.6 2012: R+5.8 2008: R+1.9
Not yet ingested
- Civics
- —
Market trends
- HPI YoY
- ▲ 6.82%
- Current HPI
- 257.611
- Rent YoY
- —
- Metro
- —
- State GDP YoY
- ▲ 2.48%
- F500 in state
- 4
Industry mix (Fortune 500 HQ in IA)
| Industry | F500 HQs | Revenue |
|---|---|---|
| Financial Services | 1 | $16B |
|
||
| Retail / Convenience | 1 | $15B |
|
||
Price history
-18.2% since first listed7 events — show timeline
- 2026-04-28 Listed $114,500 SWIAR
- 2026-04-16 Contingent — SWIAR
- 2026-03-16 Listed $124,500 SWIAR
- 2026-03-02 Price Changed $124,900 SWIAR
- 2026-02-06 Price Changed $126,500 SWIAR
- 2026-01-08 Price Changed $129,900 SWIAR
- 2025-12-12 Listed $139,900 SWIAR
Property tax history
-2.4%/yrLatest (2025): $462 · +6.0% YoY. Source: county tax records.
Cash-flow waterfall
monthlySold comps — $/sqft
last 12 mo · ≤1 miLoading sold comps…