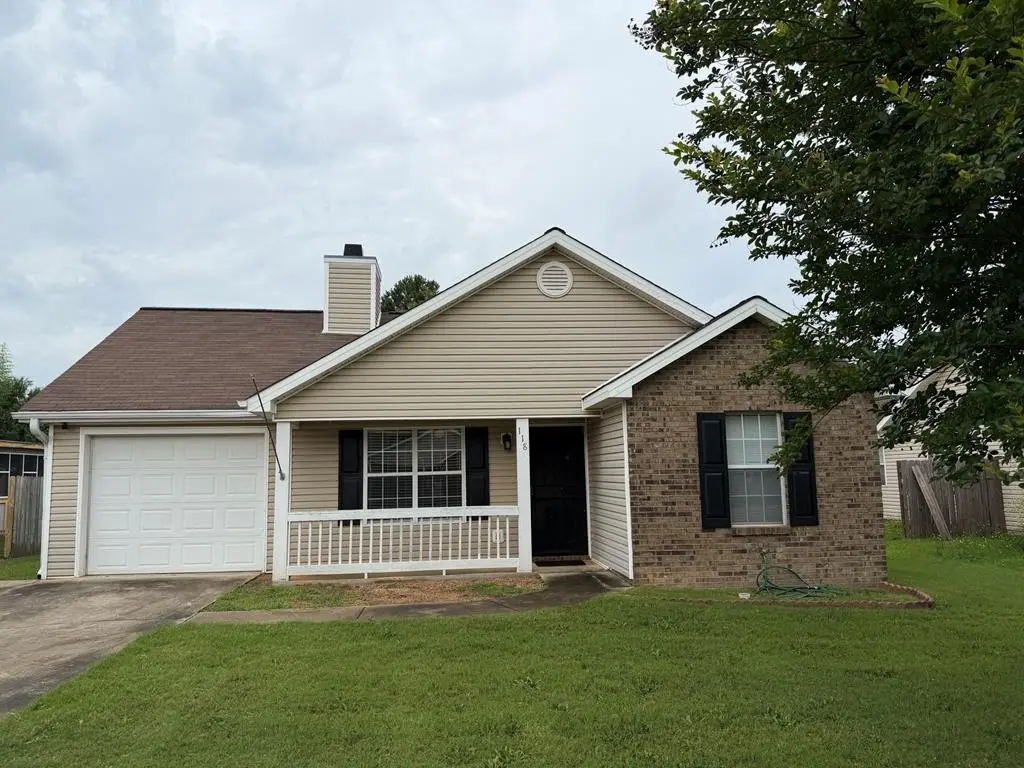
118 Georgetown Blvd · Warner Robins, GA
Flood risk 1/10 · Minimal
- FEMA flood zone
- X (unshaded)
- Chance of flooding over 30 yrs
- 0.0%
- Est. flood insurance / yr
- $507 – $1,088
Fire risk 4/10 · Minor
- Est. fire insurance / yr
- $963 – $1,789
Heat risk 7/10 · Major
- Hot days now (above 108°F)
- 7 days/yr
- Hot days in 30 yrs
- 18 days/yr
Wind risk 6/10 · Moderate
- Chance of severe wind over 30 yrs
- 75.0%
Air-quality risk 3/10 · Minor
- Unhealthy air days now
- 2 days/yr
- Unhealthy air days in 30 yrs
- 3 days/yr
Risk factors via First Street. Map © Google.
Why this score? — see what drove the D grade
The composite is a weighted blend of 9 inputs, each scored 0–100. Each bar is that input's sub-score; the figure is the points it added to the 100-point composite (weight × sub-score).
- Cash flow +12.7/30.0
- ARV discount +12.6/15.0
- Schools +3.9/10.0
- DSCR +3.8/10.0
- Livability +3.2/5.0
- Rent growth +2.9/5.0
- 1% rule +2.8/10.0
- Condition / age +2.5/5.0
- Appreciation +0.0/10.0
$185,500
🖨 Deal sheet 📄 Offer letter ✓ Due diligence
Listing remarks MLS
Beautiful, well-kept home in the heart of Warner Robins! 3 bedroom, 2 bathroom. Family room with fireplace, tray ceiling, solid surface hardwood floor, split bedroom plan. HUGE deck in private backyard with a lot of space for gatherings. Close to school and shopping.
Key facts
- Fenced backyard
- Wooden deck
- 0.26 acre lot
Tags
Property features AI
Finance
- HOA & community: Community features: Other
Exterior
- Parking: 1 total parking space; 1 covered space; Garage (concrete); Open parking
- Utilities: Public water; Sewer connected; Water connected
- Home design: Single family residence; One story
- Construction: Vinyl siding; Shingle roof; Slab foundation; Built area: 1,210
- Exterior features: Covered porch; Wood fencing / fenced yard; Patio/porch (covered)
Interior
- Kitchen: Cooktop; Electric range; Dishwasher; Refrigerator
- Bedrooms: No bedroom count provided
- Flooring: Carpet; Hardwood
- Bathrooms: 2 full bathrooms
- Heating & cooling: Central heating; Central air conditioning
- Interior features: Walk-in closet(s); Fireplace in bedroom
- Laundry & utility: Laundry room; Washer; Washer/Dryer (included)
Neighborhood map
What this means for you Summary
Snapshot
- This is a 3-bed/2.0-bath single-family listed at $186k.
Deal economics
- At list price, monthly cash flow is $-20 ($-240/yr) — negative.
- To cash-flow at today's rent, offer at most $182k (1.9% below list).
- To meet the 1% rule (rent ≥ 1% of price), the offer needs to be $145k (22.1% below list).
- Recommended offer: $145k (22.1% below list) — sets the bar for 1% rule.
- Cap rate 6.2% vs local median 4.9% in Warner Robins — meaningfully above typical; check what's discounted (condition, days-on-market, listing class) to confirm the premium yield is real.
Location & tenants
- Location reads 65/100 on livability (#227 in GA) — a middle-class / working-renter tenant base. Strengths: cost of living A+, housing A+, health & safety A+; Watch: schools D+, employment D+, crime F.
- Houston County (urban): math 43% / reading 46% proficiency, ranked #23 of 174 in GA (top 13%) — families likely to look elsewhere, expect single-tenant / working-renter base with shorter leases.
- Market conditions: Rents rising (+1.7%/yr); 286 active listings in the ZIP; 24 comparable units currently listed for rent nearby; rentals at typical pace (median 21d on market — plan ~3-4 weeks tenant-placement turnaround); solid renter incomes; 1,545 units permitted in Houston County in 2024 (336 in 5+ unit buildings).
Forward outlook
- Local home prices are declining (-3.0%/yr); year-one equity from $1k of loan paydown is wiped out by about $6k of value loss. Plan a longer hold.
- Houston County population projected at +22% by 2050 — long-run rental-demand tailwind backs the buy-and-hold thesis.
Negotiation context
- Only 3 days on market — expect competitive offers; lowballing is unlikely to land.
- 7 sale attempts since 13y ago with the ask held roughly flat each time — persistent listings suggest the price (not the market) is what's stuck; bring a comps-based counter.
Risks & watch-outs
- Climate carrying-cost: major wind risk, 75% chance of damaging wind over 30y; extreme-heat days projected 7→18/yr by 2055 (HVAC capex compounding) — expect insurance premiums to compound above CPI over the hold.
Questions for the listing agent
- What do current leases actually rent for vs. the listed asking? Can we see a recent rent roll and the last 12 months of T-12 income?
- Is there a deadline driving the sale (1031 exchange, divorce, estate, relocation)? That informs how much negotiation room exists.
- Schools are D-rated, which usually means shorter tenancies and higher turnover. Who's the typical renter profile here, and what's been the actual vacancy rate?
- Crime grade is F in this area — have there been break-ins, vandalism, or insurance claims at this property in the last 3 years? What carrier currently insures it and at what premium?
- The area grade is low — what's the realistic commute time and amenity access for the typical tenant pool here? Any planned neighborhood developments (good or bad) we should know about?
- What's the average days-on-market for RENTAL listings here right now (not sales)? A rising rental-DOM trend means longer vacancies and softer asking-rent achievability than the comps imply.
- What's the recent tenant-quality profile in this submarket — average credit score on applications, eviction rate, late-payment / NSF rate, and stable-employment percentage? A property-management company in the area should have these aggregated.
- How much new for-sale + rental construction is in the pipeline within 1–3 miles? Heavy new supply typically softens prices + rents 12–24 months out; constrained supply supports both.
Investment metrics
- 1% rule
- 0.78% ✗
- Cap rate
- 6.16%
- Cash-on-cash
- -0.46%
- DSCR
- 0.98
- GRM
- 10.7
CMA / ARV
- ARV (on-the-fly)
- $209,330
- Comps found
- 12
Show comp detail 12 sales within ~0.75 mi
| Address | Dist | Beds/Ba | Sqft | Sold | Price | $/sf | Match |
|---|---|---|---|---|---|---|---|
| 125 Georgetown Blvd | 0.05mi | 3/2.0 | 1,335 (+10%) | 15mo | $185,000 | $139 | 68 |
| 118 Knights Brg | 0.50mi | 3/2.0 | 1,285 (+6%) | 11mo | $235,000 | $183 | 57 |
| 122 Knights Brg | 0.50mi | 3/2.0 | 1,342 (+11%) | 4mo | $233,000 | $174 | 55 |
| 101 Albert Ct | 0.73mi | 3/2.0 | 1,179 (-3%) | 14mo | $185,000 | $157 | 50 |
| 307 Antler Trl | 0.67mi | 2/2.0 (-1) | 1,101 (-9%) | 0mo | $200,000 | $182 | 48 |
| 402 Spike Trl | 0.67mi | 2/2.0 (-1) | 1,266 (+5%) | 11mo | $230,000 | $182 | 47 |
| 105 Park Ln | 0.73mi | 3/2.0 | 1,350 (+12%) | 3mo | $204,000 | $151 | 44 |
| 113 Park Ln | 0.66mi | 3/2.0 | 1,364 (+13%) | 5mo | $215,000 | $158 | 44 |
| 104 Park Ln | 0.70mi | 3/2.0 | 1,298 (+7%) | 19mo | $208,000 | $160 | 40 |
| 208 Antler Trl | 0.69mi | 2/2.0 (-1) | 1,386 (+14%) | 0mo | $230,000 | $166 | 38 |
| 401 Spike Trl | 0.68mi | 2/2.0 (-1) | 1,386 (+14%) | 8mo | $240,000 | $173 | 32 |
| 305 Spike Trl | 0.75mi | 2/2.0 (-1) | 1,101 (-9%) | 16mo | $195,000 | $177 | 31 |
Match score weights: distance 35% · size 25% · config 20% · recency 20%. Top-matched comps best support the ARV.
Projected returns pro-forma
-3.0% appreciation · 1.67% rent growth · sell at horizon
- IRR
- -18.5%
- Equity multiple
- 0.36×
- Total profit
- $-33,296
- Equity at exit
- $27,659
- IRR
- -13.5%
- Equity multiple
- 0.26×
- Total profit
- $-38,473
- Equity at exit
- $16,039
Cash invested: $51,940 (down + closing). Projections, not guarantees.
Landlord ↔ Tenant lean methodology
- Overall (STATE)
- 90 Strongly Landlord-Friendly
- State Georgia
- 90 Strongly Landlord-Friendly · R+3
- County
- — inherits STATE
- City
- — inherits STATE
ZIP-level market 31088
- Rents YoY
- 1.7%
- Active inventory
- 286
- Price-to-rent
- 10.7×
Monthly cashflow live
- Estimated rent
- $1,445 high interval (Pro) →
- Mortgage (P&I)
- −$973
- Tax from tax record
- −$112 /mo · $1,339/yr
- Insurance
- −$77
- HOA
- −$0
- Vacancy / Maint / Mgmt
- −$303
- Net cashflow
- $-20
Break-even live
UW: 25.0% down · 7.5% · 30yr · 1.5% tax · 5.0% vac · 8.0% maint · 8.0% mgmt
Financing live
Cash to close
- Down payment
- $46,375
- Closing costs
- $5,565
- Reserves months
- —
- Total cash needed
- —
Loan-product check · same deal, 3 products live
Conventional
25% down · 7.5% · 30yr
- Down + closing
- —
- Monthly P&I
- —
- Monthly cashflow
- —
- DSCR
- —
- Eligible?
- —
Personal DTI + credit; lowest rate.
DSCR
20% down · 8.5% · 30yr
- Down + closing
- —
- Monthly P&I
- —
- Monthly cashflow
- —
- DSCR
- —
- Eligible?
- —
No personal income docs; deal must DSCR.
Hard money
10% down · 12.0% · 12mo
- Down + closing
- —
- Monthly P&I
- —
- Monthly cashflow
- —
- DSCR
- —
- Eligible?
- —
Short-term bridge; refi at stabilization.
Rent comps 24 comps
| Address | Beds | Baths | Sqft | Rent | $/sqft | DOM | Units | Dist |
|---|---|---|---|---|---|---|---|---|
| 242 Katelyn Cir Warner Robins, GA | 2.0 | 2.0 | 962 | $1,250 | $1.30 | 43d | 1 | 0.08mi |
| 242 Katelyn Cir Warner Robins, GA | 2.0 | 2.0 | 962 | $1,250 | $1.30 | 20d | 1 | 0.08mi |
| 256 Katelyn Cir Warner Robins, GA | 2.0 | 2.0 | 962 | $1,200 | $1.25 | 20d | 1 | 0.08mi |
| 256 Katelyn Cir Warner Robins, GA | 2.0 | 2.0 | 962 | $1,200 | $1.25 | 43d | 1 | 0.08mi |
| 224 Katelyn Cir Warner Robins, GA | 2.0 | 2.0 | 962 | $1,200 | $1.25 | 13d | 1 | 0.10mi |
| 115 Tom Chapman Blvd Warner Robins, GA | 1.0–3.0 | 1.0–2.0 | 1066 | $1,632 | $1.53 | 13d | 10 | 0.48mi |
| 206 Antler Trl Warner Robins, GA | 2.0 | 2.0 | 1089 | $1,550 | $1.42 | 43d | 1 | 0.69mi |
| 321 Deerfield Cir Warner Robins, GA | 2.0 | 2.0 | 1326 | $1,650 | $1.24 | 13d | 1 | 0.77mi |
| 114 Tahoe Ln Warner Robins, GA | 3.0 | 2.0 | 1349 | $1,800 | $1.33 | 43d | 1 | 0.81mi |
| 107 White Tail Ln Warner Robins, GA | 2.0 | 2.0 | 1065 | $1,650 | $1.55 | 43d | 1 | 0.90mi |
| 800 Gunn Rd Centerville, GA | 1.0–3.0 | 1.0–2.0 | 1100 | $1,715 | $1.56 | 13d | 2 | 0.91mi |
| 1601 Leverette Rd Warner Robins, GA | 2.0 | 2.0 | 1170 | $1,474 | $1.26 | 13d | 15 | 0.92mi |
| 3415 US Highway 41 N Byron, GA | 2.0 | 2.0 | 1170 | $1,490 | $1.27 | 13d | 15 | 1.03mi |
| 1485 Leverette Rd Warner Robins, GA | 1.0–3.0 | 1.0–2.0 | 1144 | $1,804 | $1.58 | 13d | 13 | 1.06mi |
| 105 Arnold St Centerville, GA | 2.0 | 1.5 | 1122 | $1,295 | $1.15 | 13d | 1 | 1.07mi |
| 108 Renoir Ln Warner Robins, GA | 3.0 | 2.0 | 1306 | $1,300 | $1.00 | 20d | 1 | 1.10mi |
| 108 Renoir Ln Warner Robins, GA | 3.0 | 2.0 | 1306 | $1,300 | $1.00 | 43d | 1 | 1.10mi |
| 214 Ridgewood Dr Centerville, GA | 2.0 | 2.0 | 980 | $1,050 | $1.07 | 20d | 1 | 1.14mi |
| 415 Covington Cv Byron, GA | 4.0 | 2.0 | 1472 | $1,820 | $1.24 | 13d | 1 | 1.26mi |
| 108 Pershing Place Ct Warner Robins, GA | 2.0 | 2.0 | 1120 | $1,300 | $1.16 | 43d | 1 | 1.26mi |
| 100 Robins West Pkwy Warner Robins, GA | 1.0–2.0 | 1.0–2.0 | 982 | $1,347 | $1.37 | 13d | 7 | 1.31mi |
| 431 Sentry Oak Dr Centerville, GA | 3.0 | 2.0 | 1312 | $1,695 | $1.29 | 43d | 1 | 1.32mi |
| 420 Madison Place Pkwy Byron, GA | 3.0 | 2.0 | 1341 | $2,000 | $1.49 | 13d | 1 | 1.41mi |
| 100 Place Dr Byron, GA | 1.0–3.0 | 1.0–2.0 | 1099 | $1,925 | $1.75 | 13d | 41 | 1.44mi |
Listing history 10 events
-
2026-06-18status $185,500 Under Contract 3 DOM
-
2026-06-18days on market $185,500 New 3 DOM
-
2026-06-17days on market $185,500 New 2 DOM
-
2026-06-15remarks 699-char remark
-
2026-06-15statusdays on market $185,500 New 1 DOM
-
2026-06-15days on market $185,500 Active 6 DOM
-
2026-06-14days on market $185,500 Active 4 DOM
-
2026-06-13days on market $185,500 Active 3 DOM
-
2026-06-10remarks 695-char remark
-
2026-06-10$185,500 Active 1 DOM
ⓘ Source: listings_history table (triggers on properties + properties_extension) + one-shot
backfill from property_details.listing_events for pre-trigger history.
Tax reassessment forecast GA · Resets to sale price
- Current annual tax
- $1,339 · $112/mo
- Projected year-2 tax
- $1,707 · $142/mo
- Expected delta
- +$367/yr (+$31/mo · 27.4%)
ⓘ Screening estimate from a state-policy table — verify with the county assessor before closing.
Climate risk First Street
- Flood 1/10 Low FEMA zone X (unshaded) · 0% chance over 30 yrs
- Wildfire 4/10 Moderate
- Heat 7/10 Severe 7 d/yr ≥108°F today · 18 d/yr by 30 yrs out
- Wind 6/10 Major 75% chance of damaging wind over 30 yrs
- Air quality 3/10 Moderate 2 unhealthy d/yr today · 3 by 30 yrs out
Nearby sold comps map
Loading sold comps map…
Walkable amenities ~0.75 mi
Loading nearby amenities…
Taxation est. · year 1
- Rental income
- $17,341
- − Mortgage interest
- −$10,391
- − Property taxes
- −$1,339
- − Insurance
- −$928
- − Repairs & maintenance
- −$1,387
- − Management
- −$1,387
- − Depreciation
- −$5,396
- Taxable loss
- −$3,487
- Est. tax savings @ 24.0%
- +$837
- After-tax cash flow
- $597/yr
For passive investors: Depreciation is non-cash, so a rental often shows a tax loss while cash-flowing — sheltering income. Rental losses are passive: they offset passive income freely, and up to $25,000/yr can offset ordinary (W-2) income if you actively participate and your MAGI is under $100k (phasing out to $0 by $150k); unused losses carry forward. On sale, claimed depreciation is recaptured at up to 25%, and gains may owe capital-gains tax (a 1031 exchange can defer both). Figures are a year-1 estimate at your 24.0% rate — not tax advice; consult a CPA.
Schools (NCES district)
- District
- Houston County
- NCES district ID
- 1302880
- Math proficiency
- 43% ▼ -7.00%
- Reading proficiency
- 46% ▼ -2.00%
- Median HH income
- $54,823
- Composite
- 38.68/100
- National rank
- #4144
- State rank
- #23 of 174 in GA
Livability — Warner Robins
- Score
- 65/100
- State rank
- #227
- US rank
- #13290
Category grades
Schools grade is shown separately in the Schools card above.
Census & demographics
- Census place
- Warner Robins, GA
- County
- Houston County · 157,321 people
- City population
- 92,102
- Metro
- Warner Robins, GA
- Population (ZIP)
- 58,585
- Household income
- $83,082
- Rent vs Own
- Severe rent burden
- 1668.0
Population outlook (Houston County) Hauer SSP2
- Today (2025)
- 169,502 people
- By 2030
- 178,486 · +5.3%
- By 2040
- 194,642 · +14.8%
- By 2050
- 207,119 · +22.2%
- By 2075
- 231,480 · +36.6%
- By 2100
- 235,034 · +38.7%
Race, ethnicity, and origin ACS 2023
- Neighborhood character
- Diverse neighborhood (Simpson 0.63)
- Race & ethnicity
- White 51% Black 32% Two or more races 9% Hispanic / Latino 7% Asian 4%
- Hispanic origin (detail)
- Mexican 4%
- Common ancestry
- Romanian 2% Slovak 2% Lithuanian 2%
- Foreign-born
- 9% · Canada, Vietnam, Jamaica
- Languages at home
- 90% English-only · Spanish 5% Other Asian/Pacific 2% Vietnamese 2%
Political lean MEDSL · Houston
- 2024 margin
- R (+11.3) · D 44.0% · R 55.3%
- 2008→2024 swing
- +8.9pp toward D · 2008: -20.2pp · 2024: -11.3pp
- All cycles
- 2024: R+11.3 2020: R+12.4 2016: R+21.6 2012: R+20.7 2008: R+20.2
Not yet ingested
- Civics
- —
Market trends
- HPI YoY
- ▼ -135.75%
- Current HPI
- 219.8261
- Rent YoY
- ▲ 1.67%
- Metro
- Warner Robins, GA
- State GDP YoY
- ▲ 2.66%
- F500 in state
- 28
Industry mix (Fortune 500 HQ in GA)
| Industry | F500 HQs | Revenue |
|---|---|---|
| Paper / Packaging | 2 | $29B |
|
||
| Retail | 1 | $160B |
|
||
| Transportation / Logistics | 1 | $91B |
|
||
| Airlines | 1 | $62B |
|
||
| Consumer Goods | 1 | $47B |
|
||
| Utilities | 1 | $25B |
|
||
Price history
+126.5% since first listed20 events — show timeline
- 2026-06-09 Listed $185,500 MBOR
- 2022-06-06 Sold (Public Records) $180,100 Public Records
- 2022-05-31 Sold (MLS) $180,100 GAMLS
- 2022-05-31 Sold (MLS) $180,100 Hive MLS
- 2022-05-06 Pending — GAMLS
- 2022-05-02 Listed $175,000 Hive MLS
- 2022-05-02 Listed $175,000 Hive MLS
- 2022-04-29 Listed $175,000 GAMLS
- 2018-03-06 Sold (Public Records) $103,900 Public Records
- 2018-03-02 Sold (MLS) $103,900 CGMLS
- 2018-01-26 Listed $102,900 CGMLS
- 2013-08-22 Sold (MLS) $73,000 CGMLS
- 2013-08-22 Sold (MLS) $73,000 GAMLS
- 2013-04-23 Listed $74,900 CGMLS
- 2013-04-23 Listed $74,900 GAMLS
- 2013-02-19 Sold (Public Records) $64,800 Public Records
- 2008-12-30 Sold (Public Records) $93,500 Public Records
- 2003-10-01 Sold (Public Records) $92,000 Public Records
- 2003-09-03 Sold (Public Records) $88,426 Public Records
- 1999-12-06 Sold (Public Records) $81,900 Public Records
Property tax history
+6.3%/yrLatest (2025): $1,339 · +12.6% YoY. Source: county tax records.
Cash-flow waterfall
monthlySold comps — $/sqft
last 12 mo · ≤1 miLoading sold comps…