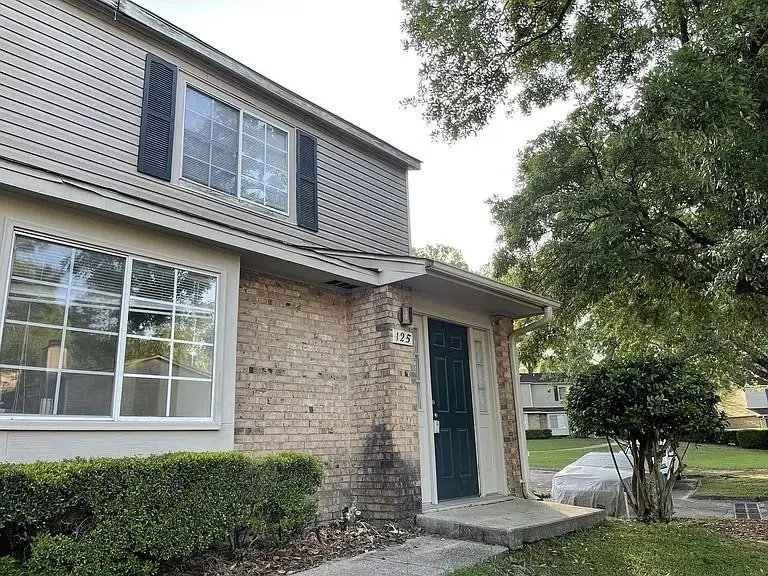
6701 Dickens Ferry Rd #125 · Mobile, AL
Flood risk 1/10 · Minimal
- FEMA flood zone
- X (unshaded)
- Chance of flooding over 30 yrs
- 0.0%
- Est. flood insurance / yr
- $507 – $1,088
Fire risk 3/10 · Minor
- Est. fire insurance / yr
- $916 – $1,700
Heat risk 9/10 · Severe
- Hot days now (above 104°F)
- 7 days/yr
- Hot days in 30 yrs
- 21 days/yr
Wind risk 9/10 · Severe
- Chance of severe wind over 30 yrs
- 99.0%
Air-quality risk 1/10 · Minimal
- Unhealthy air days now
- 0 days/yr
- Unhealthy air days in 30 yrs
- 0 days/yr
Risk factors via First Street. Map © Google.
Why this score? — see what drove the F grade
The composite is a weighted blend of 9 inputs, each scored 0–100. Each bar is that input's sub-score; the figure is the points it added to the 100-point composite (weight × sub-score).
- Cash flow +7.6/30.0
- 1% rule +5.2/10.0
- Rent growth +4.0/5.0
- Livability +3.8/5.0
- ARV discount +3.7/15.0
- Condition / age +2.5/5.0
- Schools +2.3/10.0
- DSCR +1.7/10.0
- Appreciation +0.0/10.0
$125,000
🖨 Deal sheet (PDF) 📄 Offer letter ✓ Due diligence
Listing remarks MLS
This beautifully renovated, move-in ready 2-bedroom, 2-bath downstairs unit offers comfortable, low-maintenance living in a fantastic location. Fresh paint throughout and ceramic tile in the kitchen and bathrooms create a modern and stylish look. The open living space features a spacious living room and informal dining area that flows seamlessly into the kitchen. A cozy fireplace and access to the porch make the great room perfect for relaxing or entertaining. Natural light fills the home, highlighting the thoughtful updates throughout. Enjoy a prime location with easy access to the University of South Alabama area, as well as nearby dining, shopping, and everyday amenities. Freshly painted and thoughtfully updated, this home is ready for its next owner. Don’t miss this opportunity—schedule a showing today!
Key facts
- Ceramic tile kitchen
- Open living space
- Cozy fireplace
Tags
Neighborhood map
What this means for you Summary
Snapshot
- This is a 2-bed/2.5-bath condo listed at $125k.
Deal economics
- At list price, monthly cash flow is $-151 ($-2k/yr) — negative.
- The deal already cash-flows at list — no discount required.
- Meets the 1% rule at list price ($1k rent vs $125k).
- Recommended offer: $110k (12.0% below list) — sets the bar for market timing.
Location & tenants
- Location reads 75/100 on livability (#20 in AL, #4,262 nationally) — a middle-class / working-renter tenant base. Strengths: commute A+, cost of living A+, housing A+; Watch: schools D-, crime F, employment D-.
- Mobile County (urban): math 15% / reading 39% proficiency, ranked #81 of 129 in AL (top 63%) — low school quality limits family demand, transient renter base, plan for 1-2y turnover; 67% free/reduced lunch — lower-income household profile, screen leases tightly.
- Market conditions: Rents rising fast (+6.2%/yr); 341 active listings in the ZIP; 17 comparable units currently listed for rent nearby; rentals at typical pace (median 23d on market — plan ~3-4 weeks tenant-placement turnaround); 41% of comp listings sitting > 30 days — soft ceiling on asking rent; 1,678 units permitted in Mobile County in 2024 (264 in 5+ unit buildings).
Forward outlook
- Local home prices are declining (-3.0%/yr); year-one equity from $864 of loan paydown is wiped out by about $4k of value loss. Plan a longer hold.
- Mobile County population projected to shrink 8% by 2050 — rents likely to lag national; underwrite the cash flow, not the appreciation.
Negotiation context
- It's been on market 211 days — a 12% lower offer ($110k) is reasonable based on typical stale-listing flexibility.
- Current owner paid $35k; list at $125k implies a 257% gain — meaningful room to come down on a strong offer.
Risks & watch-outs
- Watch-outs: HOA is 27% of rent.
- Climate carrying-cost: severe wind risk, 99% chance of damaging wind over 30y; extreme-heat days projected 7→21/yr by 2055 (HVAC capex compounding) — expect insurance premiums to compound above CPI over the hold.
Questions for the listing agent
- What do current leases actually rent for vs. the listed asking? Can we see a recent rent roll and the last 12 months of T-12 income?
- It's been on market 211 days. Have you received any prior offers? Is the seller open to a 12% concession, seller financing, or rate buy-down credit?
- What does the HOA fee cover, when was the last increase, and are there any pending special assessments or reserve-fund shortfalls?
- Any open or pending special assessments — roof, HVAC, plumbing, elevator, façade? What's the per-unit balance and payoff schedule, and is the seller paying it off at close or rolling it to the buyer?
- Why hasn't it sold? Are there any deal-killer items the seller is aware of (foundation, flood, title, zoning, code violations)?
- Is there a deadline driving the sale (1031 exchange, divorce, estate, relocation)? That informs how much negotiation room exists.
- Schools are D-rated, which usually means shorter tenancies and higher turnover. Who's the typical renter profile here, and what's been the actual vacancy rate?
- Crime grade is F in this area — have there been break-ins, vandalism, or insurance claims at this property in the last 3 years? What carrier currently insures it and at what premium?
- The area grade is low — what's the realistic commute time and amenity access for the typical tenant pool here? Any planned neighborhood developments (good or bad) we should know about?
- What's the average days-on-market for RENTAL listings here right now (not sales)? A rising rental-DOM trend means longer vacancies and softer asking-rent achievability than the comps imply.
- What's the recent tenant-quality profile in this submarket — average credit score on applications, eviction rate, late-payment / NSF rate, and stable-employment percentage? A property-management company in the area should have these aggregated.
- How much new apartment / multifamily construction is in the pipeline within 1–3 miles? Heavy new supply (>2% of stock underway) typically softens rents 12–24 months out; light construction supports rent growth.
Investment metrics
- 1% rule
- 1.02% ✓
- Cap rate
- 4.84%
- Cash-on-cash
- -5.18%
- DSCR
- 0.77
- GRM
- 8.2
CMA / ARV
- ARV (median comp)
- $115,360
- List price
- $125,000
- Delta
- 8.36%
- Verdict
- FAIR
- Comps
- 20 within 1.0 mi
Show comp detail 1 sale within ~0.75 mi
| Address | Dist | Beds/Ba | Sqft | Sold | Price | $/sf | Match |
|---|---|---|---|---|---|---|---|
| 6513 Cedar Bend Ct Unit B | 0.24mi | 2/2.5 | 1,274 (-1%) | 11mo | $142,000 | $111 | 78 |
Match score weights: distance 35% · size 25% · config 20% · recency 20%. Top-matched comps best support the ARV.
Projected returns pro-forma
-3.0% appreciation · 6.15% rent growth · sell at horizon
- IRR
- -20.2%
- Equity multiple
- 0.27×
- Total profit
- $-25,529
- Equity at exit
- $18,638
- IRR
- -5.8%
- Equity multiple
- 0.55×
- Total profit
- $-15,632
- Equity at exit
- $10,808
Cash invested: $35,000 (down + closing). Projections, not guarantees.
Landlord ↔ Tenant lean methodology
- Overall (STATE)
- 90 Strongly Landlord-Friendly
- State Alabama
- 90 Strongly Landlord-Friendly · R+15
- County
- — inherits STATE
- City
- — inherits STATE
ZIP-level market 36608
- Rents YoY
- 6.2%
- Active inventory
- 341
- Price-to-rent
- 8.2×
Monthly cashflow live
- Estimated rent
- $1,271 high interval (Pro) →
- Mortgage (P&I)
- −$656
- Tax from tax record
- −$108 /mo · $1,290/yr
- Insurance
- −$52
- HOA est. from 27 same-building comps
- −$340
- Vacancy / Maint / Mgmt
- −$267
- Net cashflow
- $-151
Break-even live
Sensitivity live
| Price | -10% $-80 | -5% $-116 | +0% $-151 | +5% $-187 | +10% $-222 |
|---|---|---|---|---|---|
| Rent | -10% $-252 | -5% $-201 | +0% $-151 | +5% $-101 | +10% $-51 |
| Rate | -1.0pp $-88 | -0.5pp $-119 | base $-151 | +0.5pp $-184 | +1.0pp $-216 |
UW: 25.0% down · 7.5% · 30yr · 1.5% tax · 5.0% vac · 8.0% maint · 8.0% mgmt
Financing live
Cash to close
- Down payment
- $31,250
- Closing costs
- $3,750
- Reserves months
- —
- Total cash needed
- —
Loan-product check · same deal, 3 products live
Conventional
25% down · 7.5% · 30yr
- Down + closing
- —
- Monthly P&I
- —
- Monthly cashflow
- —
- DSCR
- —
- Eligible?
- —
Personal DTI + credit; lowest rate.
DSCR
20% down · 8.5% · 30yr
- Down + closing
- —
- Monthly P&I
- —
- Monthly cashflow
- —
- DSCR
- —
- Eligible?
- —
No personal income docs; deal must DSCR.
Hard money
10% down · 12.0% · 12mo
- Down + closing
- —
- Monthly P&I
- —
- Monthly cashflow
- —
- DSCR
- —
- Eligible?
- —
Short-term bridge; refi at stabilization.
Rent comps 17 comps
| Address | Beds | Baths | Sqft | Rent | $/sqft | DOM | Units | Dist |
|---|---|---|---|---|---|---|---|---|
| 6701 Dickens Ferry Rd #30 Mobile, AL | 3.0 | 2.5 | 1342 | $1,395 | $1.04 | 22d | 1 | 0.03mi |
| 101 Foreman Rd Mobile, AL | 1.0–3.0 | 1.0–2.0 | 835 | $1,059 | $1.27 | 45d | 9 | 0.08mi |
| 6601 Old Shell Rd Unit 3 Mobile, AL | 2.0 | 1.0 | 950 | $975 | $1.03 | 22d | 1 | 0.17mi |
| 6474B Cedar Bend Ct Mobile, AL | 2.0 | 2.0 | 1444 | $1,600 | $1.11 | 45d | 1 | 0.25mi |
| 1 Country Ln Mobile, AL | 1.0–2.0 | 1.0 | 850 | $1,221 | $1.44 | 15d | 10 | 0.31mi |
| 6427 Airport Blvd Mobile, AL | 2.0–3.0 | 2.0–2.5 | 1214 | $1,387 | $1.14 | 45d | 10 | 0.79mi |
| 6200 Airport Blvd Apt 174 Mobile, AL | 2.0 | 2.0 | 1000 | $1,050 | $1.05 | 45d | 1 | 1.02mi |
| 6200 Airport Blvd Unit 48 Mobile, AL | 2.0 | 1.0 | 1000 | $1,000 | $1.00 | 22d | 1 | 1.03mi |
| 6200 Airport Blvd Unit 56 Mobile, AL | 2.0 | 1.0 | 1000 | $900 | $0.90 | 45d | 1 | 1.04mi |
| 6016 Magnolia Pl E Mobile, AL | 3.0 | 2.0 | 1600 | $1,800 | $1.12 | 45d | 1 | 1.04mi |
| 133 East Dr Mobile, AL | 1.0–2.0 | 1.0 | 821 | $1,024 | $1.25 | 15d | 4 | 1.14mi |
| 6700 Wall St Mobile, AL | 2.0–3.0 | 1.0–2.0 | 1231 | $1,249 | $1.01 | 15d | 6 | 1.30mi |
| 668 Willow Pointe Dr Mobile, AL | 2.0 | 2.0 | 1029 | $1,750 | $1.70 | 45d | 1 | 1.30mi |
| 668 Willow Pointe Dr Mobile, AL | 2.0 | 2.0 | 1029 | $1,650 | $1.60 | 22d | 1 | 1.30mi |
| 176 2nd Ave Mobile, AL | 3.0 | 1.0 | 1056 | $895 | $0.85 | 22d | 1 | 1.31mi |
| 7601 Airport Blvd Mobile, AL | 2.0–4.0 | 2.0 | 1082 | $1,050 | $0.97 | 15d | 5 | 1.34mi |
| 6725 Zeigler Blvd Mobile, AL | 1.0–2.0 | 1.0 | 850 | $1,282 | $1.51 | 15d | 7 | 1.35mi |
HOA detail condo
- Monthly dues
- $0 · $0/yr
- Assessments
- None detected in remarks — confirm with the listing agent.
Listing history 19 events
-
2026-06-18days on market $125,000 Active 211 DOM
-
2026-06-17days on market $125,000 Active 210 DOM
-
2026-06-16days on market $125,000 Active 209 DOM
-
2026-06-15days on market $125,000 Active 208 DOM
-
2026-06-14days on market $125,000 Active 206 DOM
-
2026-06-13days on market $125,000 Active 205 DOM
-
2026-06-10days on market $125,000 Active 203 DOM
-
2026-06-09days on market $125,000 Active 202 DOM
-
2026-06-08days on market $125,000 Active 201 DOM
-
2026-06-07days on market $125,000 Active 200 DOM
-
2026-06-05days on market $125,000 Active 197 DOM
-
2026-06-03days on market $125,000 Active 196 DOM
-
2026-06-02days on market $125,000 Active 195 DOM
-
2026-06-01days on market $125,000 Active 194 DOM
-
2026-05-31days on market $125,000 Active 193 DOM
-
2026-05-30days on market $125,000 Active 192 DOM
-
2025-11-19$125,000 Active 837-char remark
Show marketing remark (837 chars)
This beautifully renovated, move-in ready 2-bedroom, 2-bath downstairs unit offers comfortable, low-maintenance living in a fantastic location. Fresh paint throughout and ceramic tile in the kitchen and bathrooms create a modern and stylish look. The open living space features a spacious living room and informal dining area that flows seamlessly into the kitchen. A cozy fireplace and access to the porch make the great room perfect for relaxing or entertaining. Natural light fills the home, highlighting the thoughtful updates throughout. Enjoy a prime location with easy access to the University of South Alabama area, as well as nearby dining, shopping, and everyday amenities. Freshly painted and thoughtfully updated, this home is ready for its next owner. Don’t miss this opportunity—schedule a showing today!
-
2021-04-21soldstatus $35,000
-
2015-06-05soldstatus $64,000
ⓘ Source: listings_history table (triggers on properties + properties_extension) + one-shot
backfill from property_details.listing_events for pre-trigger history.
Tax reassessment forecast AL · Resets to sale price
- Current annual tax
- $1,290 · $108/mo
- Projected year-2 tax
- $1,290 · $108/mo
- Expected delta
- $0/yr ($0/mo · 0.0%)
ⓘ Screening estimate from a state-policy table — verify with the county assessor before closing.
Climate risk First Street
- Flood 1/10 Low FEMA zone X (unshaded) · 0% chance over 30 yrs
- Wildfire 3/10 Moderate
- Heat 9/10 Extreme 7 d/yr ≥104°F today · 21 d/yr by 30 yrs out
- Wind 9/10 Extreme 99% chance of damaging wind over 30 yrs
- Air quality 1/10 Low 0 unhealthy d/yr today · 0 by 30 yrs out
Nearby sold comps map
Loading sold comps map…
Walkable amenities ~0.75 mi
Loading nearby amenities…
Taxation est. · year 1
- Rental income
- $15,250
- − Mortgage interest
- −$7,002
- − Property taxes
- −$1,290
- − Insurance
- −$625
- − Repairs & maintenance
- −$1,220
- − Management
- −$1,220
- − HOA
- −$4,080
- − Depreciation
- −$3,636
- Taxable loss
- −$3,823
- Est. tax savings @ 24.0%
- +$918
- After-tax cash flow
- $-896/yr
For passive investors: Depreciation is non-cash, so a rental often shows a tax loss while cash-flowing — sheltering income. Rental losses are passive: they offset passive income freely, and up to $25,000/yr can offset ordinary (W-2) income if you actively participate and your MAGI is under $100k (phasing out to $0 by $150k); unused losses carry forward. On sale, claimed depreciation is recaptured at up to 25%, and gains may owe capital-gains tax (a 1031 exchange can defer both). Figures are a year-1 estimate at your 24.0% rate — not tax advice; consult a CPA.
Schools (NCES district)
- District
- Mobile County
- NCES district ID
- 0102370
- Math proficiency
- 15% ▼ -28.00%
- Reading proficiency
- 39% ▬ 0.00%
- Median HH income
- $42,455
- Composite
- 22.9/100
- National rank
- #8002
- State rank
- #81 of 129 in AL
Livability — Mobile
- Score
- 75/100
- State rank
- #20
- US rank
- #4262
Category grades
Schools grade is shown separately in the Schools card above.
Census & demographics
- Census place
- Mobile, AL
- County
- Mobile County · 246,577 people
- City population
- 205,729
- Metro
- Mobile, AL
- Population (ZIP)
- 38,890
- Household income
- $61,146
- Rent vs Own
- Severe rent burden
- 1823.0
Population outlook (Mobile County) Hauer SSP2
- Today (2025)
- 415,303 people
- By 2030
- 411,755 · -0.9%
- By 2040
- 399,670 · -3.8%
- By 2050
- 382,616 · -7.9%
- By 2075
- 337,353 · -18.8%
- By 2100
- 283,391 · -31.8%
Race, ethnicity, and origin ACS 2023
- Neighborhood character
- Diverse neighborhood (Simpson 0.56)
- Race & ethnicity
- White 56% Black 35% Two or more races 4% Hispanic / Latino 4% Asian 2%
- Common ancestry
- Lithuanian 3% Italian 2% Slovak 2%
- Foreign-born
- 4% · Canada
- Languages at home
- 95% English-only · Spanish 2% Arabic 1% Other Indo-European 1%
Political lean MEDSL · Mobile
- 2024 margin
- R (+16.4) · D 41.3% · R 57.7%
- 2008→2024 swing
- -7.7pp toward R · 2008: -8.7pp · 2024: -16.4pp
- All cycles
- 2024: R+16.4 2020: R+11.9 2016: R+13.9 2012: R+9.3 2008: R+8.7
Not yet ingested
- Civics
- —
Market trends
- HPI YoY
- ▼ -224.52%
- Current HPI
- 198.9469
- Rent YoY
- ▲ 6.15%
- Metro
- Mobile, AL
- State GDP YoY
- ▲ 2.94%
- F500 in state
- 4
Industry mix (Fortune 500 HQ in AL)
| Industry | F500 HQs | Revenue |
|---|---|---|
| Financial Services | 1 | $8B |
|
||
| Healthcare | 1 | $5B |
|
||
Price history
+95.3% since first listed3 events — show timeline
- 2025-11-19 Listed $125,000 GCMLS AL
- 2021-04-21 Sold (Public Records) $35,000 Public Records
- 2015-06-05 Sold (Public Records) $64,000 Public Records
Property tax history
+4.3%/yrLatest (2025): $1,290 · +6.9% YoY. Source: county tax records.
Cash-flow waterfall
monthlySold comps — $/sqft
last 12 mo · ≤1 miLoading sold comps…