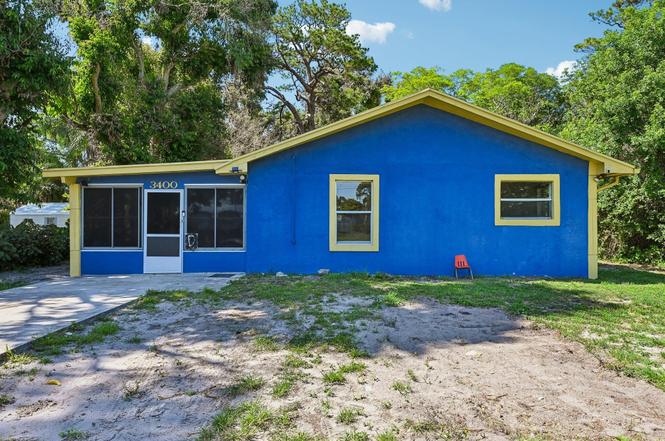
3400 S Avenue S S · Fort Pierce North, FL
Flood risk 1/10 · Minimal
- FEMA flood zone
- X (unshaded)
- Chance of flooding over 30 yrs
- 0.0%
- Est. flood insurance / yr
- $507 – $1,088
Fire risk 3/10 · Minor
- Est. fire insurance / yr
- $947 – $1,759
Heat risk 10/10 · Severe
- Hot days now (above 107°F)
- 7 days/yr
- Hot days in 30 yrs
- 25 days/yr
Wind risk 10/10 · Severe
- Chance of severe wind over 30 yrs
- 99.0%
Air-quality risk 1/10 · Minimal
- Unhealthy air days now
- 0 days/yr
- Unhealthy air days in 30 yrs
- 0 days/yr
Risk factors via First Street. Map © Google.
Why this score? — see what drove the C+ grade
The composite is a weighted blend of 9 inputs, each scored 0–100. Each bar is that input's sub-score; the figure is the points it added to the 100-point composite (weight × sub-score).
- Cash flow +26.9/30.0
- DSCR +9.3/10.0
- ARV discount +6.2/15.0
- 1% rule +6.0/10.0
- Schools +3.7/10.0
- Livability +3.5/5.0
- Rent growth +2.5/5.0
- Condition / age +2.5/5.0
- Appreciation +0.0/10.0
$186,000
🖨 Deal sheet (PDF) 📄 Offer letter ✓ Due diligence
Listing remarks MLS
COUNTRY SETTING SURROUNDED BY NICE HOMES. CB HOME HAS BEEN REFURNISHED, NEW TILE, NEW CARPET, NEW BATHROOM AND KITHCHEN. NEW APPLIANCES ALLOWANCE WITH FULL PRICE OFFER.
Key facts
- Near schools
- Near dining
- Generous yard
Tags
Property features AI
Exterior
- Parking: Parking for 4 vehicles; Concrete parking surface
- Utilities: Public water; Public sewer; Sewer connected; Water available; Cable available; Electric service listed
- Home design: Single family residence; One story; Resale property; Faces south
- Construction: Concrete block construction (no stucco); Shingle roof; Block foundation; Built as one-story (total living area reported separately)
- Exterior features: Shed(s) and storage; Wood fencing; Many trees; Oversized lot; Not waterfront
Interior
- Kitchen: Microwave; Refrigerator
- Bedrooms: Three bedrooms on the main level
- Flooring: Tile flooring
- Bathrooms: One full bathroom; One half bathroom; One main level bathroom
- Heating & cooling: Electric heating; Central air conditioning; Ceiling fans
- Interior features: Microwave; Refrigerator
- Laundry & utility: Laundry area (other type)
Neighborhood map
What this means for you Summary
Snapshot
- This is a 3-bed/1.0-bath single-family listed at $186k.
Deal economics
- At list price, monthly cash flow is $513 ($6k/yr) — positive.
- The deal already cash-flows at list — no discount required.
- Meets the 1% rule at list price ($2k rent vs $186k).
- Cap rate 9.6% vs local median 5.1% in Fort Pierce North — top-decile yield for the area; either an underpriced asset or a hidden risk that comps aren't pricing in. Stress-test before assuming the spread holds.
Location & tenants
- Location reads 69/100 on livability (#480 in FL) — a middle-class / working-renter tenant base. Strengths: commute A+, cost of living A+, housing A+; Watch: schools F, amenities F, employment F.
- St. Lucie (urban): math 40% / reading 48% proficiency, ranked #51 of 73 in FL (top 70%) — families likely to look elsewhere, expect single-tenant / working-renter base with shorter leases.
- Market conditions: 149 active listings in the ZIP; 28 comparable units currently listed for rent nearby; rentals at typical pace (median 24d on market — plan ~3-4 weeks tenant-placement turnaround); 4,868 units permitted in St. Lucie County in 2024 (268 in 5+ unit buildings).
- At $2,049/mo this rent would consume 47% of the median local household income ($52k/yr) (locally 625% of renters already pay >50% of income on rent) — very limited rent-growth headroom before tenants either downsize or default.
Forward outlook
- Local home prices are declining (-3.0%/yr); year-one equity from $1k of loan paydown is wiped out by about $6k of value loss. Plan a longer hold.
- St. Lucie County population projected at +20% by 2050 — long-run rental-demand tailwind backs the buy-and-hold thesis.
- At projected returns (-3.0% appreciation + 3.0% rent growth), your $52k cash investment doubles in ~10 years — after that, you're playing with house money.
Negotiation context
- Only 2 days on market — expect competitive offers; lowballing is unlikely to land.
- 2 sale attempts since 23y ago with the ask held roughly flat each time — persistent listings suggest the price (not the market) is what's stuck; bring a comps-based counter.
- Current owner paid $80k; list at $186k implies a 133% gain — meaningful room to come down on a strong offer.
Risks & watch-outs
- Climate carrying-cost: severe wind risk, 99% chance of damaging wind over 30y; extreme-heat days projected 7→25/yr by 2055 (HVAC capex compounding) — expect insurance premiums to compound above CPI over the hold.
Questions for the listing agent
- Built in 1976 — when were the roof, HVAC, electrical panel, plumbing, and water heater last replaced?
- Is there a deadline driving the sale (1031 exchange, divorce, estate, relocation)? That informs how much negotiation room exists.
- Schools are F-rated, which usually means shorter tenancies and higher turnover. Who's the typical renter profile here, and what's been the actual vacancy rate?
- What's the average days-on-market for RENTAL listings here right now (not sales)? A rising rental-DOM trend means longer vacancies and softer asking-rent achievability than the comps imply.
- What's the recent tenant-quality profile in this submarket — average credit score on applications, eviction rate, late-payment / NSF rate, and stable-employment percentage? A property-management company in the area should have these aggregated.
- How much new for-sale + rental construction is in the pipeline within 1–3 miles? Heavy new supply typically softens prices + rents 12–24 months out; constrained supply supports both.
Investment metrics
- 1% rule
- 1.10% ✓
- Cap rate
- 9.60%
- Cash-on-cash
- 11.82%
- DSCR
- 1.53
- GRM
- 7.6
CMA / ARV
- ARV (on-the-fly)
- $180,604
- Comps found
- 3
Show comp detail 3 sales within ~0.75 mi
| Address | Dist | Beds/Ba | Sqft | Sold | Price | $/sf | Match |
|---|---|---|---|---|---|---|---|
| 2708 Avenue P | 0.45mi | 3/1.0 | 1,080 (-2%) | 21mo | $235,000 | $218 | 57 |
| 3802 Avenue N | 0.41mi | 2/1.0 (-1) | 960 (-13%) | 2mo | $115,000 | $120 | 52 |
| 2003 N 44th St | 0.67mi | 3/1.0 | 1,040 (-6%) | 13mo | $170,000 | $163 | 47 |
Match score weights: distance 35% · size 25% · config 20% · recency 20%. Top-matched comps best support the ARV.
Projected returns pro-forma
-3.0% appreciation · 3.0% rent growth · sell at horizon
- IRR
- 1.2%
- Equity multiple
- 1.05×
- Total profit
- $2,450
- Equity at exit
- $27,733
- IRR
- 10.8%
- Equity multiple
- 1.84×
- Total profit
- $43,878
- Equity at exit
- $16,082
Cash invested: $52,080 (down + closing). Projections, not guarantees.
Landlord ↔ Tenant lean methodology
- Overall (STATE)
- 87 Strongly Landlord-Friendly
- State Florida
- 87 Strongly Landlord-Friendly · R+3
- County
- — inherits STATE
- City
- — inherits STATE
ZIP-level market 34947
- Home prices YoY
- -8.6%
- Active inventory
- 149
- Price-to-rent
- 7.6×
Monthly cashflow live
- Estimated rent
- $2,049 high interval (Pro) →
- Mortgage (P&I)
- −$975
- Tax from tax record
- −$53 /mo · $639/yr
- Insurance
- −$78
- HOA
- −$0
- Vacancy / Maint / Mgmt
- −$430
- Net cashflow
- $513
Break-even live
Sensitivity live
| Price | -10% $618 | -5% $566 | +0% $513 | +5% $460 | +10% $408 |
|---|---|---|---|---|---|
| Rent | -10% $351 | -5% $432 | +0% $513 | +5% $594 | +10% $675 |
| Rate | -1.0pp $607 | -0.5pp $560 | base $513 | +0.5pp $465 | +1.0pp $416 |
UW: 25.0% down · 7.5% · 30yr · 1.5% tax · 5.0% vac · 8.0% maint · 8.0% mgmt
Financing live
Cash to close
- Down payment
- $46,500
- Closing costs
- $5,580
- Reserves months
- —
- Total cash needed
- —
Loan-product check · same deal, 3 products live
Conventional
25% down · 7.5% · 30yr
- Down + closing
- —
- Monthly P&I
- —
- Monthly cashflow
- —
- DSCR
- —
- Eligible?
- —
Personal DTI + credit; lowest rate.
DSCR
20% down · 8.5% · 30yr
- Down + closing
- —
- Monthly P&I
- —
- Monthly cashflow
- —
- DSCR
- —
- Eligible?
- —
No personal income docs; deal must DSCR.
Hard money
10% down · 12.0% · 12mo
- Down + closing
- —
- Monthly P&I
- —
- Monthly cashflow
- —
- DSCR
- —
- Eligible?
- —
Short-term bridge; refi at stabilization.
Rent comps 28 comps
| Address | Beds | Baths | Sqft | Rent | $/sqft | DOM | Units | Dist |
|---|---|---|---|---|---|---|---|---|
| 3101 Avenue T Fort Pierce, FL | 2.0 | 2.0 | 1064 | $1,980 | $1.86 | 24d | 1 | 0.18mi |
| 113 Hilton Dr Fort Pierce, FL | 4.0 | 1.0 | 1160 | $2,000 | $1.72 | 24d | 1 | 0.25mi |
| 3002 Avenue Q Fort Pierce, FL | 2.0 | 1.0 | 864 | $1,900 | $2.20 | 24d | 1 | 0.28mi |
| 107 Bedford Dr Fort Pierce, FL | 4.0 | 1.5 | 1362 | $2,400 | $1.76 | 24d | 1 | 0.49mi |
| 1610 N 25th St Unit 1 Fort Pierce, FL | 2.0 | 1.0 | 740 | $1,600 | $2.16 | 14d | 1 | 0.64mi |
| 1610 N 25th St Unit 10 Fort Pierce, FL | 2.0 | 1.0 | 740 | $1,600 | $2.16 | 24d | 1 | 0.64mi |
| 1610 N 25th St Unit 13 Fort Pierce, FL | 2.0 | 1.0 | 740 | $1,550 | $2.09 | 24d | 1 | 0.64mi |
| 2804 Avenue J Fort Pierce, FL | 3.0 | 1.0 | 816 | $2,000 | $2.45 | 14d | 1 | 0.68mi |
| 4005 Avenue I Unit A Fort Pierce, FL | 2.0 | 1.0 | 880 | $1,600 | $1.82 | 24d | 1 | 0.77mi |
| 4005 Avenue I Unit A Fort Pierce, FL | 2.0 | 1.0 | 880 | $1,600 | $1.82 | 14d | 1 | 0.77mi |
| 1408 N 23rd St Fort Pierce, FL | 3.0 | 1.0 | 1110 | $1,900 | $1.71 | 14d | 1 | 0.80mi |
| 1710 N 21st St Fort Pierce, FL | 3.0 | 1.0 | 968 | $2,100 | $2.17 | 14d | 1 | 0.85mi |
| 1308 N 21st St Apt A Fort Pierce, FL | 2.0 | 1.0 | 1200 | $1,499 | $1.25 | 24d | 1 | 0.94mi |
| 1910 Juanita Ave Fort Pierce, FL | 3.0 | 2.0 | 1100 | $2,000 | $1.82 | 14d | 1 | 0.95mi |
| 2007 N 49th St Fort Pierce, FL | 4.0 | 2.5 | 1450 | $2,399 | $1.65 | 14d | 1 | 0.95mi |
| 2705 Avenue E Fort Pierce, FL | 3.0 | 1.0 | 1161 | $1,800 | $1.55 | 24d | 1 | 1.01mi |
| 1601 N 17th St Fort Pierce, FL | 2.0 | 1.0 | 996 | $1,650 | $1.66 | 24d | 1 | 1.09mi |
| 505 N 27th St Fort Pierce, FL | 3.0 | 1.0 | 879 | $2,660 | $3.03 | 24d | 1 | 1.10mi |
| 907 N 20th St Apt B Fort Pierce, FL | 3.0 | 1.0 | 980 | $1,800 | $1.84 | 24d | 1 | 1.10mi |
| 2908 Dunbar St Fort Pierce, FL | 2.0 | 1.0 | 942 | $1,300 | $1.38 | 21d | 1 | 1.10mi |
| 2809 Jefferson Pkwy Unit A Fort Pierce, FL | 3.0 | 1.0 | 1350 | $2,100 | $1.56 | 14d | 1 | 1.24mi |
| 704 N 18th St Unit B Fort Pierce, FL | 2.0 | 1.0 | 1352 | $1,700 | $1.26 | 24d | 1 | 1.32mi |
| 312 N 27th St Fort Pierce, FL | 2.0 | 1.0 | 868 | $1,600 | $1.84 | 24d | 1 | 1.32mi |
| 2760 Seneca Ave Fort Pierce, FL | 2.0 | 1.0 | 837 | $1,500 | $1.79 | 24d | 1 | 1.33mi |
| 204 N 28th St Fort Pierce, FL | 3.0 | 2.0 | 1000 | $1,550 | $1.55 | 24d | 1 | 1.38mi |
| 1617 Avenue E Fort Pierce, FL | 3.0 | 1.0 | 1100 | $1,800 | $1.64 | 24d | 1 | 1.41mi |
| 1604 Avenue E Fort Pierce, FL | 2.0 | 1.0 | 713 | $1,350 | $1.89 | 14d | 1 | 1.45mi |
| 1220 Avenue L Unit A Fort Pierce, FL | 3.0 | 1.0 | 850 | $1,700 | $2.00 | 24d | 1 | 1.46mi |
Listing history 3 events
-
2026-06-18days on market $186,000 Active 2 DOM
-
2026-06-16remarks 582-char remark
-
2026-06-16$186,000 Active 1 DOM
ⓘ Source: listings_history table (triggers on properties + properties_extension) + one-shot
backfill from property_details.listing_events for pre-trigger history.
Tax reassessment forecast FL · Resets to sale price
- Current annual tax
- $639 · $53/mo
- Projected year-2 tax
- $1,544 · $129/mo
- Expected delta
- +$905/yr (+$75/mo · 141.7%)
ⓘ Screening estimate from a state-policy table — verify with the county assessor before closing.
Climate risk First Street
- Flood 1/10 Low FEMA zone X (unshaded) · 0% chance over 30 yrs
- Wildfire 3/10 Moderate
- Heat 10/10 Extreme 7 d/yr ≥107°F today · 25 d/yr by 30 yrs out
- Wind 10/10 Extreme 99% chance of damaging wind over 30 yrs
- Air quality 1/10 Low 0 unhealthy d/yr today · 0 by 30 yrs out
Nearby sold comps map
Loading sold comps map…
Walkable amenities ~0.75 mi
Loading nearby amenities…
Taxation est. · year 1
- Rental income
- $24,594
- − Mortgage interest
- −$10,419
- − Property taxes
- −$639
- − Insurance
- −$930
- − Repairs & maintenance
- −$1,967
- − Management
- −$1,967
- − Depreciation
- −$5,411
- Taxable income
- $3,260
- Est. tax owed @ 24.0%
- −$782
- After-tax cash flow
- $5,373/yr
For passive investors: Depreciation is non-cash, so a rental often shows a tax loss while cash-flowing — sheltering income. Rental losses are passive: they offset passive income freely, and up to $25,000/yr can offset ordinary (W-2) income if you actively participate and your MAGI is under $100k (phasing out to $0 by $150k); unused losses carry forward. On sale, claimed depreciation is recaptured at up to 25%, and gains may owe capital-gains tax (a 1031 exchange can defer both). Figures are a year-1 estimate at your 24.0% rate — not tax advice; consult a CPA.
Schools (NCES district)
- District
- St. Lucie
- NCES district ID
- 1201770
- Math proficiency
- 40% ▼ -11.00%
- Reading proficiency
- 48% ▼ -4.00%
- Median HH income
- $44,737
- Composite
- 37.28/100
- National rank
- #4449
- State rank
- #51 of 73 in FL
Livability — Fort Pierce North
- Score
- 69/100
- State rank
- #480
- US rank
- #8764
Category grades
Schools grade is shown separately in the Schools card above.
Census & demographics
- Census place
- Fort Pierce North, FL
- County
- Saint Lucie County · 337,150 people
- Metro
- Port St. Lucie, FL
- Population (ZIP)
- 12,804
- Household income
- $51,811
- Rent vs Own
- Severe rent burden
- 625.0
Population outlook (St. Lucie County) Hauer SSP2
- Today (2025)
- 338,016 people
- By 2030
- 355,687 · +5.2%
- By 2040
- 385,521 · +14.1%
- By 2050
- 406,106 · +20.1%
- By 2075
- 441,054 · +30.5%
- By 2100
- 436,885 · +29.2%
Race, ethnicity, and origin ACS 2023
- Neighborhood character
- Diverse neighborhood (Simpson 0.65)
- Race & ethnicity
- Black 52% Hispanic / Latino 22% White 17% Two or more races 10% Asian 5% Native American 1%
- Hispanic origin (detail)
- Mexican 12% Puerto Rican 3% Cuban 1%
- Common ancestry
- Hispanic 8% Italian 2% Romanian 1%
- Foreign-born
- 16% · Canada
- Languages at home
- 73% English-only · Spanish 17% French/Haitian/Cajun 7% Other Indo-European 2%
Political lean MEDSL · St. Lucie
- 2024 margin
- Lean R (+9.1) · D 45.1% · R 54.2%
- 2008→2024 swing
- -21.2pp toward R · 2008: 12.1pp · 2024: -9.1pp
- All cycles
- 2024: R+9.1 2020: R+1.6 2016: R+2.5 2012: D+7.9 2008: D+12.1
Not yet ingested
- Civics
- —
Market trends
- HPI YoY
- ▼ -33.68%
- Current HPI
- 356.2528
- Rent YoY
- —
- Metro
- Port St. Lucie, FL
- State GDP YoY
- ▲ 3.28%
- F500 in state
- 36
Industry mix (Fortune 500 HQ in FL)
| Industry | F500 HQs | Revenue |
|---|---|---|
| Industrial Technology | 2 | $29B |
|
||
| Insurance | 2 | $17B |
|
||
| Retail | 1 | $60B |
|
||
| Technology Distribution | 1 | $58B |
|
||
| Homebuilding | 1 | $35B |
|
||
| Technology Manufacturing | 1 | $35B |
|
||
Price history
+490.5% since first listed6 events — show timeline
- 2026-06-16 Listed $186,000 Beaches MLS
- 2004-04-08 Sold (Public Records) $79,900 Public Records
- 2004-04-05 Sold (MLS) $79,900 Beaches MLS
- 2004-02-20 Listing Removed — Beaches MLS
- 2003-10-01 Listed $79,900 Beaches MLS
- 2000-06-28 Sold (Public Records) $31,500 Public Records
Property tax history
+2.8%/yrLatest (2025): $639 · +18.6% YoY. Source: county tax records.
Cash-flow waterfall
monthlySold comps — $/sqft
last 12 mo · ≤1 miLoading sold comps…