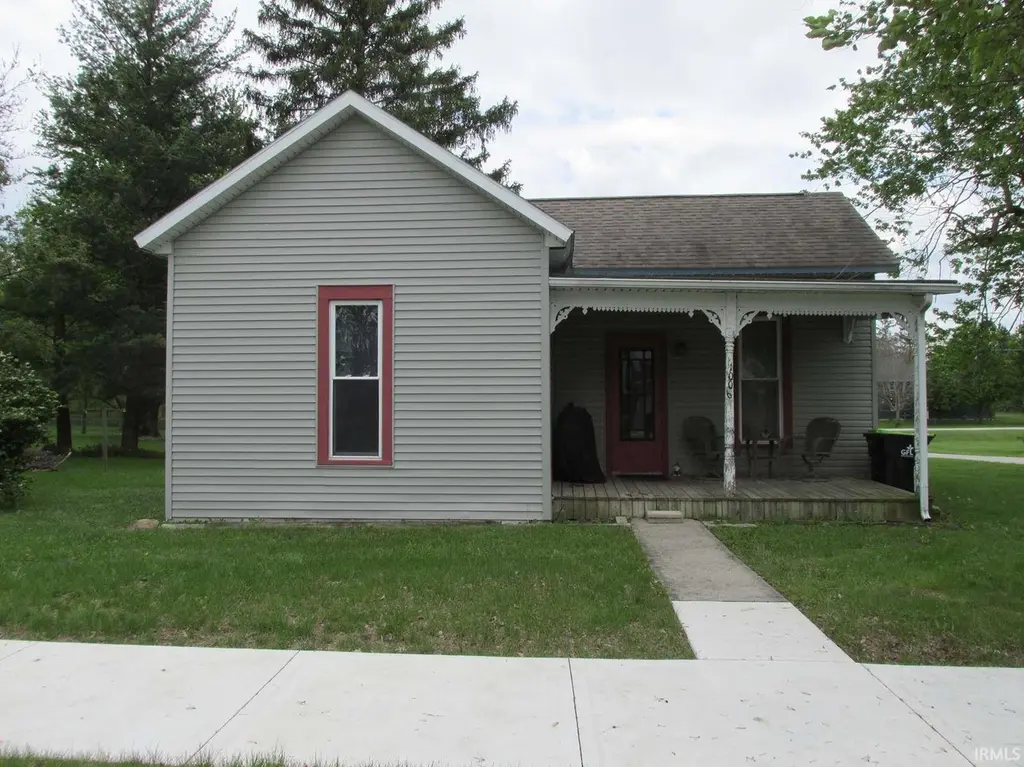
1006 N Wayne St · Warren, IN
Flood risk 1/10 · Minimal
- FEMA flood zone
- X (unshaded)
- Chance of flooding over 30 yrs
- 0.0%
- Est. flood insurance / yr
- $507 – $1,088
Fire risk 1/10 · Minimal
- Est. fire insurance / yr
- $717 – $1,331
Heat risk 3/10 · Minor
- Hot days now (above 100°F)
- 7 days/yr
- Hot days in 30 yrs
- 17 days/yr
Wind risk 2/10 · Minimal
- Chance of severe wind over 30 yrs
- 1.0%
Air-quality risk 2/10 · Minimal
- Unhealthy air days now
- 1 days/yr
- Unhealthy air days in 30 yrs
- 3 days/yr
Risk factors via First Street. Map © Google.
Why this score? — see what drove the C+ grade
The composite is a weighted blend of 9 inputs, each scored 0–100. Each bar is that input's sub-score; the figure is the points it added to the 100-point composite (weight × sub-score).
- Cash flow +22.0/30.0
- ARV discount +15.0/15.0
- DSCR +7.0/10.0
- 1% rule +6.0/10.0
- Livability +3.6/5.0
- Schools +3.1/10.0
- Rent growth +2.5/5.0
- Condition / age +2.5/5.0
- Appreciation +1.4/10.0
$87,400
🖨 Deal sheet (PDF) 📄 Offer letter ✓ Due diligence
Listing remarks
One-story 2-bedroom, 1-bath home on a generous lot with off-street parking. Needs some TLC but the major, big-ticket items have already been addressed—bring your updates and design ideas. Ideal for first-time buyers or investors looking for value and upside in a spacious footprint.
Key facts
- 0.46 acre lot
- Built 1900
- Listed 51 days
Property features AI
Exterior
- Parking: Off-street parking
- Utilities: Public water; Public sewer
- Home design: Single-family residence; Site-built home; One story
- Construction: Vinyl siding; Built with traditional site-built construction
- Exterior features: Covered, enclosed porch
Interior
- Kitchen: Refrigerator; Gas range
- Bedrooms: 5 total rooms (includes bedrooms and other living spaces)
- Bathrooms: 1 full bathroom (main level)
- Heating & cooling: Electric heating; Baseboard heating; Ceiling fans; Window air conditioning units
- Interior features: Ceiling fan(s); Crawl space basement
- Laundry & utility: Electric dryer hookup; Dryer included
Neighborhood map
What this means for you Summary
Snapshot
- This is a 2-bed/1.0-bath single-family listed at $87k.
Deal economics
- At list price, monthly cash flow is $138 ($2k/yr) — positive.
- The deal already cash-flows at list — no discount required.
- Meets the 1% rule at list price ($963 rent vs $87k).
- Recommended offer: $85k (3.0% below list) — sets the bar for market timing.
Location & tenants
- Location reads 71/100 on livability (#137 in IN) — a middle-class / working-renter tenant base. Strengths: crime A+, cost of living A+, housing A+; Watch: health & safety C-, amenities F, commute F.
- Huntington County Community School Corporation (rural): math 34% / reading 39% proficiency, ranked #176 of 301 in IN (top 58%) — families likely to look elsewhere, expect single-tenant / working-renter base with shorter leases.
- Zoned schools: Salamonie Elementary School (math 52% / reading 42%, grade D-, #325 of 994 statewide, top 36%, 286 students, 46% FRL); Riverview School (math 29% / reading 40%, grade F, #167 of 330 statewide, top 52%, 503 students, 54% FRL); Huntington North High School (math 30% / reading 55%, grade F, #195 of 369 statewide, top 53%, 1,424 students, 42% FRL).
- Market conditions: 11 active listings in the ZIP; 79 units permitted in Huntington County in 2024 (0 in 5+ unit buildings).
Forward outlook
- Local home prices are declining (-3.0%/yr); year-one equity from $604 of loan paydown is wiped out by about $3k of value loss. Plan a longer hold.
- Huntington County population projected at -14% by 2050 — secular population decline; favor cash flow + early exit over multi-decade hold.
Negotiation context
- It's been on market 52 days — a 3% lower offer ($85k) is reasonable based on typical stale-listing flexibility.
- Current owner paid $22k; list at $87k implies a 288% gain — meaningful room to come down on a strong offer.
Risks & watch-outs
- Watch-outs: built in 1900 — expect roof / HVAC / electrical / plumbing capex.
Questions for the listing agent
- It's been on market 52 days. Have you received any prior offers? Is the seller open to a 3% concession, seller financing, or rate buy-down credit?
- Built in 1900 — when were the roof, HVAC, electrical panel, plumbing, and water heater last replaced?
- Is there a deadline driving the sale (1031 exchange, divorce, estate, relocation)? That informs how much negotiation room exists.
- What's the average days-on-market for RENTAL listings here right now (not sales)? A rising rental-DOM trend means longer vacancies and softer asking-rent achievability than the comps imply.
- What's the recent tenant-quality profile in this submarket — average credit score on applications, eviction rate, late-payment / NSF rate, and stable-employment percentage? A property-management company in the area should have these aggregated.
- How much new for-sale + rental construction is in the pipeline within 1–3 miles? Heavy new supply typically softens prices + rents 12–24 months out; constrained supply supports both.
Investment metrics
- 1% rule
- 1.10% ✓
- Cap rate
- 8.19%
- Cash-on-cash
- 6.79%
- DSCR
- 1.30
- GRM
- 7.6
CMA / ARV
- ARV (on-the-fly)
- $153,750
- Comps found
- 6
Show comp detail 6 sales within ~0.75 mi
| Address | Dist | Beds/Ba | Sqft | Sold | Price | $/sf | Match |
|---|---|---|---|---|---|---|---|
| 911 N Wayne St | 0.08mi | 2/1.0 | 972 (-5%) | 6mo | $150,000 | $154 | 83 |
| 907 N Main St | 0.09mi | 3/1.0 (+1) | 960 (-6%) | 5mo | $160,000 | $167 | 76 |
| 111 Hendricks St | 0.67mi | 1/1.0 (-1) | 1,081 (+6%) | 11mo | $85,000 | $79 | 46 |
| 311 E 3rd St | 0.50mi | 3/1.0 (+1) | 1,096 (+7%) | 21mo | $150,000 | $137 | 42 |
| 101 College St | 0.65mi | 2/1.0 | 1,177 (+15%) | 16mo | $115,000 | $98 | 32 |
| 126 College St | 0.58mi | 2/1.0 | 882 (-14%) | 24mo | $132,000 | $150 | 30 |
Match score weights: distance 35% · size 25% · config 20% · recency 20%. Top-matched comps best support the ARV.
Projected returns pro-forma
-3.0% appreciation · 3.0% rent growth · sell at horizon
- IRR
- -5.8%
- Equity multiple
- 0.78×
- Total profit
- $-5,316
- Equity at exit
- $13,032
- IRR
- 3.8%
- Equity multiple
- 1.28×
- Total profit
- $6,834
- Equity at exit
- $7,557
Cash invested: $24,472 (down + closing). Projections, not guarantees.
Landlord ↔ Tenant lean methodology
- Overall (STATE)
- 90 Strongly Landlord-Friendly
- State Indiana
- 90 Strongly Landlord-Friendly · R+11
- County
- — inherits STATE
- City
- — inherits STATE
ZIP-level market 46792
- Home prices YoY
- -2.9%
- Active inventory
- 11
- Price-to-rent
- 7.6×
Monthly cashflow live
- Estimated rent
- $963 medium interval (Pro) →
- Mortgage (P&I)
- −$458
- Tax from tax record
- −$128 /mo · $1,532/yr
- Insurance
- −$36
- HOA
- −$0
- Vacancy / Maint / Mgmt
- −$202
- Net cashflow
- $138
Break-even live
Sensitivity live
| Price | -10% $188 | -5% $163 | +0% $138 | +5% $114 | +10% $89 |
|---|---|---|---|---|---|
| Rent | -10% $62 | -5% $100 | +0% $138 | +5% $177 | +10% $215 |
| Rate | -1.0pp $183 | -0.5pp $161 | base $138 | +0.5pp $116 | +1.0pp $93 |
UW: 25.0% down · 7.5% · 30yr · 1.5% tax · 5.0% vac · 8.0% maint · 8.0% mgmt
Financing live
Cash to close
- Down payment
- $21,850
- Closing costs
- $2,622
- Reserves months
- —
- Total cash needed
- —
Loan-product check · same deal, 3 products live
Conventional
25% down · 7.5% · 30yr
- Down + closing
- —
- Monthly P&I
- —
- Monthly cashflow
- —
- DSCR
- —
- Eligible?
- —
Personal DTI + credit; lowest rate.
DSCR
20% down · 8.5% · 30yr
- Down + closing
- —
- Monthly P&I
- —
- Monthly cashflow
- —
- DSCR
- —
- Eligible?
- —
No personal income docs; deal must DSCR.
Hard money
10% down · 12.0% · 12mo
- Down + closing
- —
- Monthly P&I
- —
- Monthly cashflow
- —
- DSCR
- —
- Eligible?
- —
Short-term bridge; refi at stabilization.
Listing history 19 events
-
2026-06-21days on market $87,400 Active 52 DOM
-
2026-06-19days on market $87,400 Active 50 DOM
-
2026-06-18days on market $87,400 Active 49 DOM
-
2026-06-17days on market $87,400 Active 48 DOM
-
2026-06-16days on market $87,400 Active 47 DOM
-
2026-06-15days on market $87,400 Active 46 DOM
-
2026-06-14days on market $87,400 Active 44 DOM
-
2026-06-12pricedays on market $87,400 Active 43 DOM
-
2026-06-09days on market $89,900 Active 40 DOM
-
2026-06-08days on market $89,900 Active 39 DOM
-
2026-06-07days on market $89,900 Active 38 DOM
-
2026-06-05days on market $89,900 Active 35 DOM
-
2026-06-03days on market $89,900 Active 34 DOM
-
2026-06-02days on market $89,900 Active 33 DOM
-
2026-06-01days on market $89,900 Active 32 DOM
-
2026-05-31days on market $89,900 Active 31 DOM
-
2026-05-30days on market $89,900 Active 30 DOM
-
2026-04-28$89,900 Active
-
2011-02-18soldstatus $22,500
ⓘ Source: listings_history table (triggers on properties + properties_extension) + one-shot
backfill from property_details.listing_events for pre-trigger history.
Tax reassessment forecast IN · Partial reset (capped growth)
- Current annual tax
- $1,532 · $128/mo
- Projected year-2 tax
- $1,532 · $128/mo
- Expected delta
- $0/yr ($0/mo · 0.0%)
ⓘ Screening estimate from a state-policy table — verify with the county assessor before closing.
Climate risk First Street
- Flood 1/10 Low FEMA zone X (unshaded) · 0% chance over 30 yrs
- Wildfire 1/10 Low
- Heat 3/10 Moderate 7 d/yr ≥100°F today · 17 d/yr by 30 yrs out
- Wind 2/10 Low 100% chance of damaging wind over 30 yrs
- Air quality 2/10 Low 1 unhealthy d/yr today · 3 by 30 yrs out
Nearby sold comps map
Loading sold comps map…
Walkable amenities ~0.75 mi
Loading nearby amenities…
Taxation est. · year 1
- Rental income
- $11,558
- − Mortgage interest
- −$4,896
- − Property taxes
- −$1,532
- − Insurance
- −$437
- − Repairs & maintenance
- −$925
- − Management
- −$925
- − Depreciation
- −$2,543
- Taxable income
- $302
- Est. tax owed @ 24.0%
- −$72
- After-tax cash flow
- $1,590/yr
For passive investors: Depreciation is non-cash, so a rental often shows a tax loss while cash-flowing — sheltering income. Rental losses are passive: they offset passive income freely, and up to $25,000/yr can offset ordinary (W-2) income if you actively participate and your MAGI is under $100k (phasing out to $0 by $150k); unused losses carry forward. On sale, claimed depreciation is recaptured at up to 25%, and gains may owe capital-gains tax (a 1031 exchange can defer both). Figures are a year-1 estimate at your 24.0% rate — not tax advice; consult a CPA.
Schools (NCES district)
- District
- Huntington County Community School Corporation
- NCES district ID
- 1804710
- Math proficiency
- 34% ▼ -6.00%
- Reading proficiency
- 39% ▼ -10.00%
- Median HH income
- $47,010
- Composite
- 31.29/100
- National rank
- #6013
- State rank
- #176 of 301 in IN
Livability — Warren
- Score
- 71/100
- State rank
- #137
- US rank
- #7126
Category grades
Schools grade is shown separately in the Schools card above.
Census & demographics
- Census place
- Warren, IN
- Population (ZIP)
- 3,577
Population outlook (Huntington County) Hauer SSP2
- Today (2025)
- 35,613 people
- By 2030
- 34,759 · -2.4%
- By 2040
- 32,682 · -8.2%
- By 2050
- 30,495 · -14.4%
- By 2075
- 26,298 · -26.2%
- By 2100
- 22,653 · -36.4%
Race, ethnicity, and origin ACS 2023
- Neighborhood character
- Predominantly White (95%)
- Race & ethnicity
- White 95% Two or more races 3% Hispanic / Latino 1%
- Common ancestry
- Italian 5% Slovak 2% Lithuanian 2%
- Foreign-born
- 1%
- Languages at home
- 98% English-only · Spanish 1%
Political lean MEDSL · Huntington
- 2024 margin
- Solid R (+48.4) · D 24.9% · R 73.3% · Other 1.8%
- 2008→2024 swing
- -21.2pp toward R · 2008: -27.2pp · 2024: -48.4pp
- All cycles
- 2024: R+48.4 2020: R+49.9 2016: R+51.0 2012: R+39.8 2008: R+27.2
Not yet ingested
- Civics
- —
Market trends
- HPI YoY
- ▼ -7.11%
- Current HPI
- 238.5693
- Rent YoY
- —
- Metro
- —
- State GDP YoY
- ▲ 2.90%
- F500 in state
- 18
Industry mix (Fortune 500 HQ in IN)
| Industry | F500 HQs | Revenue |
|---|---|---|
| Industrial Machinery | 2 | $37B |
|
||
| Healthcare | 1 | $177B |
|
||
| Pharmaceuticals | 1 | $45B |
|
||
| Metals / Steel | 1 | $18B |
|
||
| Agriculture | 1 | $17B |
|
||
| Packaging | 1 | $12B |
|
||
Price history
+299.6% since first listed2 events — show timeline
- 2026-04-28 Listed $89,900 IRMLS
- 2011-02-18 Sold (Public Records) $22,500 Public Records
Property tax history
+5.1%/yrLatest (2024): $1,532 · +18.0% YoY. Source: county tax records.
Cash-flow waterfall
monthlySold comps — $/sqft
last 12 mo · ≤1 miLoading sold comps…